| Param | Original file | Final file |
|---|---|---|
| Filename | modeM0/AS1A03_124T01_9000001486_10322cztM0_level2.evt | modeM0/AS1A03_124T01_9000001486_10322cztM0_level2_quad_clean.evt |
| Size (bytes) | 481,138,560 | 92,825,280 |
| Size | 458.8 MB | 88.5 MB |
| Events in quadrant A | 3,433,089 | 597,141 |
| Events in quadrant B | 3,737,005 | 599,055 |
| Events in quadrant C | 3,160,071 | 583,204 |
| Events in quadrant D | 3,778,393 | 557,108 |
| Mode M0 | |||
|---|---|---|---|
| Quadrant | BADHDUFLAG | Total packets | Discarded packets |
| A | 0 | 14452 | 3 |
| B | 0 | 15280 | 2 |
| C | 0 | 13922 | 2 |
| D | 0 | 15455 | 2 |
| Mode M9 | |||
|---|---|---|---|
| Quadrant | BADHDUFLAG | Total packets | Discarded packets |
| A | 0 | 17 | 0 |
| B | 0 | 17 | 0 |
| C | 0 | 17 | 0 |
| D | 0 | 18 | 0 |
| Mode SS | |||
|---|---|---|---|
| Quadrant | BADHDUFLAG | Total packets | Discarded packets |
| A | 0 | 140 | 0 |
| B | 0 | 140 | 0 |
| C | 0 | 140 | 0 |
| D | 0 | 140 | 0 |
| Quadrant | Total seconds | Saturated seconds | Saturation percentage |
|---|---|---|---|
| A | 6803 | 127 | 1.866823% |
| B | 6803 | 163 | 2.396002% |
| C | 6803 | 65 | 0.955461% |
| D | 6803 | 207 | 3.042775% |
Noise dominated data is calculated using 1-second bins in cleaned event files. If a bin has >2000 counts, and if more than 50% of those come from <1% of pixels, then it is considered to be noise-dominated and hence unusable.
| Quadrant | # 1 sec bins | Bins with >0 counts | Bins with >2000 counts | High rate bins dominated by noise | Noise dominated (total time) | Noise dominated (detector-on time) | Marked lightcurve |
|---|---|---|---|---|---|---|---|
| A | 7793 | 6803 | 20 | 20 | 0.26% | 0.29% | 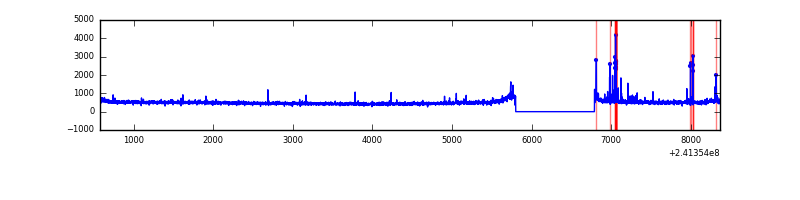 |
| B | 7793 | 6803 | 48 | 48 | 0.62% | 0.71% | 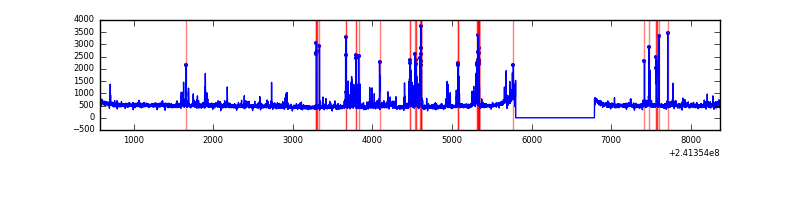 |
| C | 7793 | 6803 | 1 | 1 | 0.01% | 0.01% | 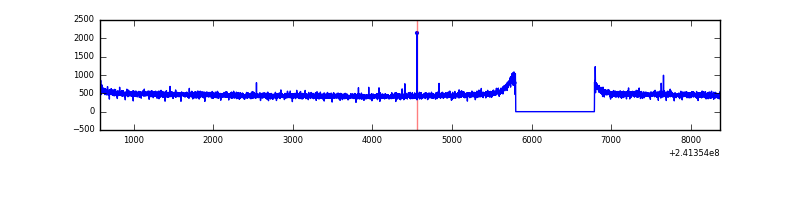 |
| D | 7793 | 6803 | 107 | 107 | 1.37% | 1.57% | 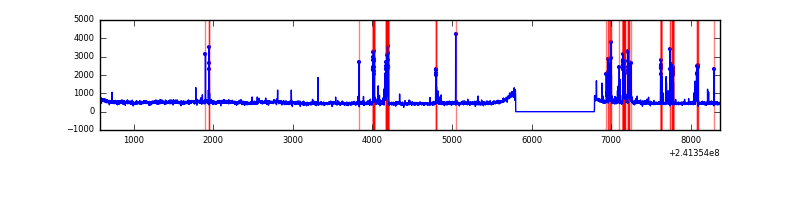 |
Top three noisy pixels from each quadrant. If the there are fewer than three noisy pixels in the level2.evt file, extra rows are filled as -1
| Pixel properties | Quadrant properties | ||||||
|---|---|---|---|---|---|---|---|
| Quadrant | DetID | PixID | Counts | Sigma | Mean | Median | Sigma |
| A | 8 | 5 | 115954 | 676.36 | 838 | 822 | 170.2 |
| A | 8 | 15 | 60928 | 353.1 | 838 | 822 | 170.2 |
| A | 4 | 2 | 19980 | 112.55 | 838 | 822 | 170.2 |
| B | 4 | 239 | 379885 | 2391.57 | 832 | 815 | 158.5 |
| B | 11 | 51 | 78186 | 488.14 | 832 | 815 | 158.5 |
| B | 0 | 214 | 34122 | 210.14 | 832 | 815 | 158.5 |
| C | 14 | 234 | 10162 | 50.37 | 807 | 810 | 185.7 |
| C | 13 | 61 | 6038 | 28.16 | 807 | 810 | 185.7 |
| C | 1 | 3 | 2244 | 7.72 | 807 | 810 | 185.7 |
| D | 2 | 14 | 264117 | 1367.23 | 802 | 780 | 192.6 |
| D | 8 | 195 | 206772 | 1069.5 | 802 | 780 | 192.6 |
| D | 2 | 33 | 173611 | 897.33 | 802 | 780 | 192.6 |
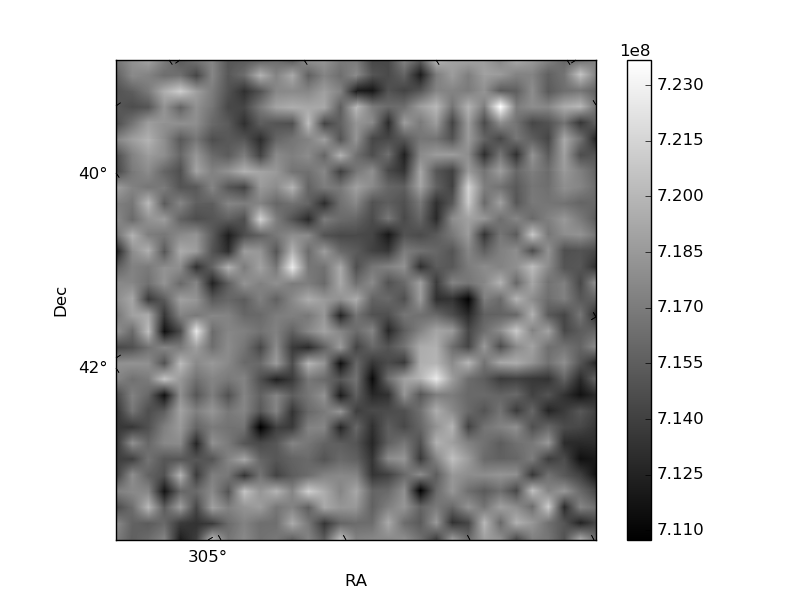
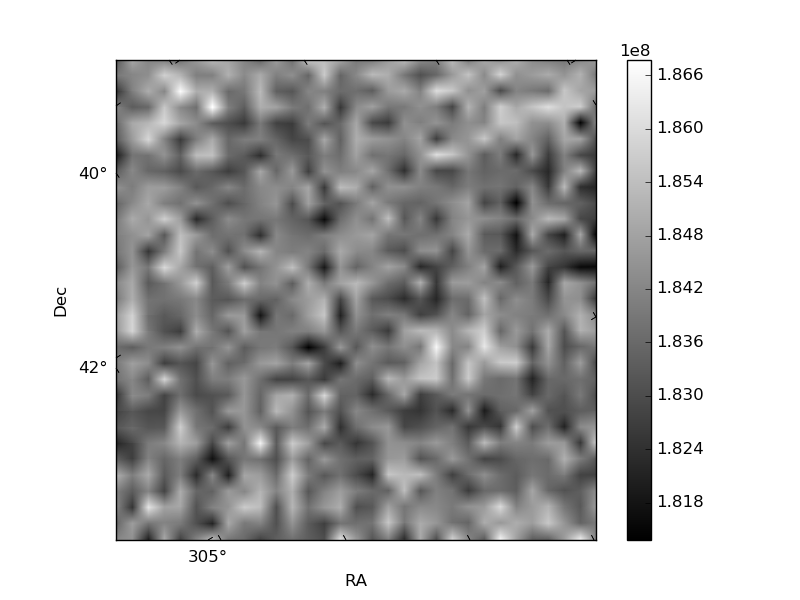
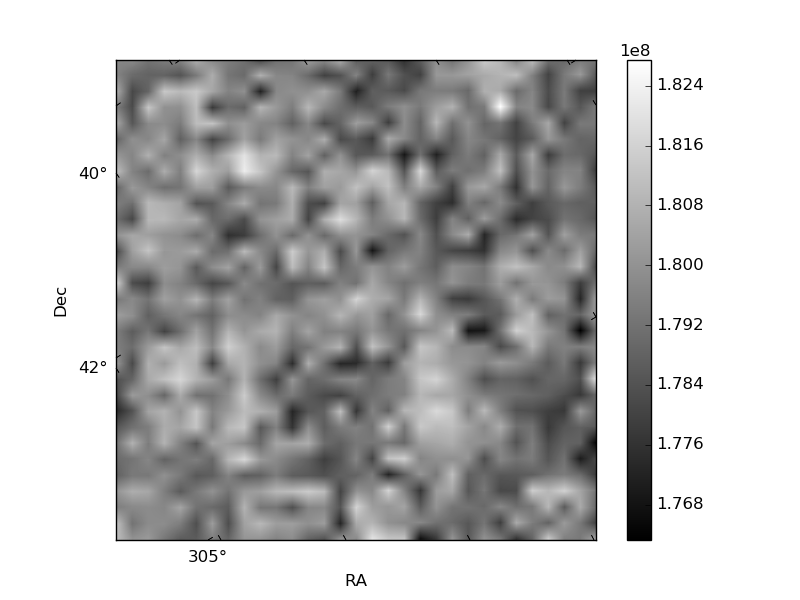
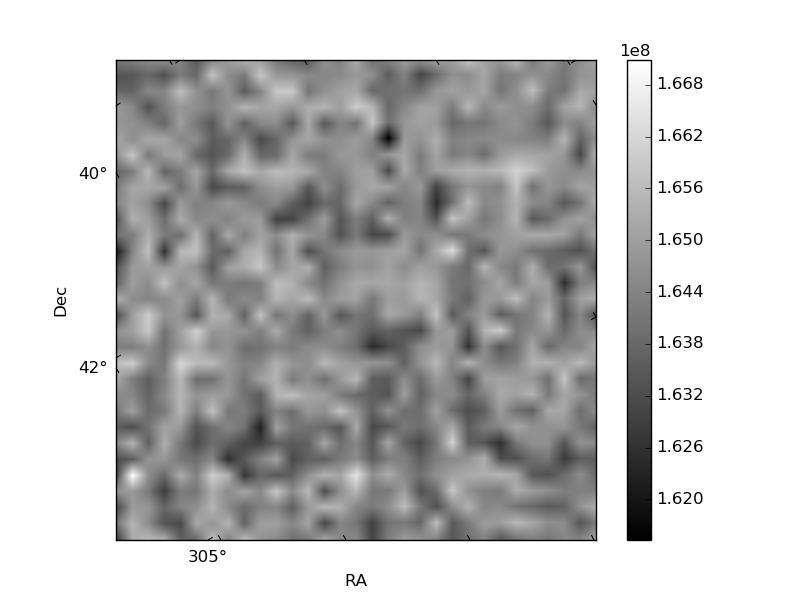
Histogram calculated using DETX and DETY for each event in the final _common_clean file
| Quadrant A | 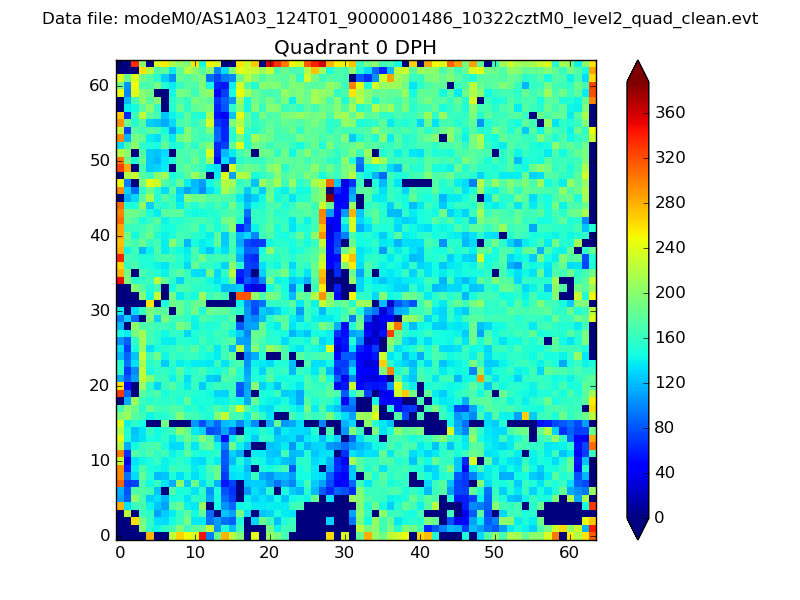 |
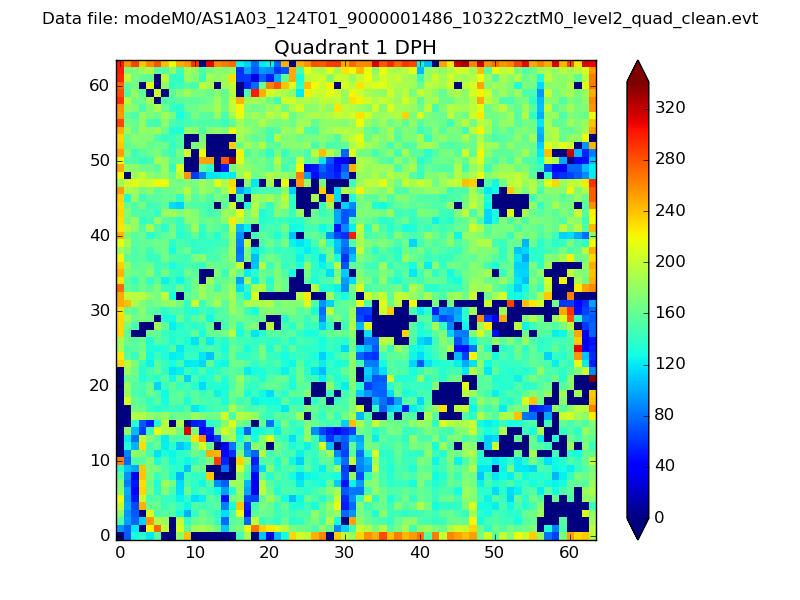 |
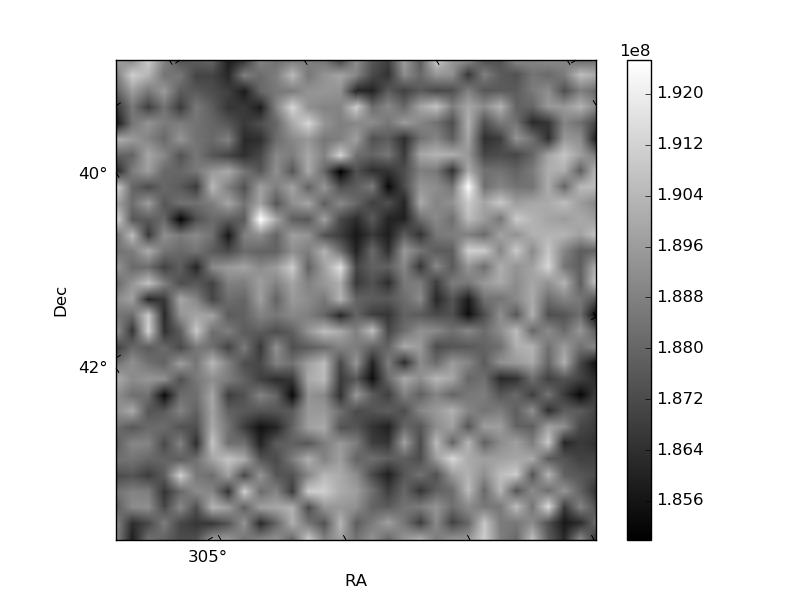
Quadrant B |
|---|---|---|---|
| Quadrant D | 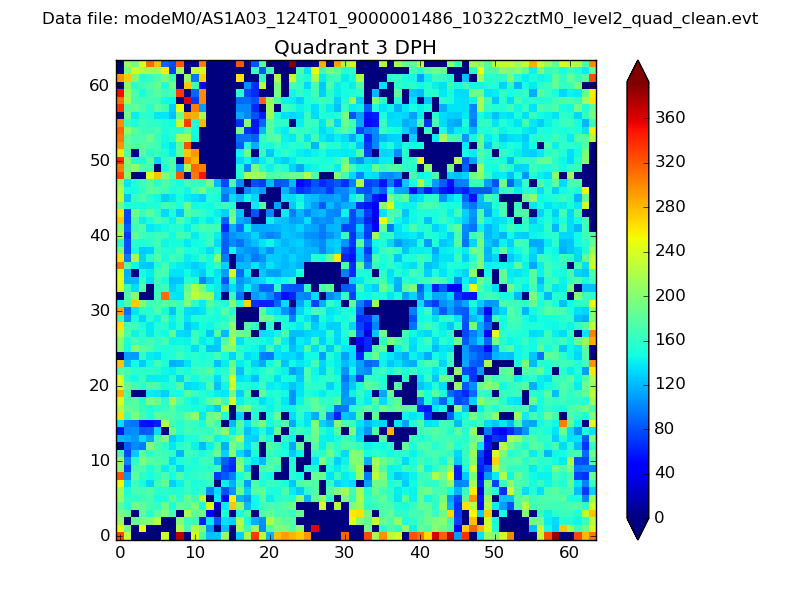 |
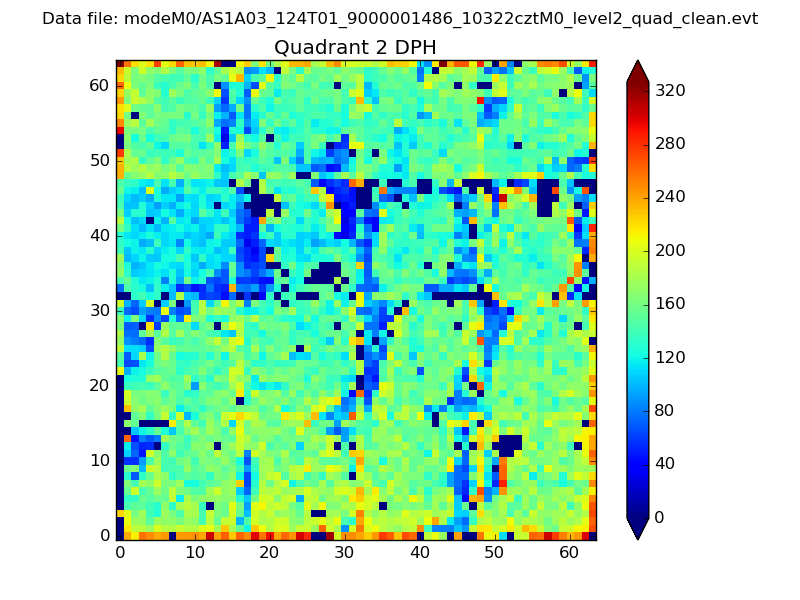 |
Quadrant C |
| Plot type | Count rate plots | Images |
|---|---|---|
| Comparison with Poisson distribution Blue bars denote a histogram of data divided into 1 sec bins. Red curve is a Poisson curve with rate = median count rate of data. |
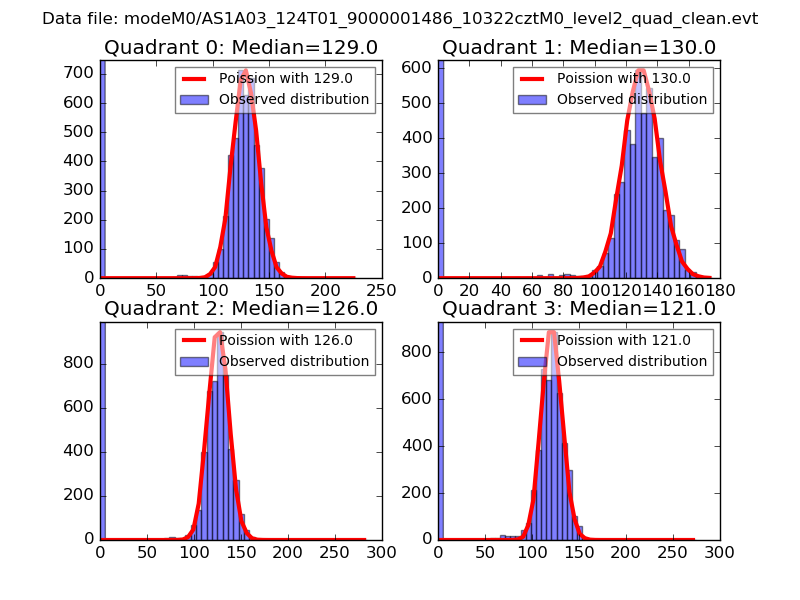 |
 |
| Quadrant-wise count rates Data is divided into 100 sec bins |
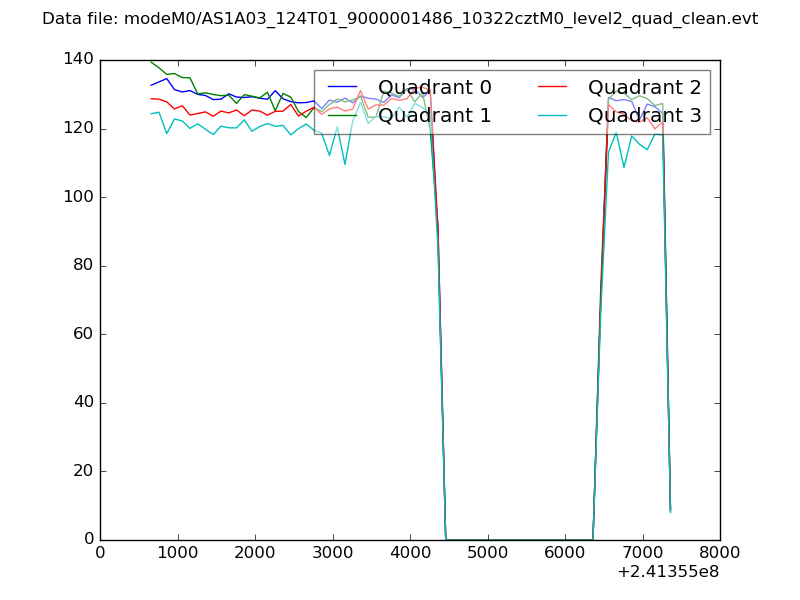 |
|
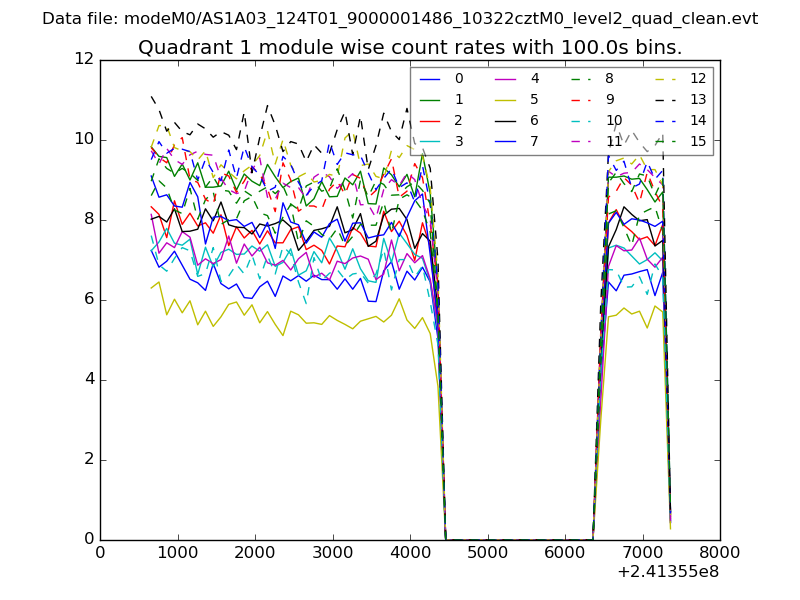
| Module-wise count rates for Quadrant A Data is divided into 100 sec bins |
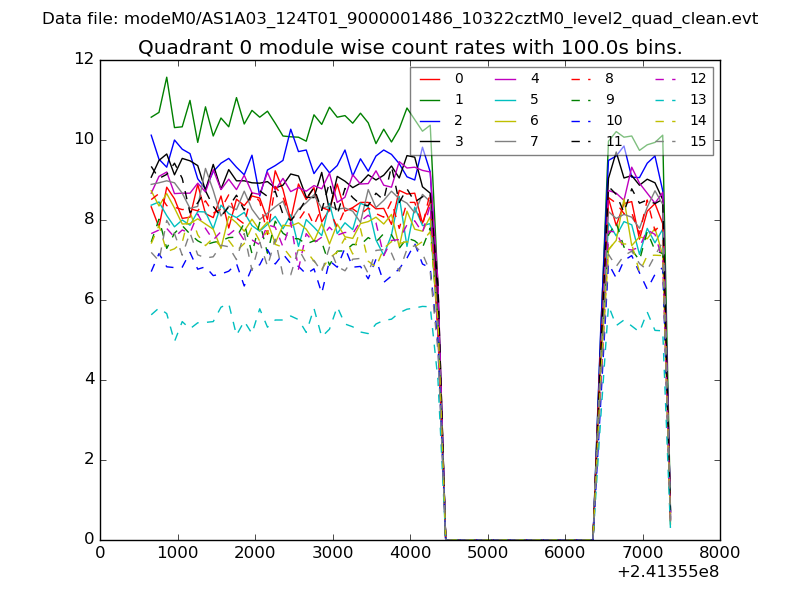 |
 |
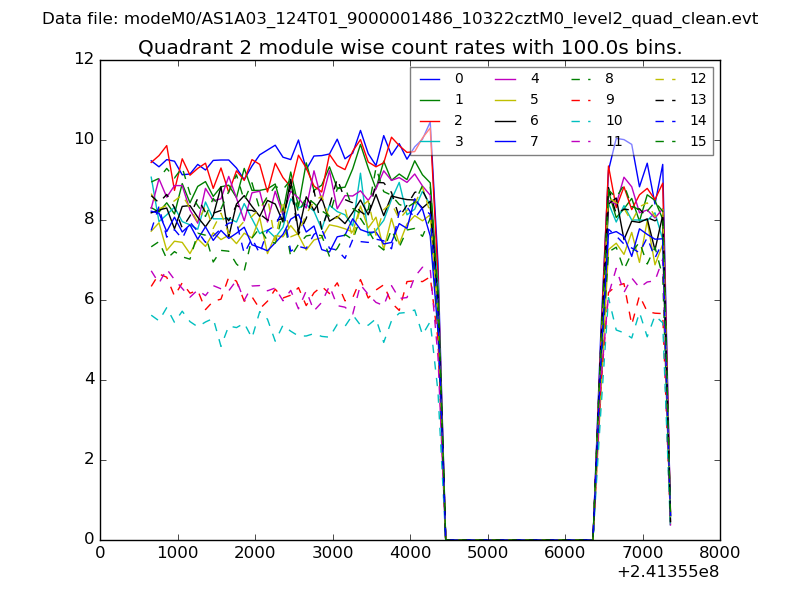
| Module-wise count rates for Quadrant B Data is divided into 100 sec bins |
 |
 |
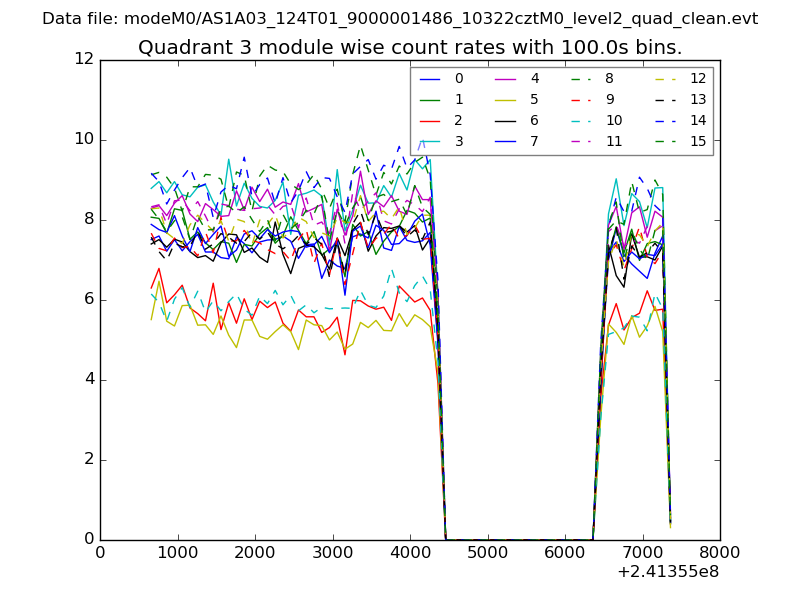
| Module-wise count rates for Quadrant C Data is divided into 100 sec bins |
 |
 |
| Module-wise count rates for Quadrant D Data is divided into 100 sec bins |
 |
 |
| Parameter | Plot |
|---|---|
| CZT HV Monitor | 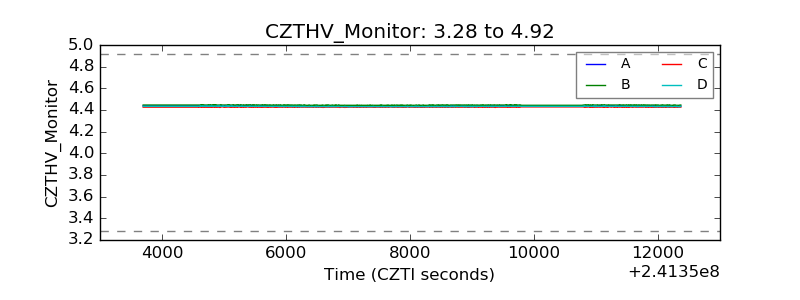 |
| D_VDD |  |
| Temperature 1 | 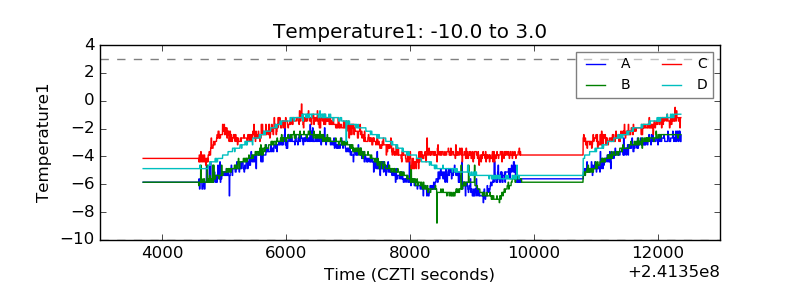 |
| Veto HV Monitor | 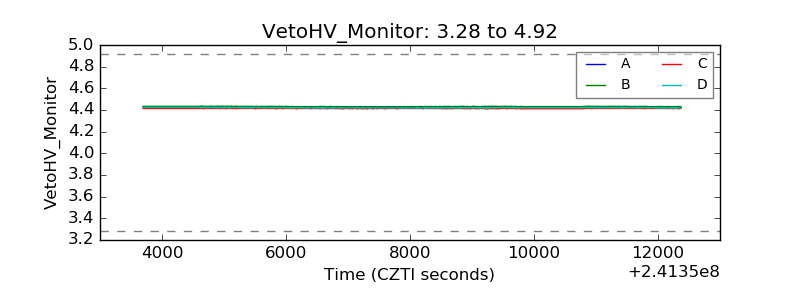 |
| Veto LLD | 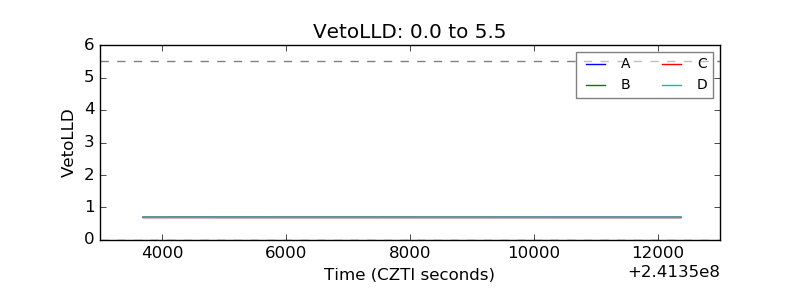 |
| Alpha Counter | 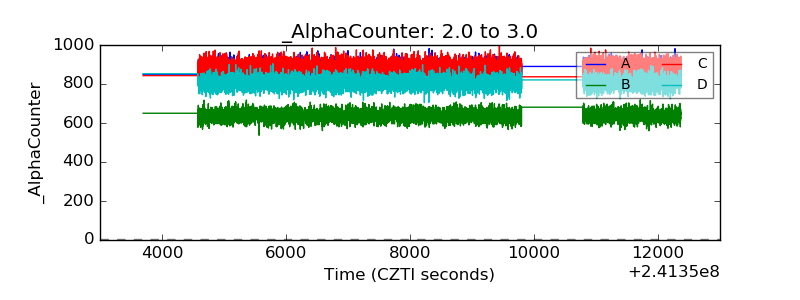 |
| _CPM_Rate | 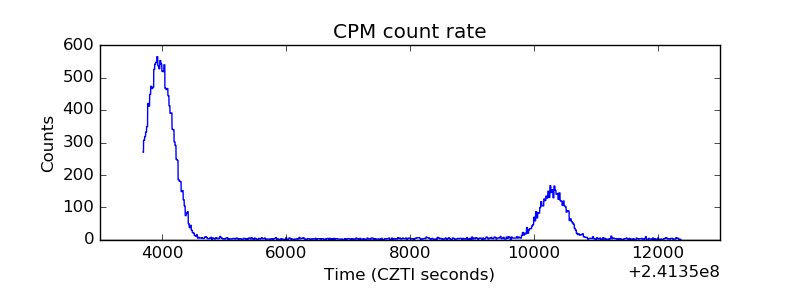 |
| CZT Counter | 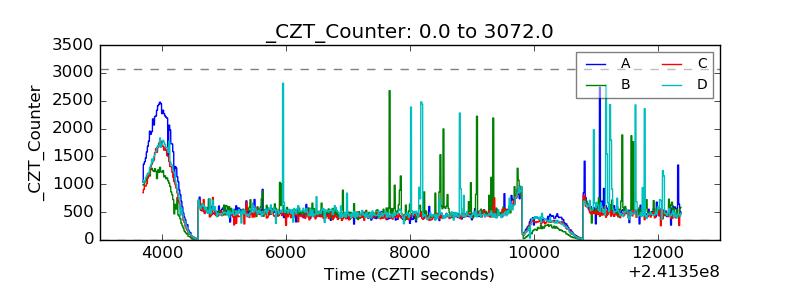 |
| +2.5 Volts monitor |  |
| +5 Volts monitor |  |
| _ROLL_ROT | 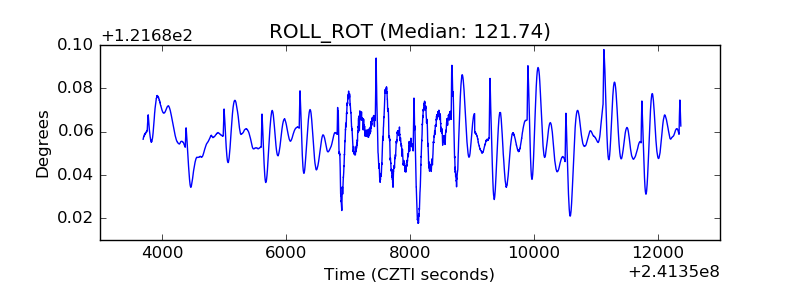 |
| _Roll_DEC | 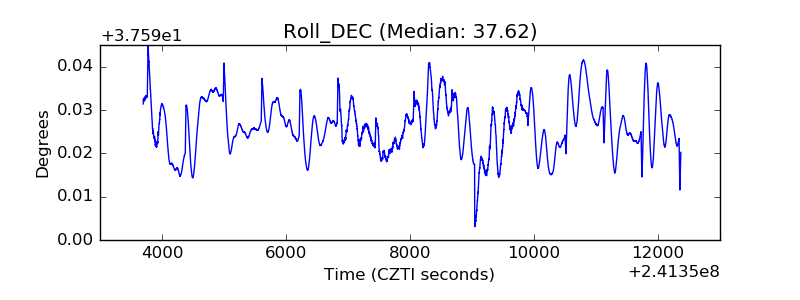 |
| _Roll_RA | 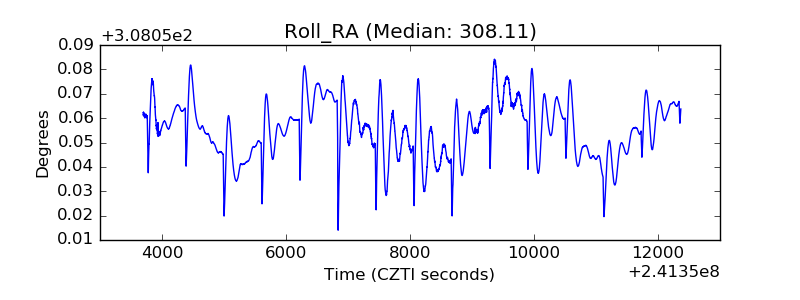 |
| Veto Counter | 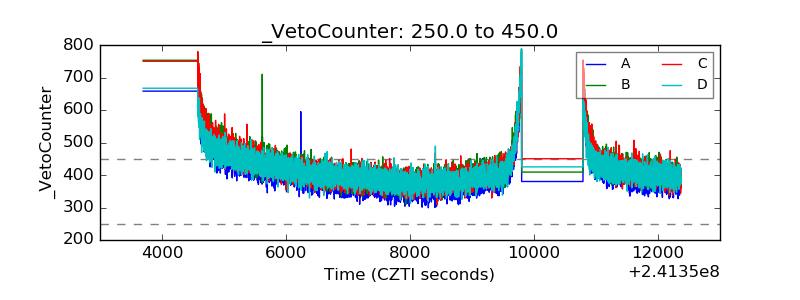 |