| Param | Original file | Final file |
|---|---|---|
| Filename | modeM0/AS1A03_124T01_9000001486_10323cztM0_level2.evt | modeM0/AS1A03_124T01_9000001486_10323cztM0_level2_quad_clean.evt |
| Size (bytes) | 441,858,240 | 93,124,800 |
| Size | 421.4 MB | 88.8 MB |
| Events in quadrant A | 3,155,599 | 603,544 |
| Events in quadrant B | 3,496,664 | 608,529 |
| Events in quadrant C | 2,915,176 | 592,181 |
| Events in quadrant D | 3,375,385 | 565,887 |
| Mode M0 | |||
|---|---|---|---|
| Quadrant | BADHDUFLAG | Total packets | Discarded packets |
| A | 0 | 13705 | 2 |
| B | 0 | 14550 | 1 |
| C | 0 | 13216 | 1 |
| D | 0 | 14302 | 1 |
| Mode M9 | |||
|---|---|---|---|
| Quadrant | BADHDUFLAG | Total packets | Discarded packets |
| A | 0 | 5 | 0 |
| B | 0 | 5 | 0 |
| C | 0 | 5 | 0 |
| D | 0 | 5 | 0 |
| Mode SS | |||
|---|---|---|---|
| Quadrant | BADHDUFLAG | Total packets | Discarded packets |
| A | 0 | 132 | 0 |
| B | 0 | 132 | 0 |
| C | 0 | 132 | 0 |
| D | 0 | 132 | 0 |
| Quadrant | Total seconds | Saturated seconds | Saturation percentage |
|---|---|---|---|
| A | 6448 | 153 | 2.372829% |
| B | 6448 | 150 | 2.326303% |
| C | 6448 | 88 | 1.364764% |
| D | 6448 | 169 | 2.620968% |
Noise dominated data is calculated using 1-second bins in cleaned event files. If a bin has >2000 counts, and if more than 50% of those come from <1% of pixels, then it is considered to be noise-dominated and hence unusable.
| Quadrant | # 1 sec bins | Bins with >0 counts | Bins with >2000 counts | High rate bins dominated by noise | Noise dominated (total time) | Noise dominated (detector-on time) | Marked lightcurve |
|---|---|---|---|---|---|---|---|
| A | 6968 | 6448 | 16 | 16 | 0.23% | 0.25% | 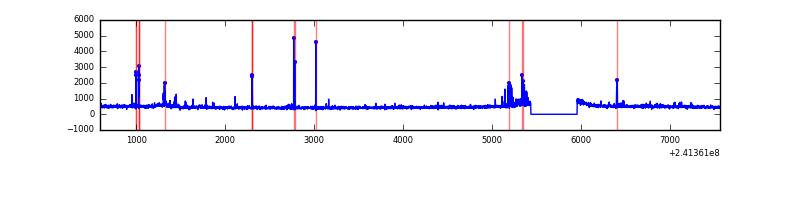 |
| B | 6968 | 6449 | 42 | 42 | 0.60% | 0.65% | 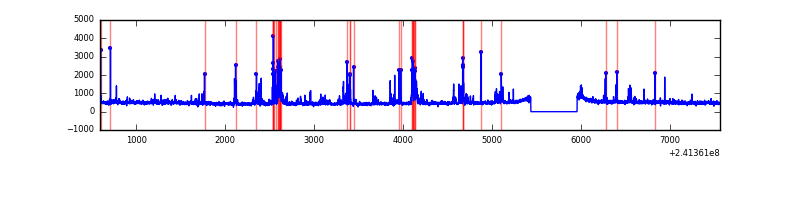 |
| C | 6968 | 6449 | 0 | 0 | 0.00% | 0.00% | 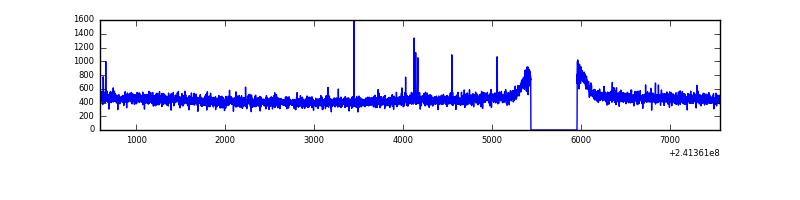 |
| D | 6968 | 6449 | 59 | 59 | 0.85% | 0.91% | 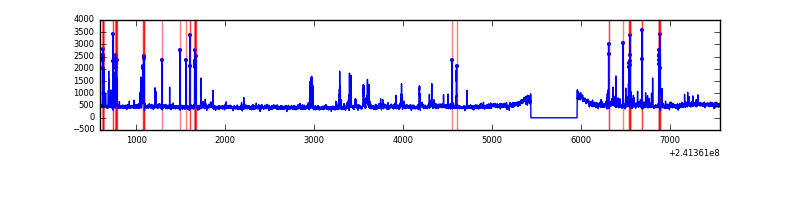 |
Top three noisy pixels from each quadrant. If the there are fewer than three noisy pixels in the level2.evt file, extra rows are filled as -1
| Pixel properties | Quadrant properties | ||||||
|---|---|---|---|---|---|---|---|
| Quadrant | DetID | PixID | Counts | Sigma | Mean | Median | Sigma |
| A | 8 | 5 | 125496 | 798.33 | 764 | 746 | 156.3 |
| A | 4 | 2 | 42187 | 265.2 | 764 | 746 | 156.3 |
| A | 8 | 15 | 28434 | 177.19 | 764 | 746 | 156.3 |
| B | 4 | 239 | 421593 | 2918.85 | 761 | 744 | 144.2 |
| B | 11 | 51 | 52716 | 360.46 | 761 | 744 | 144.2 |
| B | 0 | 214 | 44216 | 301.51 | 761 | 744 | 144.2 |
| C | 14 | 234 | 10208 | 55.01 | 742 | 746 | 172.0 |
| C | 12 | 4 | 7813 | 41.09 | 742 | 746 | 172.0 |
| C | 13 | 61 | 5613 | 28.3 | 742 | 746 | 172.0 |
| D | 2 | 33 | 204356 | 1153.71 | 738 | 717 | 176.5 |
| D | 8 | 195 | 173645 | 979.72 | 738 | 717 | 176.5 |
| D | 2 | 14 | 71851 | 403.01 | 738 | 717 | 176.5 |
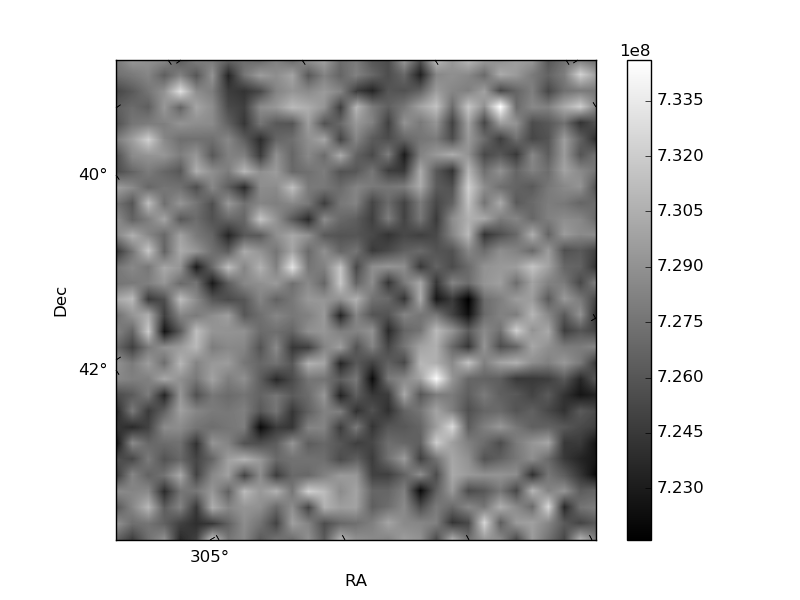
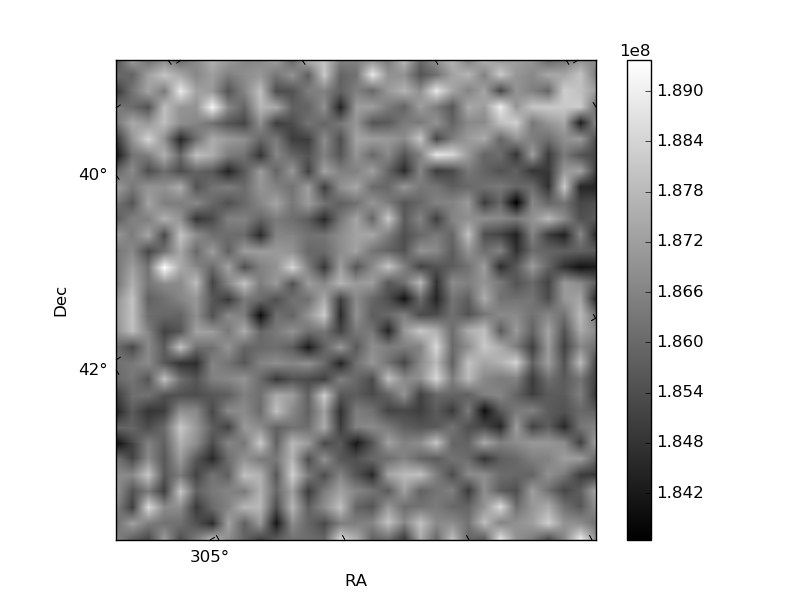
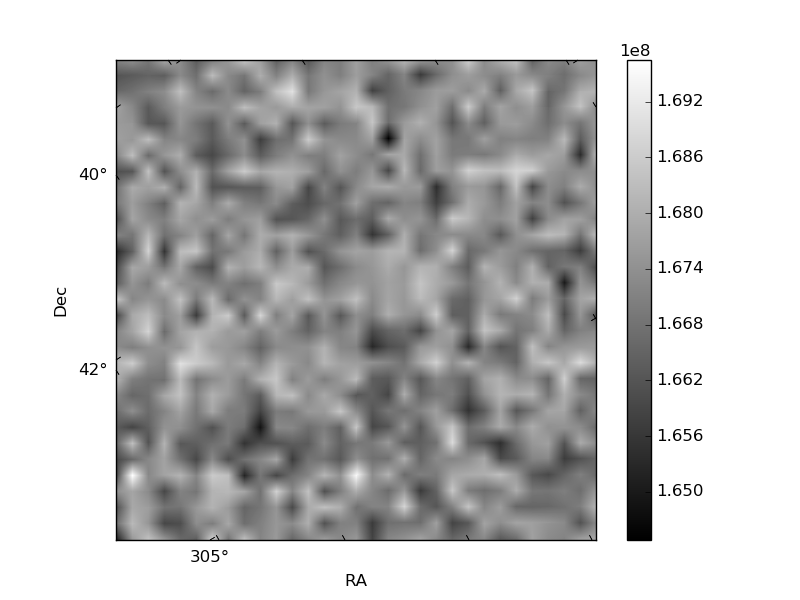
Histogram calculated using DETX and DETY for each event in the final _common_clean file
| Quadrant A | 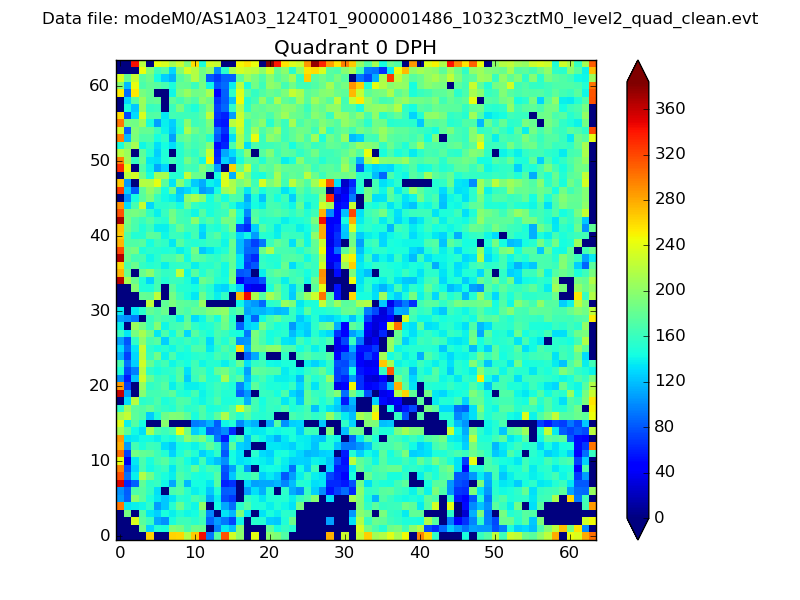 |
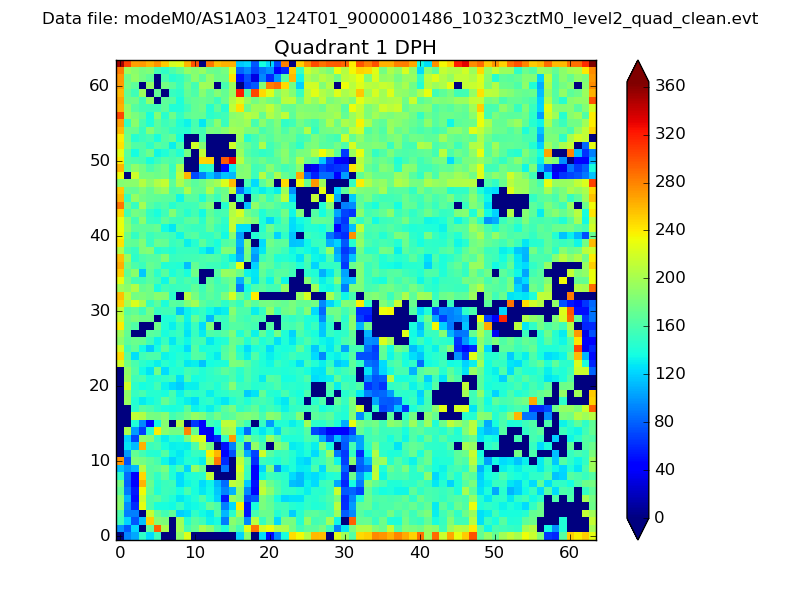 |
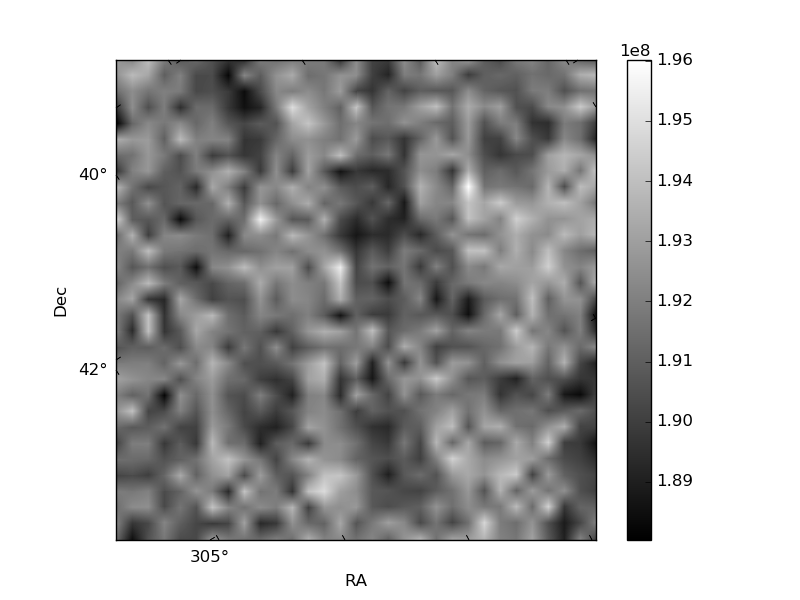
Quadrant B |
|---|---|---|---|
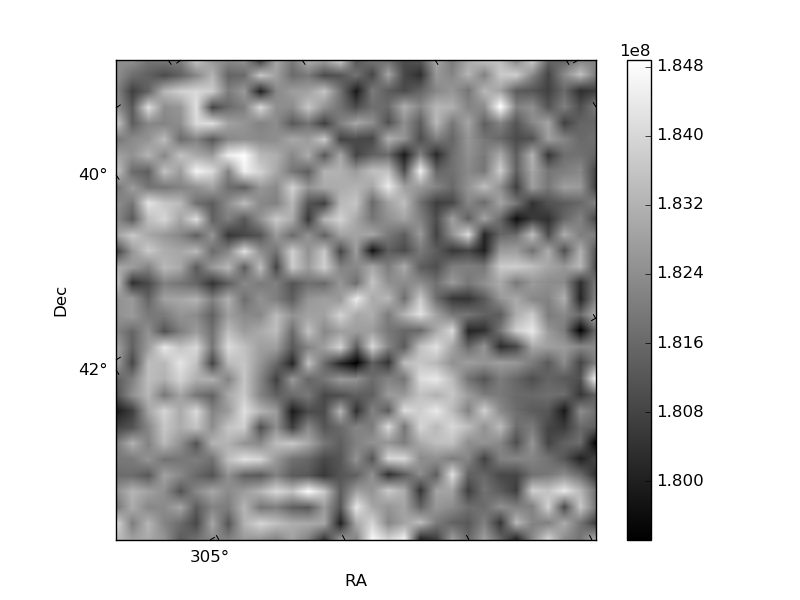
| Quadrant D | 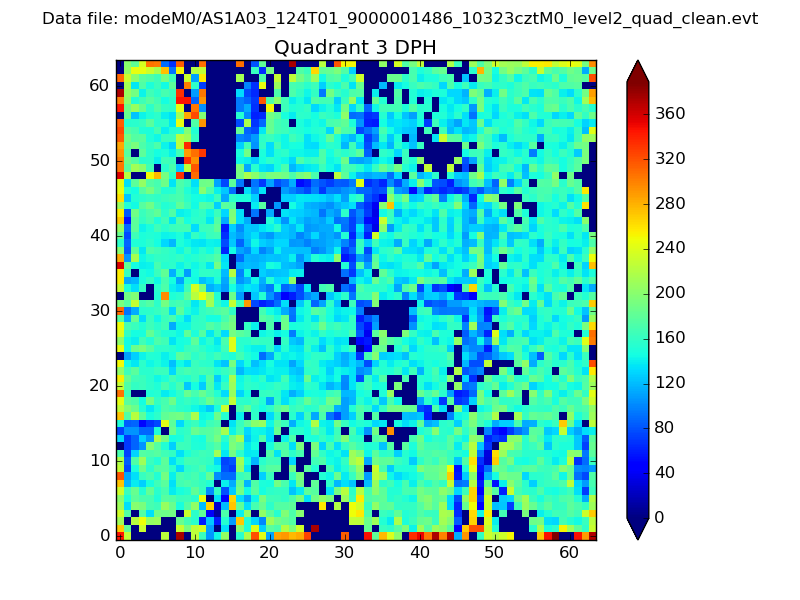 |
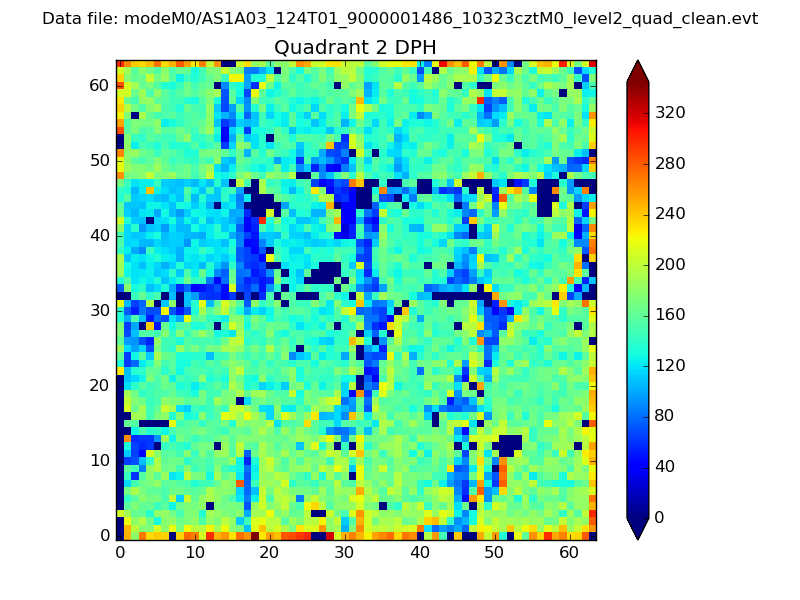 |
Quadrant C |
| Plot type | Count rate plots | Images |
|---|---|---|
| Comparison with Poisson distribution Blue bars denote a histogram of data divided into 1 sec bins. Red curve is a Poisson curve with rate = median count rate of data. |
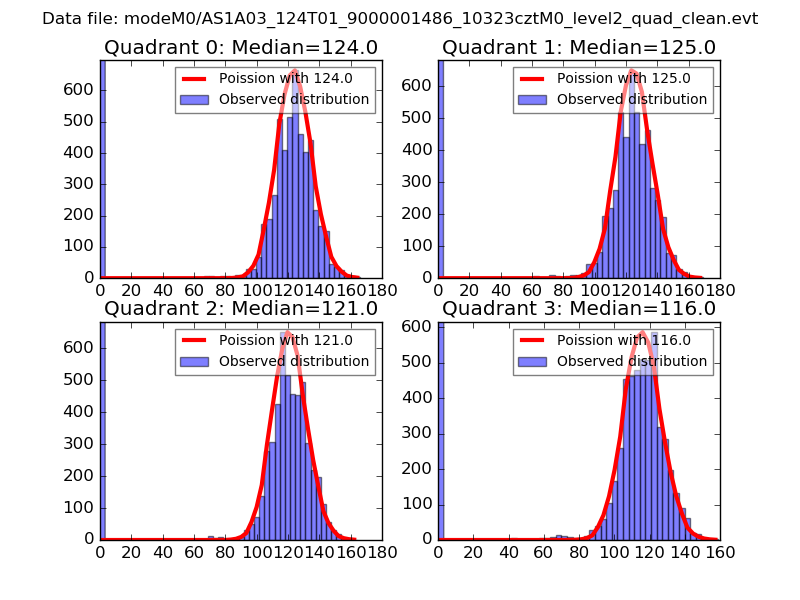 |
 |
| Quadrant-wise count rates Data is divided into 100 sec bins |
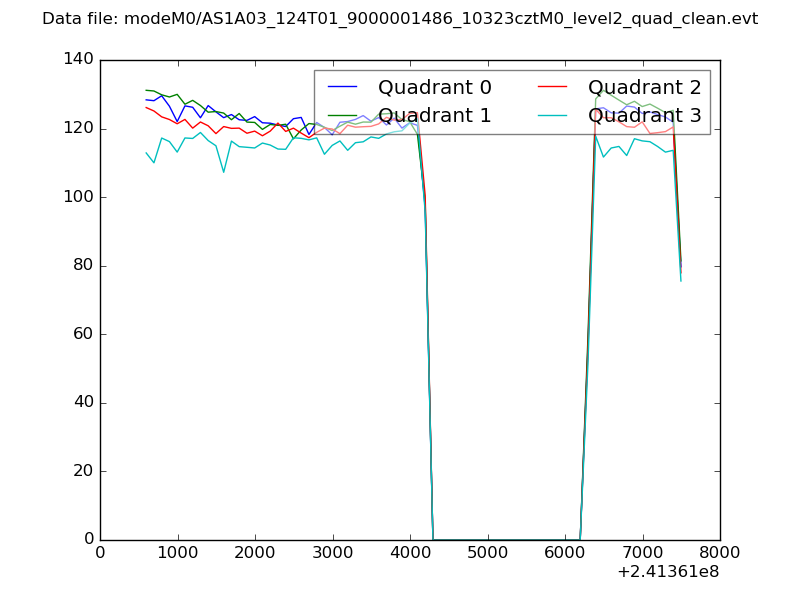 |
|
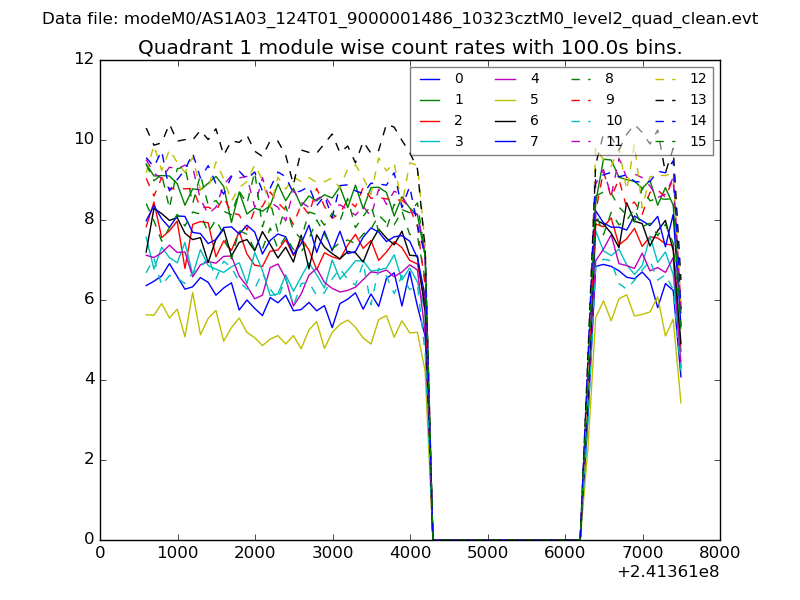
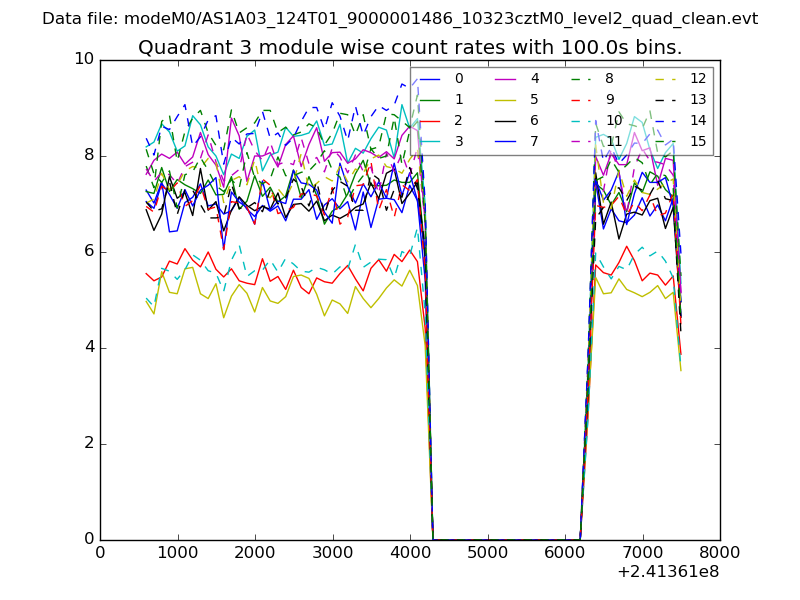
| Module-wise count rates for Quadrant A Data is divided into 100 sec bins |
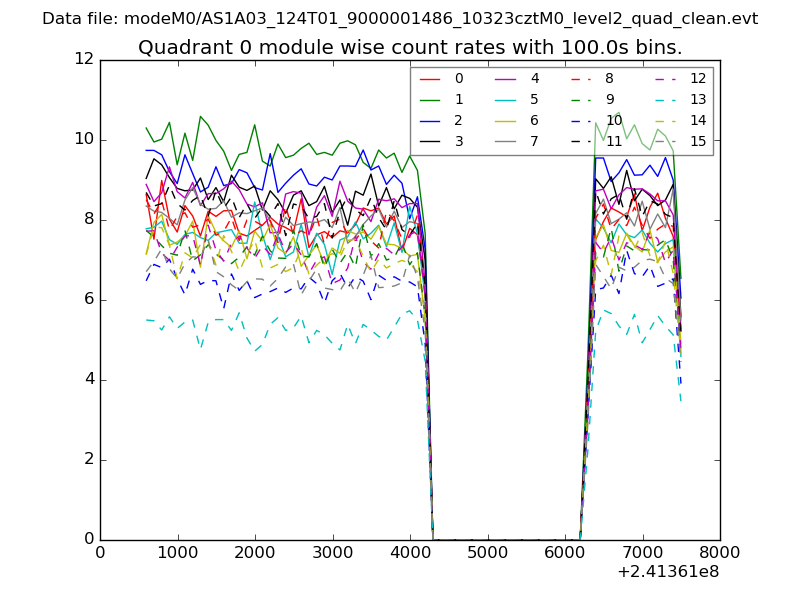 |
 |
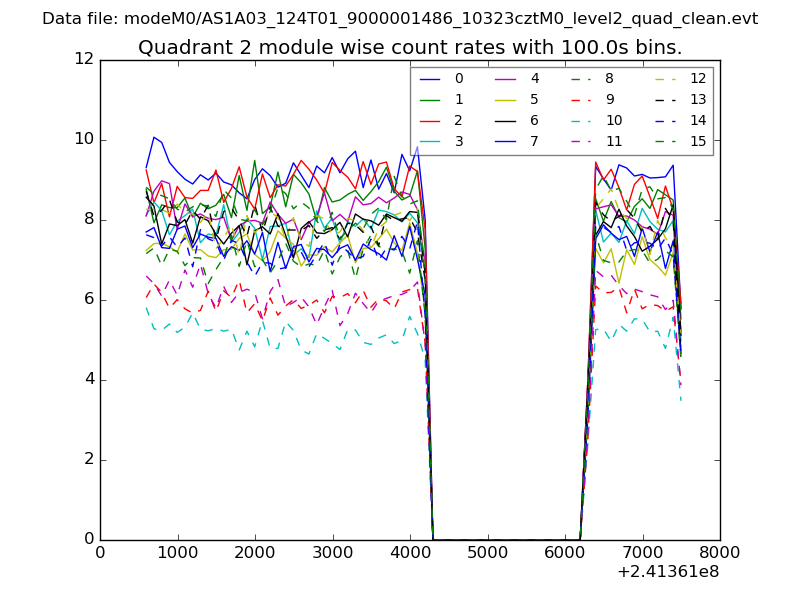
| Module-wise count rates for Quadrant B Data is divided into 100 sec bins |
 |
 |
| Module-wise count rates for Quadrant C Data is divided into 100 sec bins |
 |
 |
| Module-wise count rates for Quadrant D Data is divided into 100 sec bins |
 |
 |
| Parameter | Plot |
|---|---|
| CZT HV Monitor | 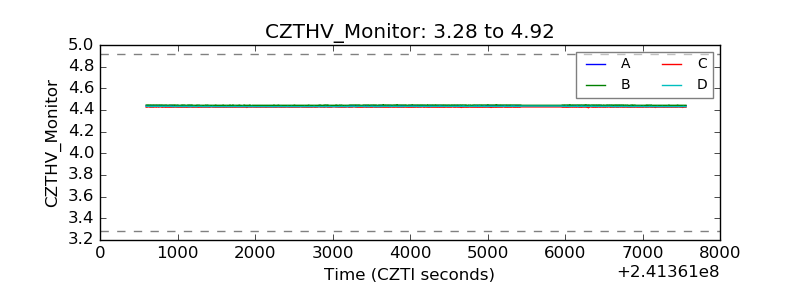 |
| D_VDD | 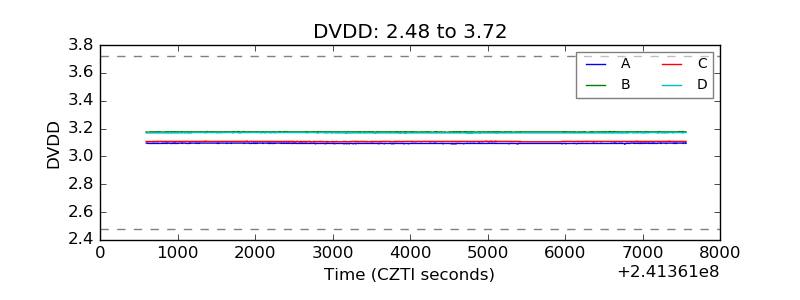 |
| Temperature 1 | 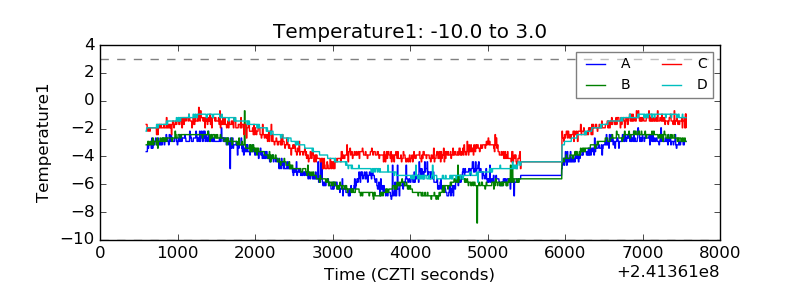 |
| Veto HV Monitor | 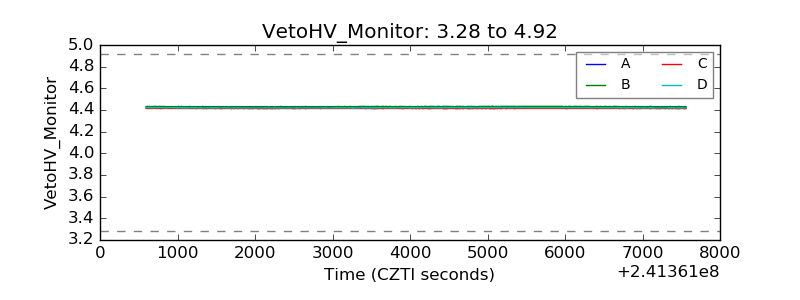 |
| Veto LLD | 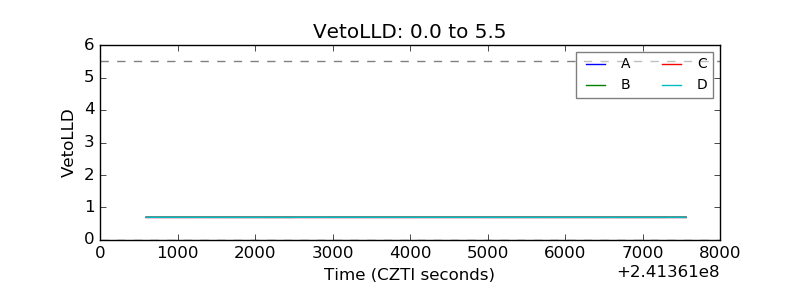 |
| Alpha Counter | 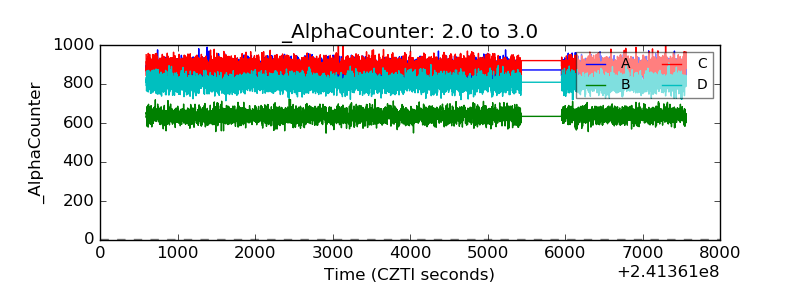 |
| _CPM_Rate | 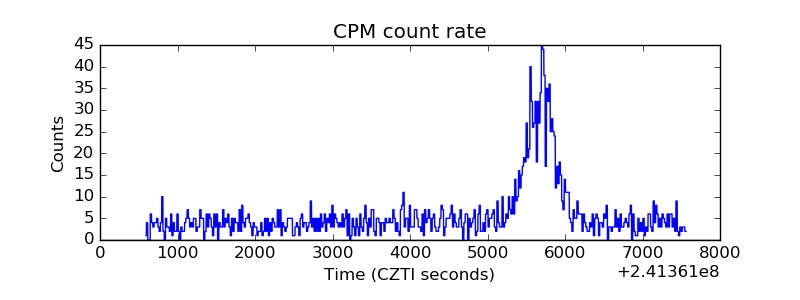 |
| CZT Counter | 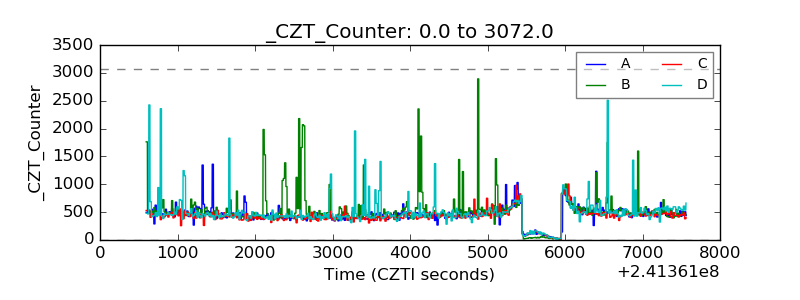 |
| +2.5 Volts monitor |  |
| +5 Volts monitor |  |
| _ROLL_ROT | 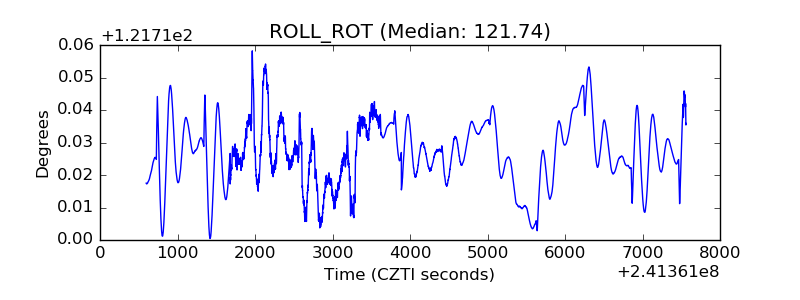 |
| _Roll_DEC | 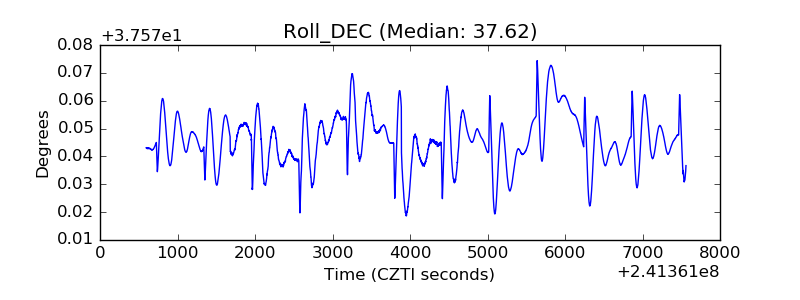 |
| _Roll_RA | 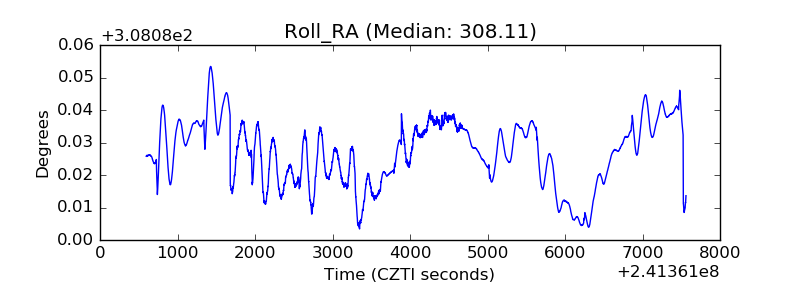 |
| Veto Counter | 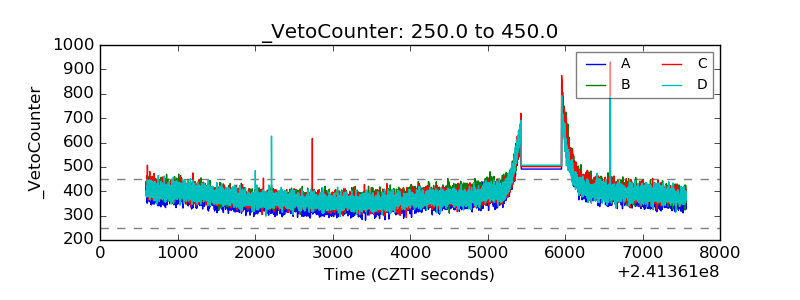 |