| Param | Original file | Final file |
|---|---|---|
| Filename | modeM0/AS1A03_124T01_9000001486_10324cztM0_level2.evt | modeM0/AS1A03_124T01_9000001486_10324cztM0_level2_quad_clean.evt |
| Size (bytes) | 121,662,720 | 33,992,640 |
| Size | 116.0 MB | 32.4 MB |
| Events in quadrant A | 844,613 | 225,834 |
| Events in quadrant B | 814,267 | 208,002 |
| Events in quadrant C | 818,916 | 223,758 |
| Events in quadrant D | 1,076,005 | 234,389 |
| Mode M0 | |||
|---|---|---|---|
| Quadrant | BADHDUFLAG | Total packets | Discarded packets |
| A | 0 | 7938 | 4189 |
| B | 0 | 9040 | 5599 |
| C | 0 | 8148 | 4381 |
| D | 0 | 8398 | 4101 |
| Mode SS | |||
|---|---|---|---|
| Quadrant | BADHDUFLAG | Total packets | Discarded packets |
| A | 0 | 80 | 38 |
| B | 0 | 80 | 40 |
| C | 0 | 80 | 39 |
| D | 0 | 78 | 36 |
| Quadrant | Total seconds | Saturated seconds | Saturation percentage |
|---|---|---|---|
| A | 1857 | 3 | 0.161551% |
| B | 1680 | 0 | 0.000000% |
| C | 1883 | 1 | 0.053107% |
| D | 2064 | 12 | 0.581395% |
Noise dominated data is calculated using 1-second bins in cleaned event files. If a bin has >2000 counts, and if more than 50% of those come from <1% of pixels, then it is considered to be noise-dominated and hence unusable.
| Quadrant | # 1 sec bins | Bins with >0 counts | Bins with >2000 counts | High rate bins dominated by noise | Noise dominated (total time) | Noise dominated (detector-on time) | Marked lightcurve |
|---|---|---|---|---|---|---|---|
| A | 2204 | 2139 | 1 | 1 | 0.05% | 0.05% | 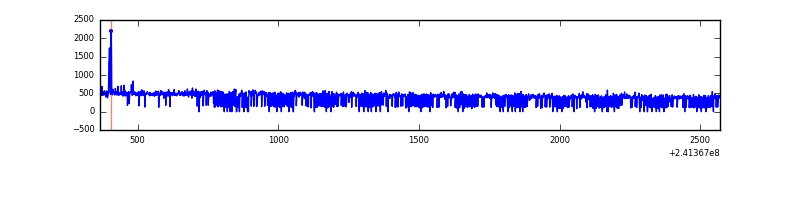 |
| B | 2203 | 1989 | 0 | 0 | 0.00% | 0.00% | 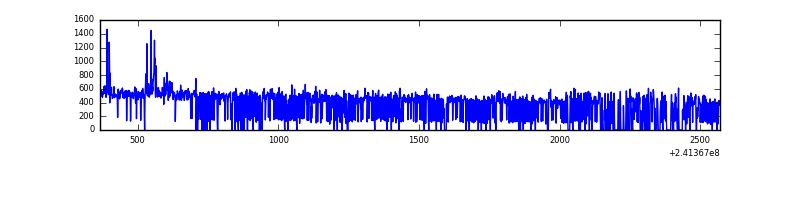 |
| C | 2204 | 2149 | 0 | 0 | 0.00% | 0.00% | 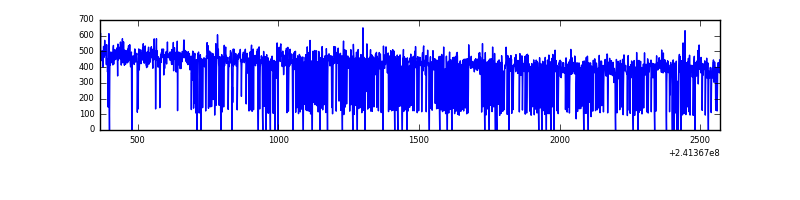 |
| D | 2204 | 2159 | 8 | 8 | 0.36% | 0.37% | 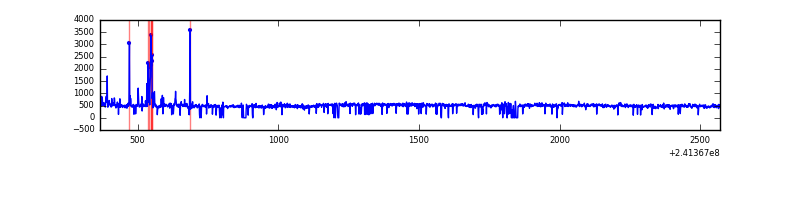 |
Top three noisy pixels from each quadrant. If the there are fewer than three noisy pixels in the level2.evt file, extra rows are filled as -1
| Pixel properties | Quadrant properties | ||||||
|---|---|---|---|---|---|---|---|
| Quadrant | DetID | PixID | Counts | Sigma | Mean | Median | Sigma |
| A | 8 | 5 | 17204 | 373.84 | 212 | 206 | 45.5 |
| A | 3 | 1 | 6587 | 140.34 | 212 | 206 | 45.5 |
| A | 8 | 15 | 4114 | 85.95 | 212 | 206 | 45.5 |
| B | 4 | 239 | 34402 | 881.29 | 192 | 188 | 38.8 |
| B | 11 | 51 | 10346 | 261.65 | 192 | 188 | 38.8 |
| B | 0 | 214 | 9574 | 241.77 | 192 | 188 | 38.8 |
| C | 4 | 254 | 1930 | 34.47 | 209 | 209 | 49.9 |
| C | 13 | 61 | 1617 | 28.2 | 209 | 209 | 49.9 |
| C | 12 | 4 | 1330 | 22.45 | 209 | 209 | 49.9 |
| D | 8 | 195 | 134486 | 2381.81 | 229 | 223 | 56.4 |
| D | 1 | 52 | 40323 | 711.37 | 229 | 223 | 56.4 |
| D | 13 | 104 | 14697 | 256.77 | 229 | 223 | 56.4 |
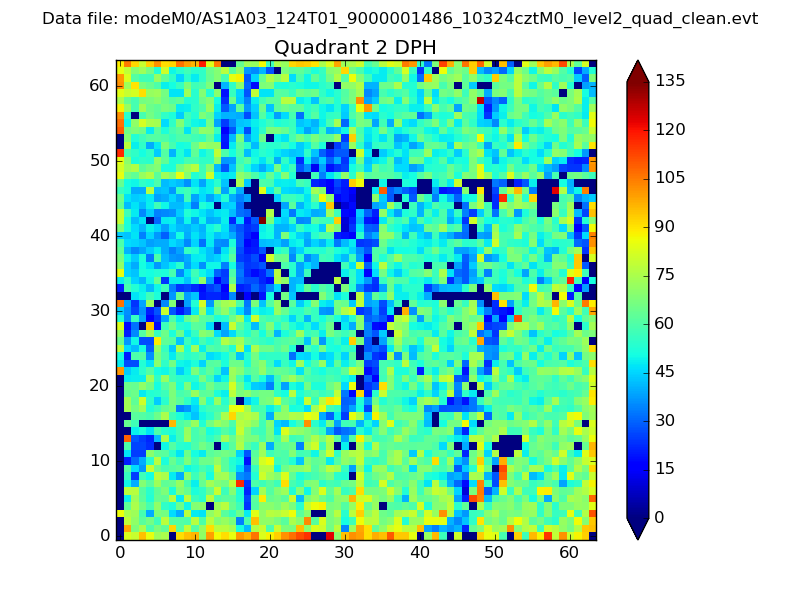
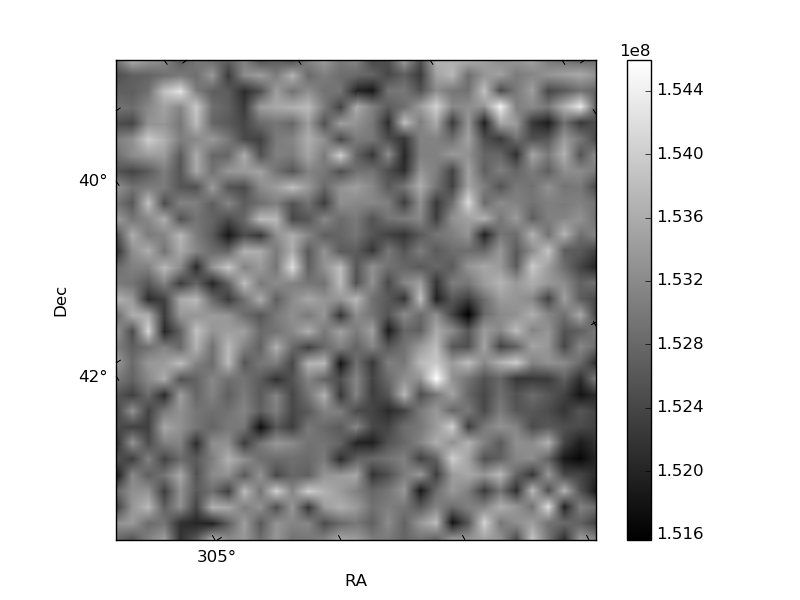
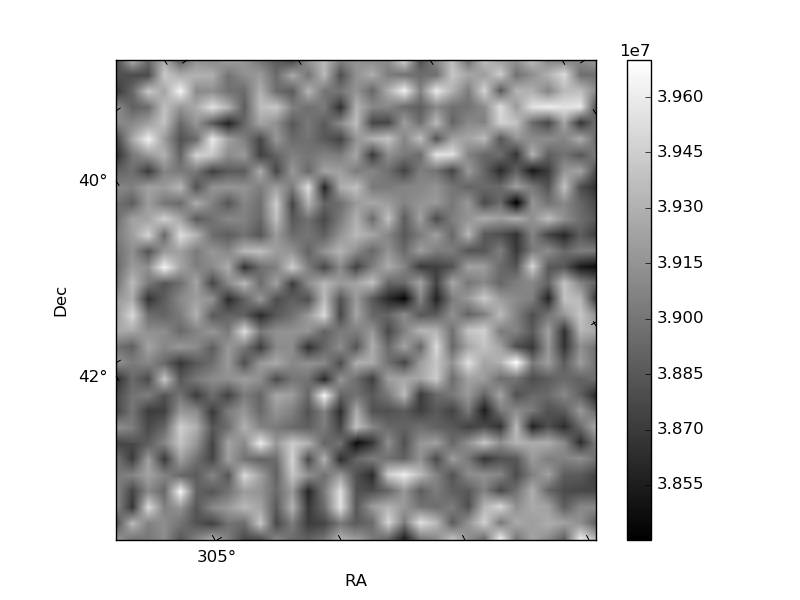
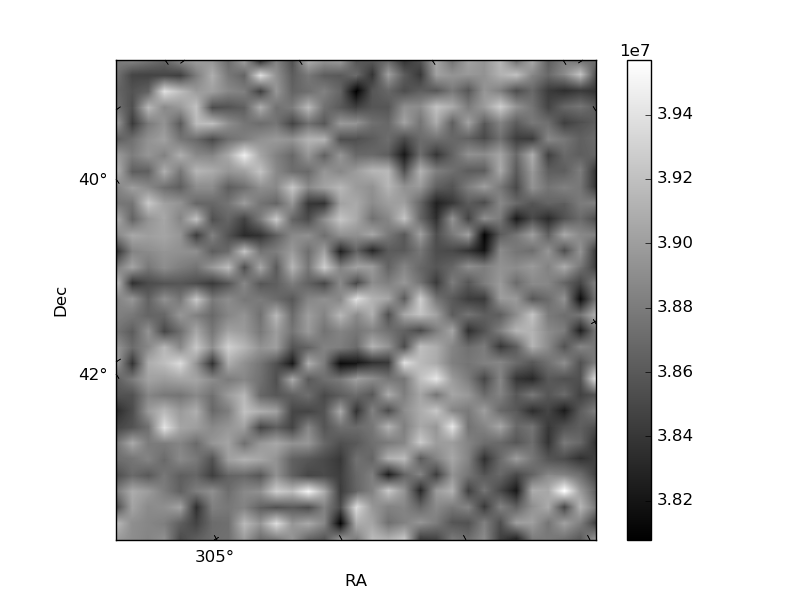
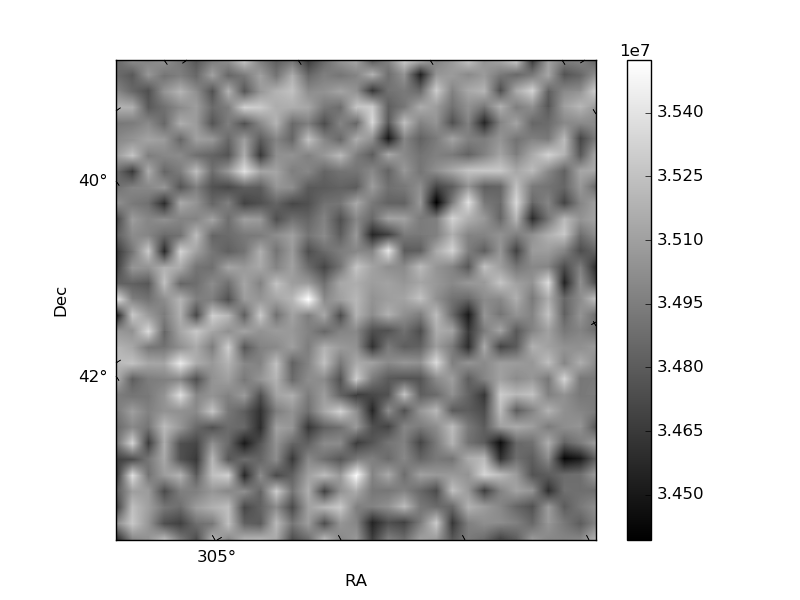
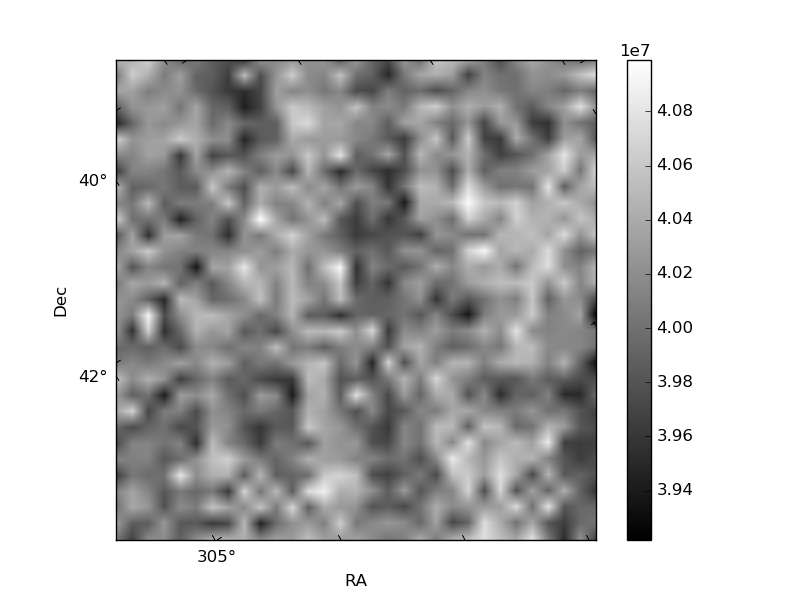
Histogram calculated using DETX and DETY for each event in the final _common_clean file
| Quadrant A | 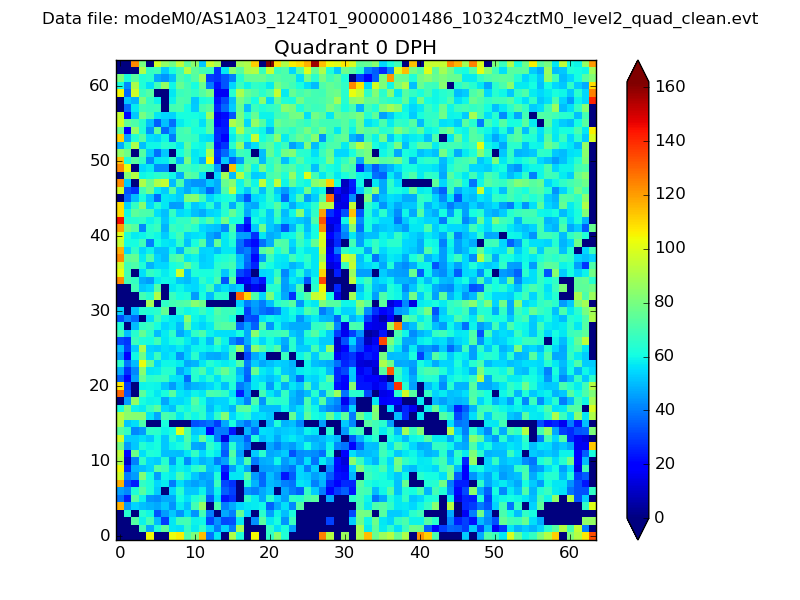 |
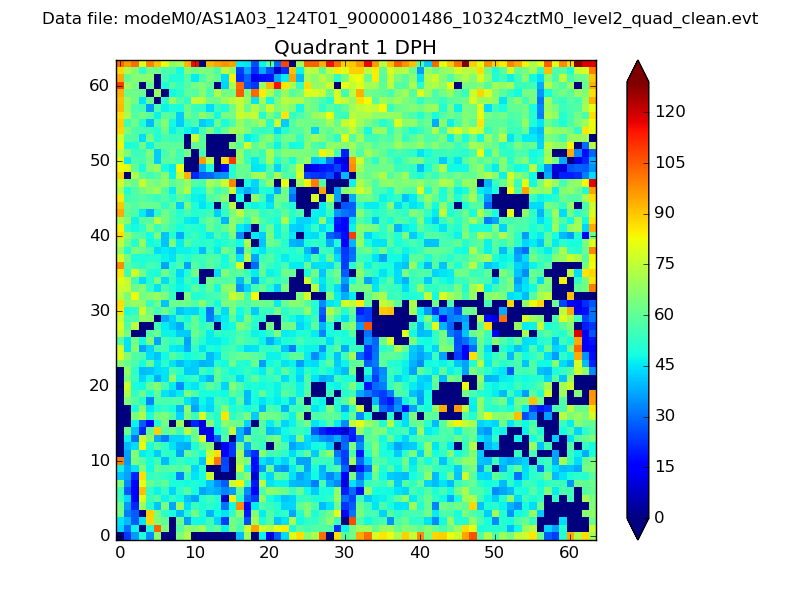 |
Quadrant B |
|---|---|---|---|
| Quadrant D | 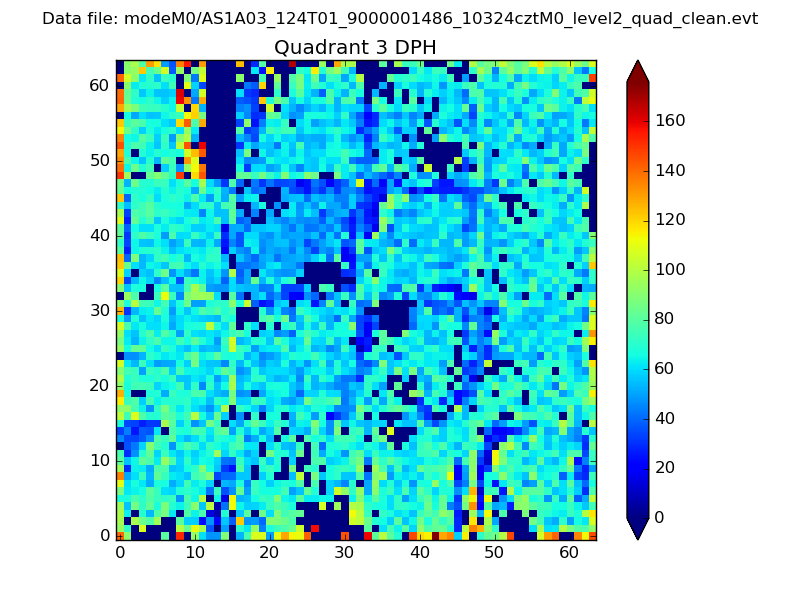 |
 |
Quadrant C |
| Plot type | Count rate plots | Images |
|---|---|---|
| Comparison with Poisson distribution Blue bars denote a histogram of data divided into 1 sec bins. Red curve is a Poisson curve with rate = median count rate of data. |
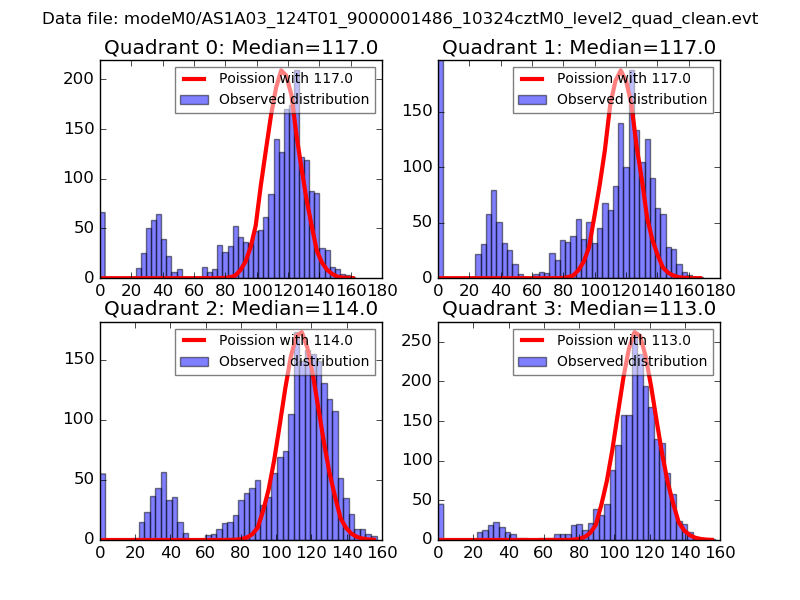 |
 |
| Quadrant-wise count rates Data is divided into 100 sec bins |
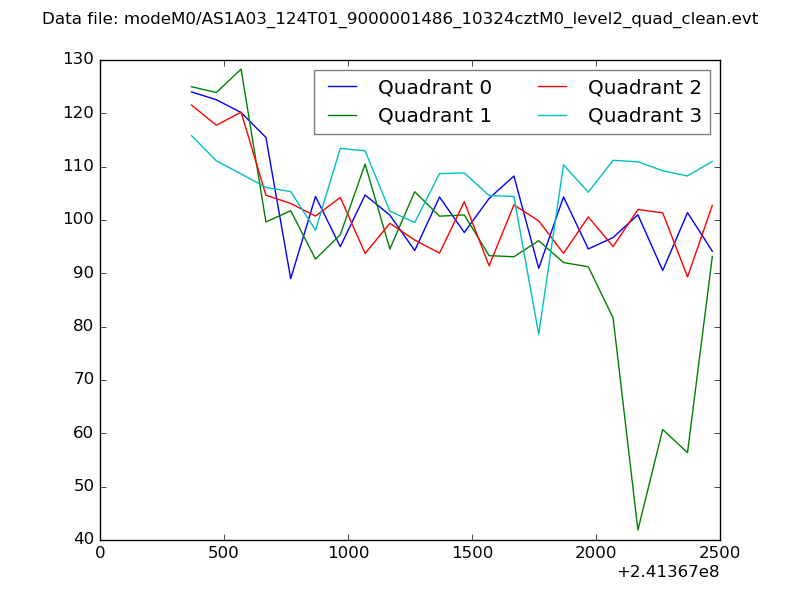 |
|
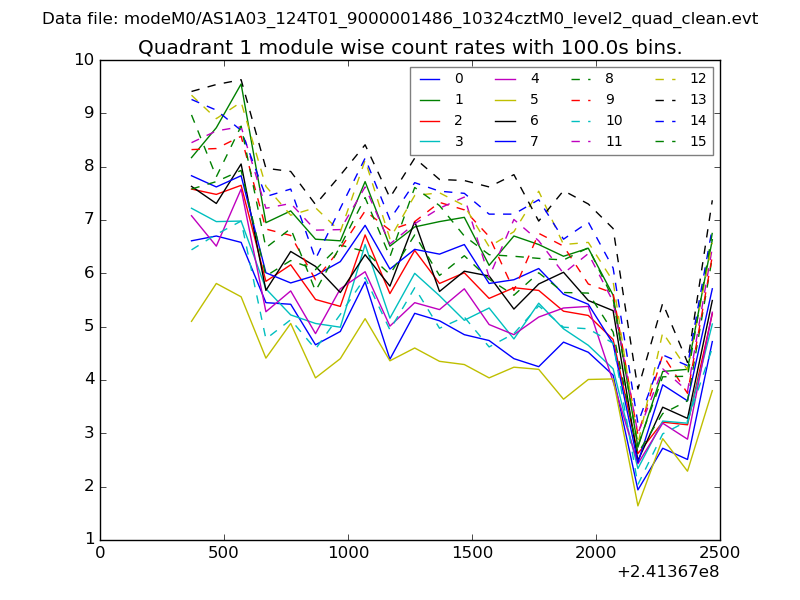
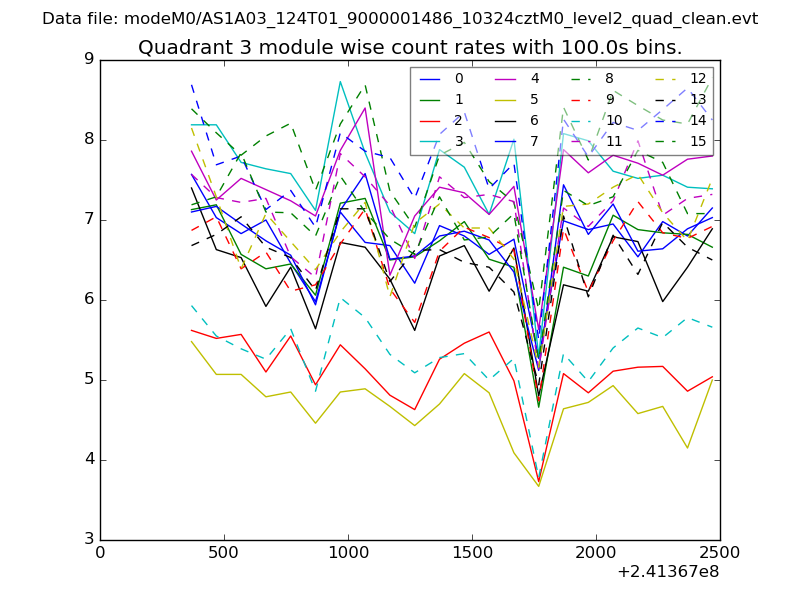
| Module-wise count rates for Quadrant A Data is divided into 100 sec bins |
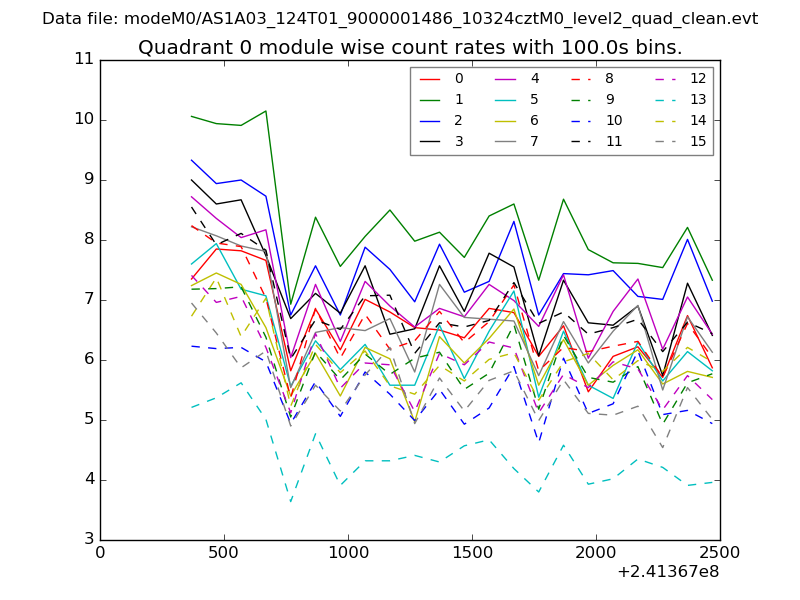 |
 |
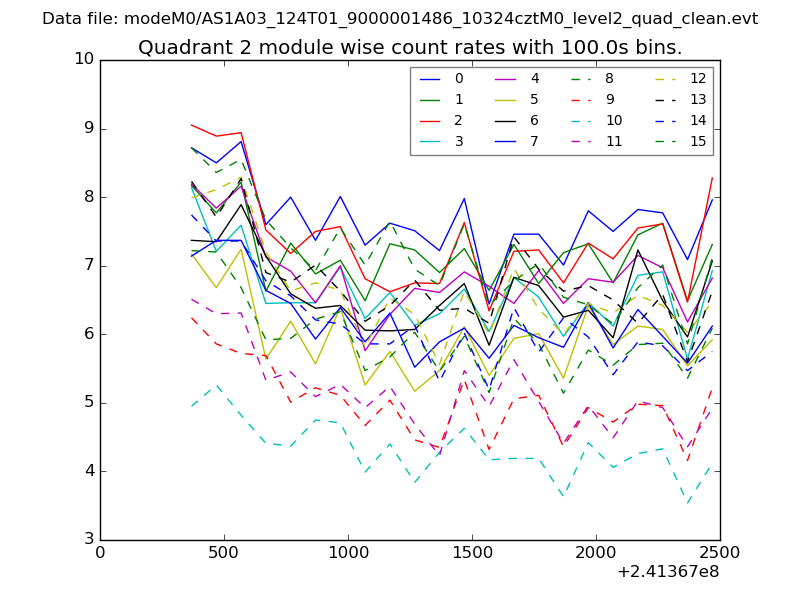
| Module-wise count rates for Quadrant B Data is divided into 100 sec bins |
 |
 |
| Module-wise count rates for Quadrant C Data is divided into 100 sec bins |
 |
 |
| Module-wise count rates for Quadrant D Data is divided into 100 sec bins |
 |
 |
| Parameter | Plot |
|---|---|
| CZT HV Monitor | 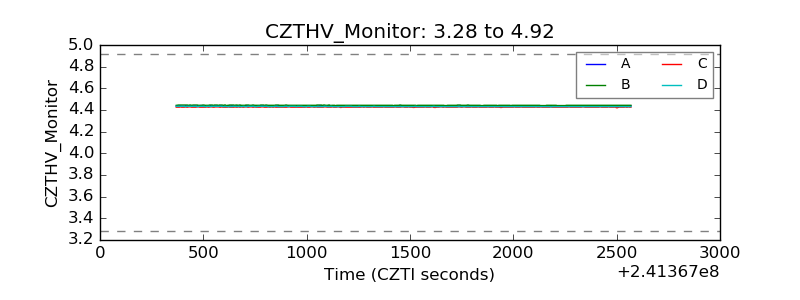 |
| D_VDD | 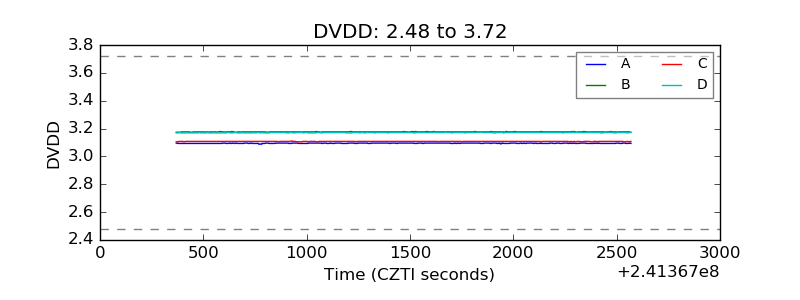 |
| Temperature 1 | 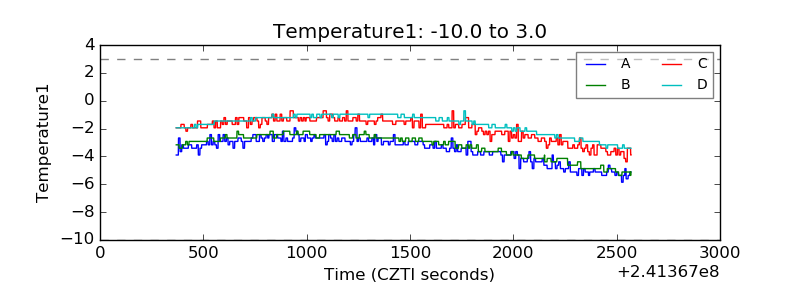 |
| Veto HV Monitor | 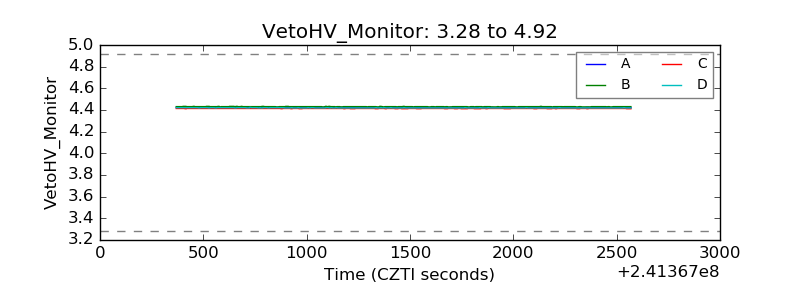 |
| Veto LLD | 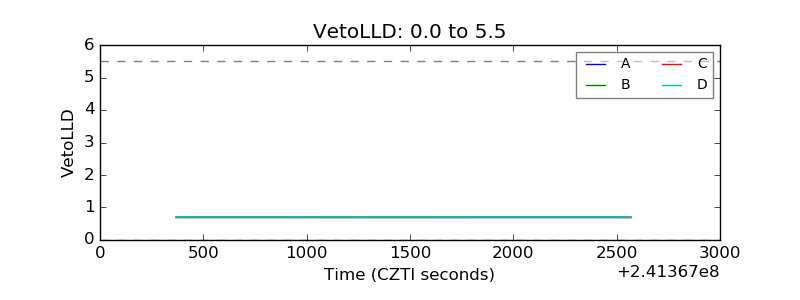 |
| Alpha Counter | 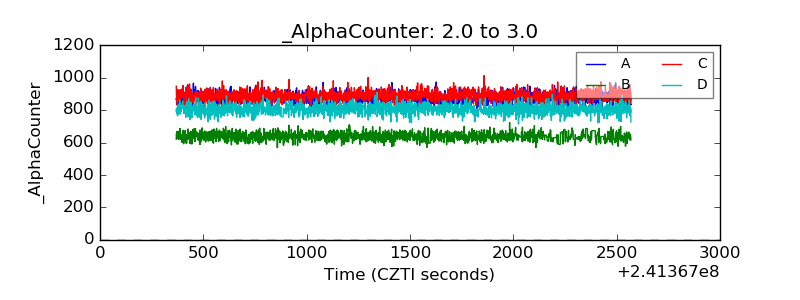 |
| _CPM_Rate | 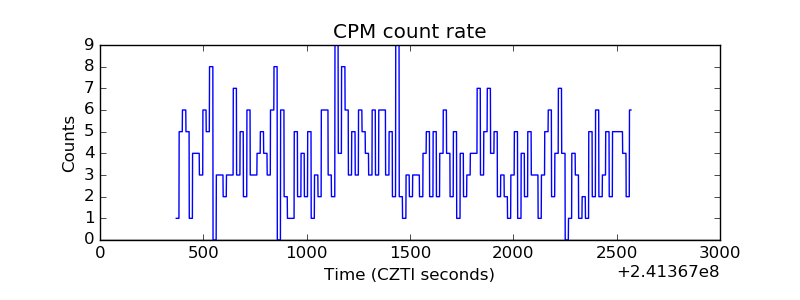 |
| CZT Counter | 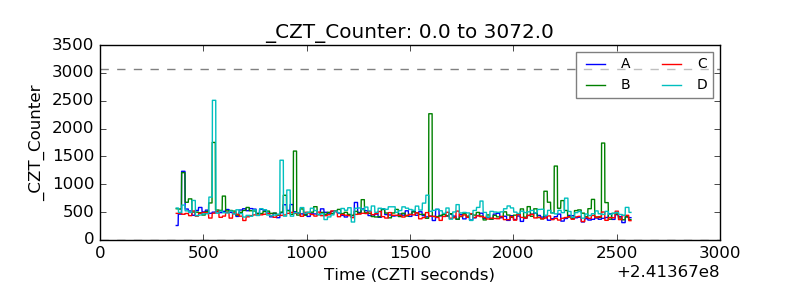 |
| +2.5 Volts monitor |  |
| +5 Volts monitor | 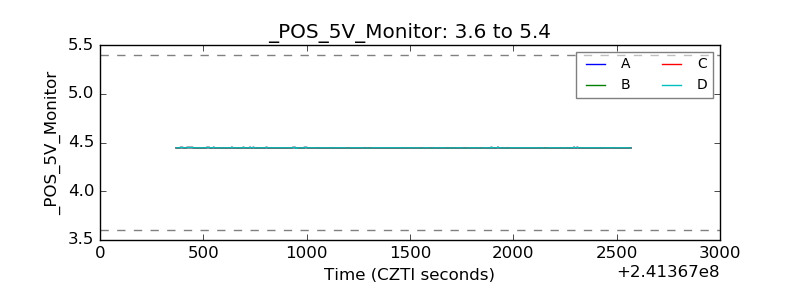 |
| _ROLL_ROT | 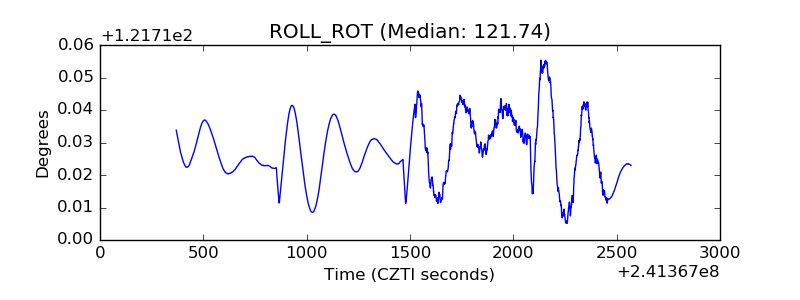 |
| _Roll_DEC | 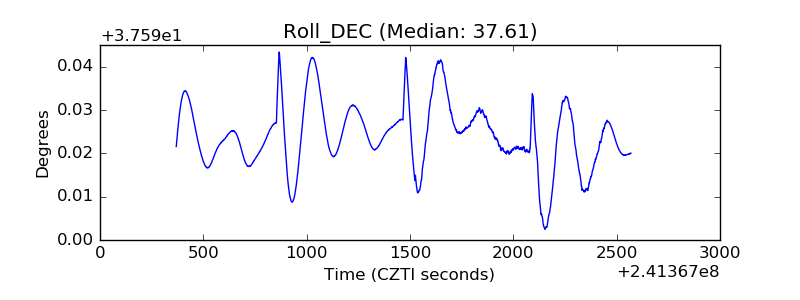 |
| _Roll_RA | 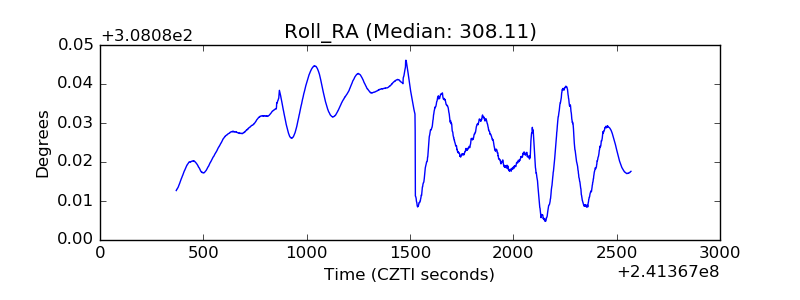 |
| Veto Counter | 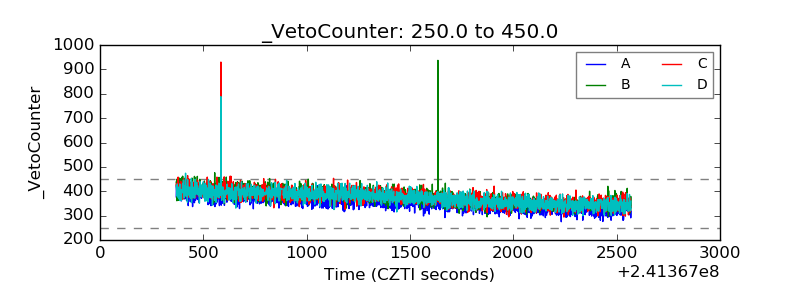 |