| Param | Original file | Final file |
|---|---|---|
| Filename | modeM0/AS1A03_112T01_9000001488_10324cztM0_level2.evt | modeM0/AS1A03_112T01_9000001488_10324cztM0_level2_quad_clean.evt |
| Size (bytes) | 192,784,320 | 34,329,600 |
| Size | 183.9 MB | 32.7 MB |
| Events in quadrant A | 1,329,159 | 212,010 |
| Events in quadrant B | 1,296,668 | 216,135 |
| Events in quadrant C | 1,309,459 | 212,803 |
| Events in quadrant D | 1,710,374 | 198,155 |
| Mode M9 | |||
|---|---|---|---|
| Quadrant | BADHDUFLAG | Total packets | Discarded packets |
| A | 0 | 6 | 3 |
| B | 0 | 6 | 3 |
| C | 0 | 6 | 3 |
| D | 0 | 6 | 3 |
| Mode SS | |||
|---|---|---|---|
| Quadrant | BADHDUFLAG | Total packets | Discarded packets |
| A | 0 | 98 | 37 |
| B | 0 | 98 | 38 |
| C | 0 | 98 | 33 |
| D | 0 | 96 | 32 |
| Mode M0 | |||
|---|---|---|---|
| Quadrant | BADHDUFLAG | Total packets | Discarded packets |
| A | 0 | 10236 | 4524 |
| B | 0 | 11039 | 5571 |
| C | 0 | 10469 | 4728 |
| D | 0 | 12334 | 5571 |
| Quadrant | Total seconds | Saturated seconds | Saturation percentage |
|---|---|---|---|
| A | 2818 | 2 | 0.070972% |
| B | 2665 | 7 | 0.262664% |
| C | 2838 | 2 | 0.070472% |
| D | 2847 | 88 | 3.090973% |
Noise dominated data is calculated using 1-second bins in cleaned event files. If a bin has >2000 counts, and if more than 50% of those come from <1% of pixels, then it is considered to be noise-dominated and hence unusable.
| Quadrant | # 1 sec bins | Bins with >0 counts | Bins with >2000 counts | High rate bins dominated by noise | Noise dominated (total time) | Noise dominated (detector-on time) | Marked lightcurve |
|---|---|---|---|---|---|---|---|
| A | 3554 | 3026 | 0 | 0 | 0.00% | 0.00% | 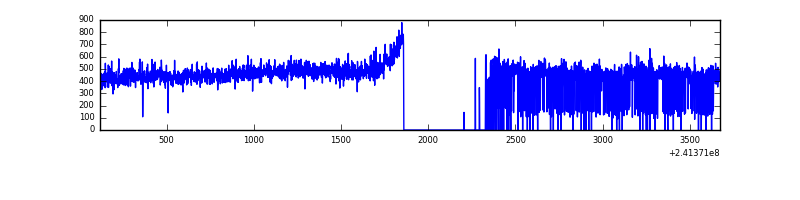 |
| B | 3554 | 2918 | 0 | 0 | 0.00% | 0.00% | 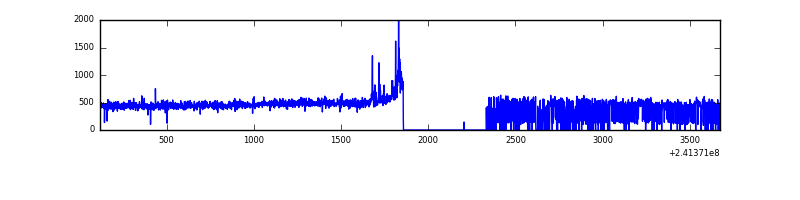 |
| C | 3554 | 3033 | 0 | 0 | 0.00% | 0.00% | 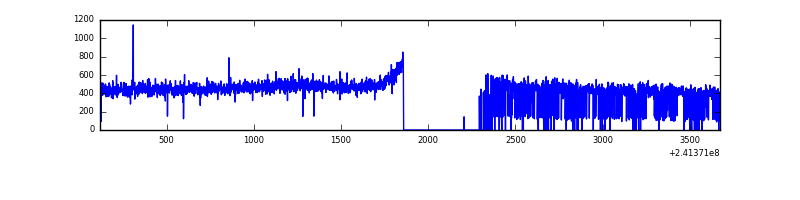 |
| D | 3554 | 2967 | 84 | 84 | 2.36% | 2.83% | 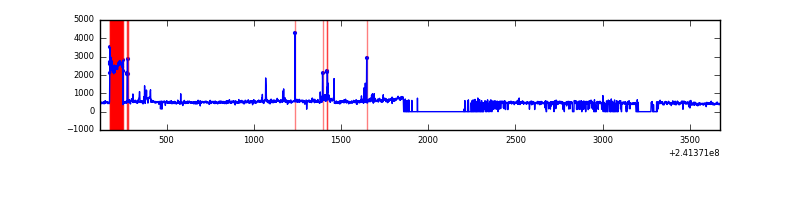 |
Top three noisy pixels from each quadrant. If the there are fewer than three noisy pixels in the level2.evt file, extra rows are filled as -1
| Pixel properties | Quadrant properties | ||||||
|---|---|---|---|---|---|---|---|
| Quadrant | DetID | PixID | Counts | Sigma | Mean | Median | Sigma |
| A | 8 | 15 | 14172 | 195.0 | 339 | 331 | 71.0 |
| A | 8 | 5 | 6258 | 83.5 | 339 | 331 | 71.0 |
| A | 3 | 1 | 3529 | 45.06 | 339 | 331 | 71.0 |
| B | 4 | 239 | 26404 | 417.14 | 318 | 309 | 62.6 |
| B | 11 | 51 | 17500 | 274.8 | 318 | 309 | 62.6 |
| B | 0 | 214 | 14971 | 234.38 | 318 | 309 | 62.6 |
| C | 13 | 61 | 2553 | 28.47 | 334 | 335 | 77.9 |
| C | 14 | 234 | 2474 | 27.45 | 334 | 335 | 77.9 |
| C | 8 | 128 | 2323 | 25.51 | 334 | 335 | 77.9 |
| D | 2 | 14 | 228608 | 2833.96 | 332 | 321 | 80.6 |
| D | 8 | 195 | 157477 | 1950.94 | 332 | 321 | 80.6 |
| D | 2 | 33 | 29135 | 357.7 | 332 | 321 | 80.6 |
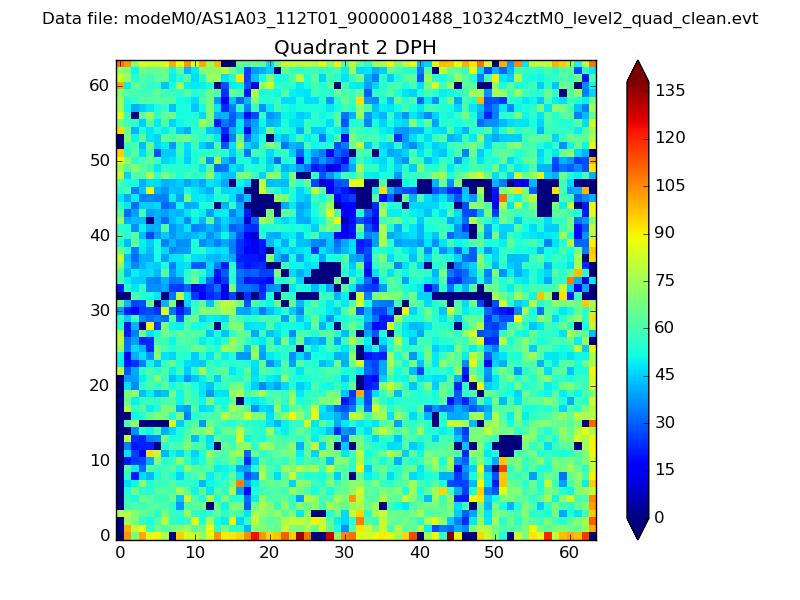
Histogram calculated using DETX and DETY for each event in the final _common_clean file
| Quadrant A | 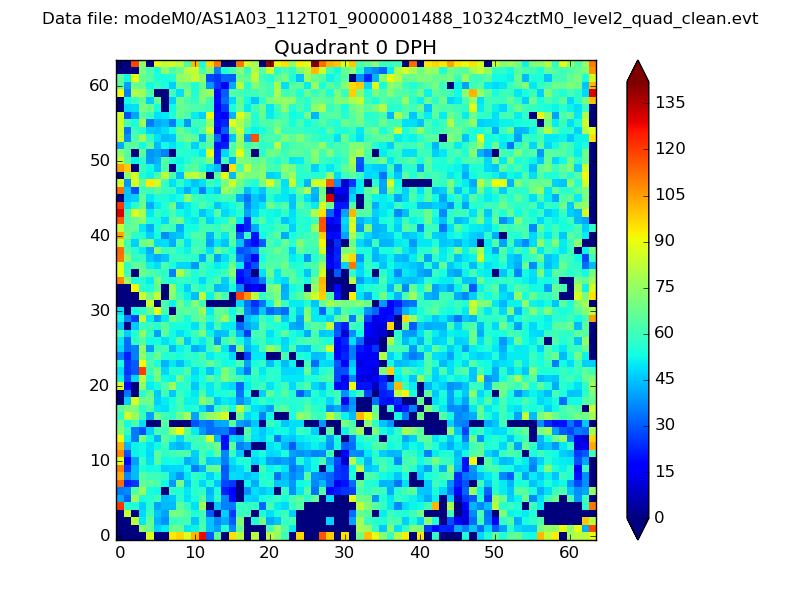 |
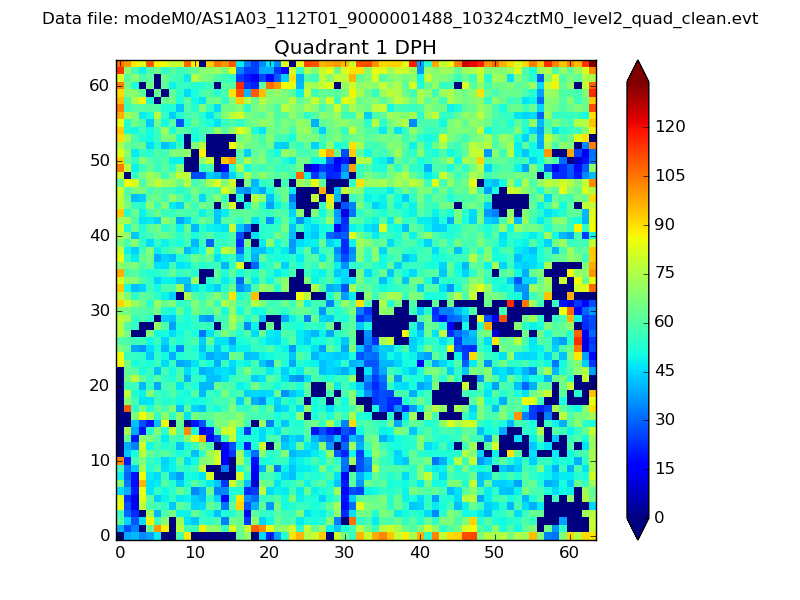 |
Quadrant B |
|---|---|---|---|
| Quadrant D | 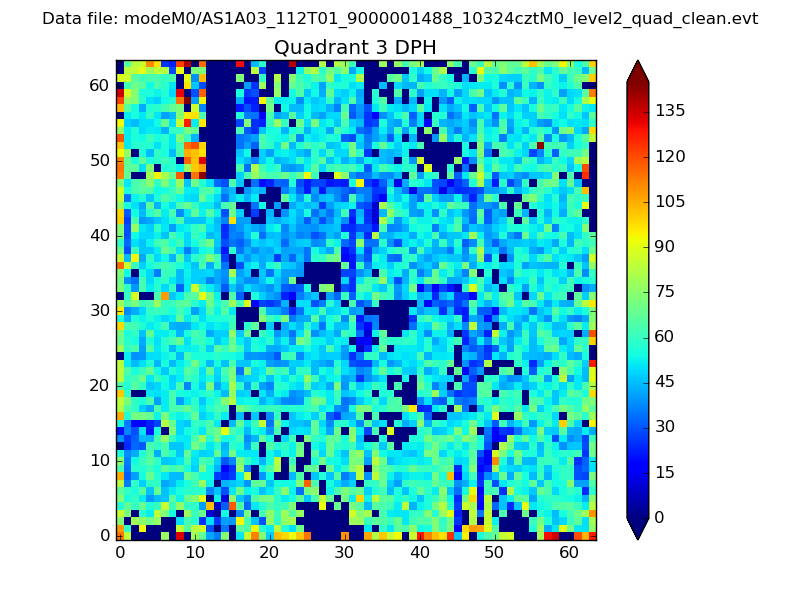 |
 |
Quadrant C |
| Plot type | Count rate plots | Images |
|---|---|---|
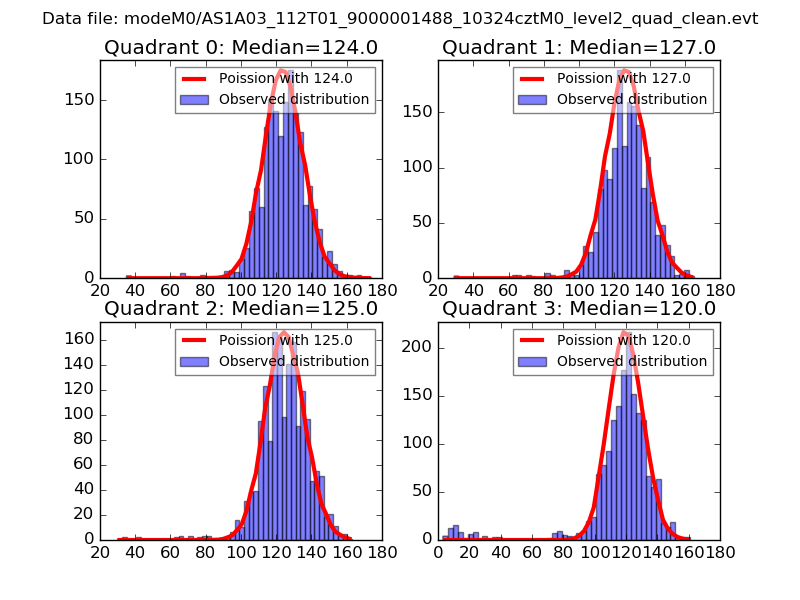
| Comparison with Poisson distribution Blue bars denote a histogram of data divided into 1 sec bins. Red curve is a Poisson curve with rate = median count rate of data. |
 |
 |
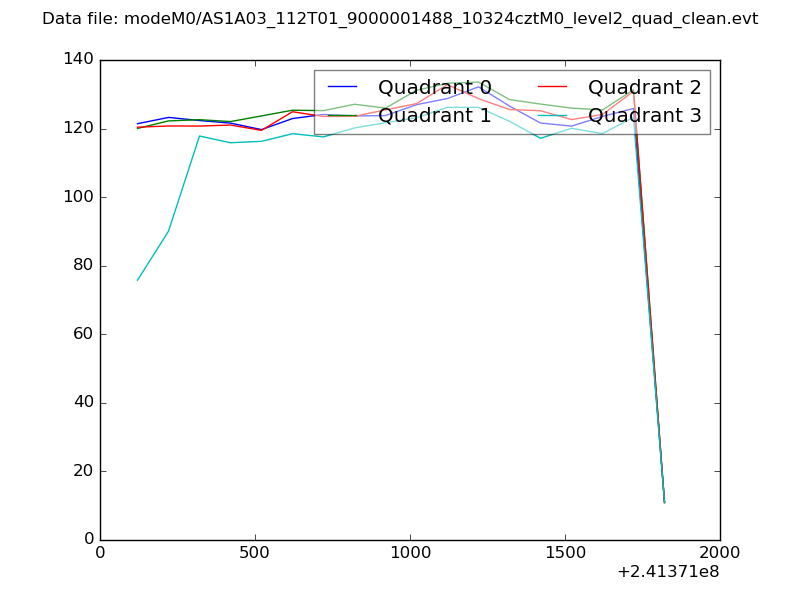
| Quadrant-wise count rates Data is divided into 100 sec bins |
 |
|
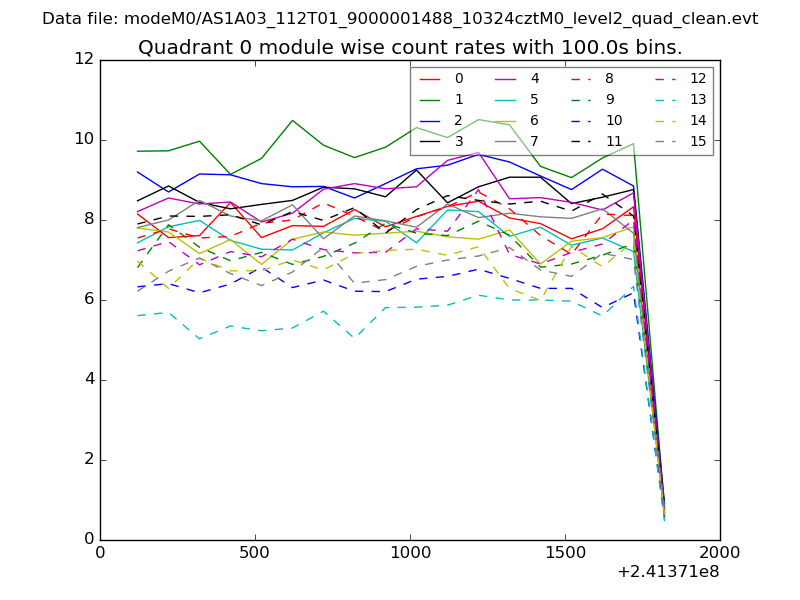
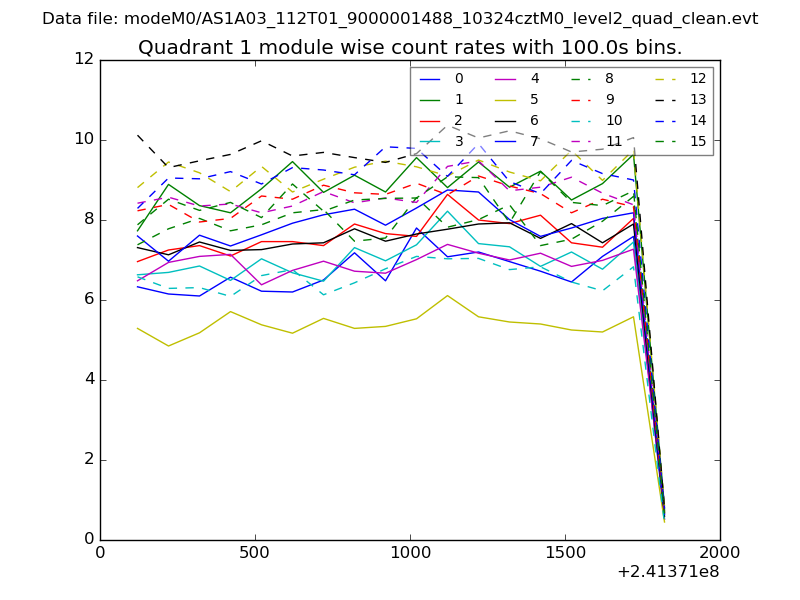
| Module-wise count rates for Quadrant A Data is divided into 100 sec bins |
 |
 |
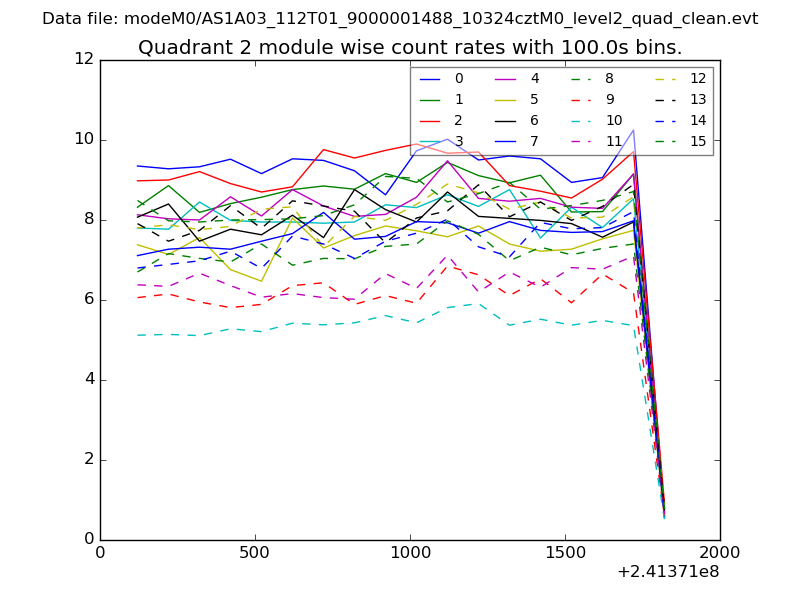
| Module-wise count rates for Quadrant B Data is divided into 100 sec bins |
 |
 |
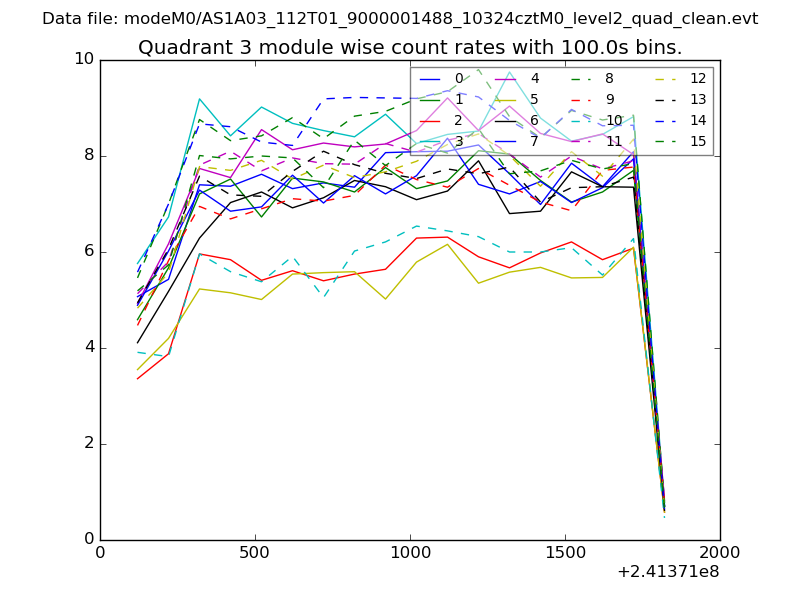
| Module-wise count rates for Quadrant C Data is divided into 100 sec bins |
 |
 |
| Module-wise count rates for Quadrant D Data is divided into 100 sec bins |
 |
 |
| Parameter | Plot |
|---|---|
| CZT HV Monitor | 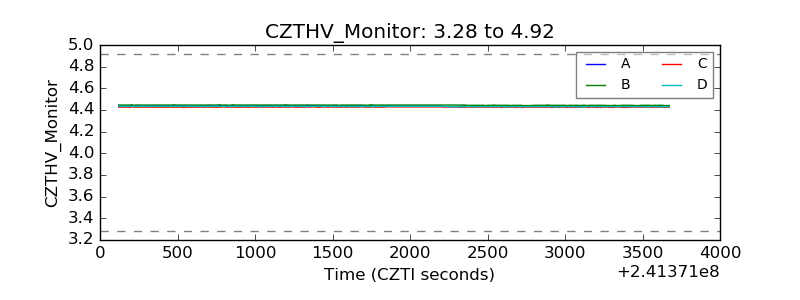 |
| D_VDD | 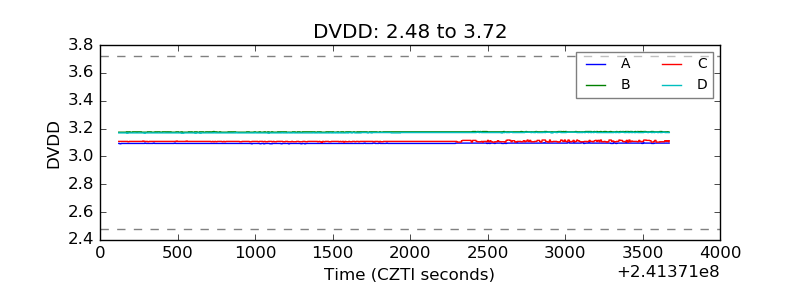 |
| Temperature 1 | 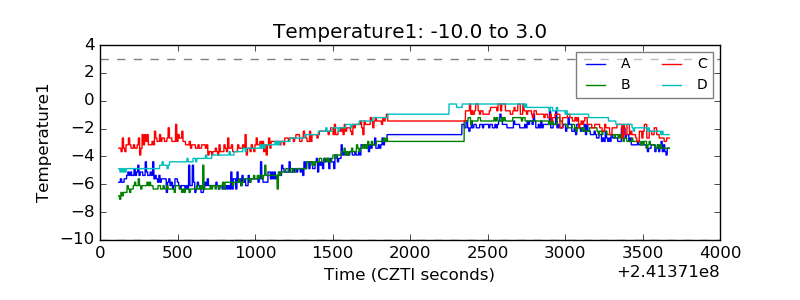 |
| Veto HV Monitor | 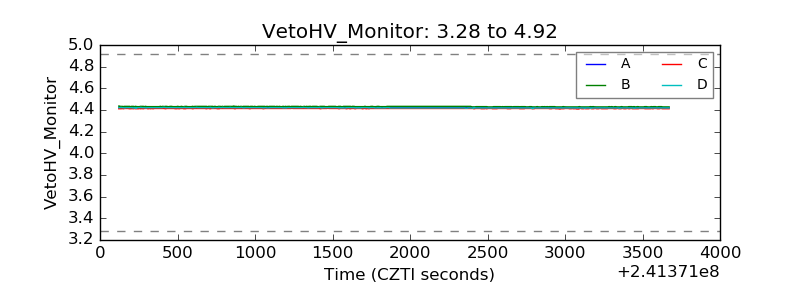 |
| Veto LLD |  |
| Alpha Counter | 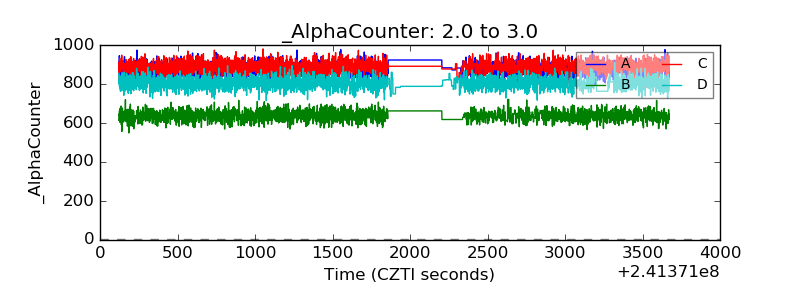 |
| _CPM_Rate | 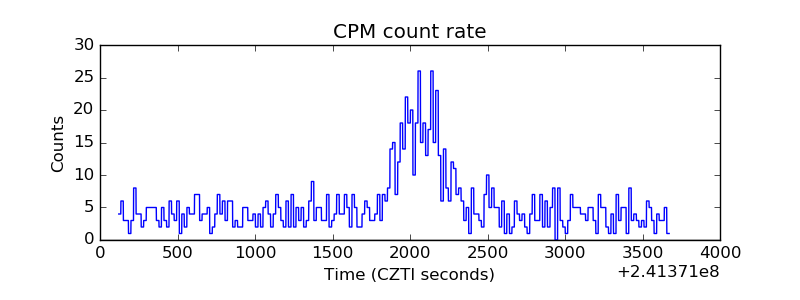 |
| CZT Counter | 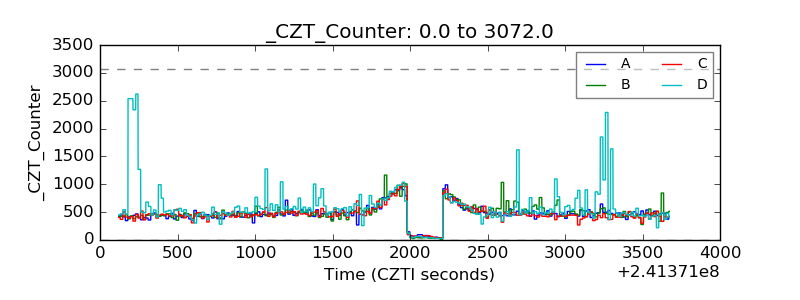 |
| +2.5 Volts monitor |  |
| +5 Volts monitor | 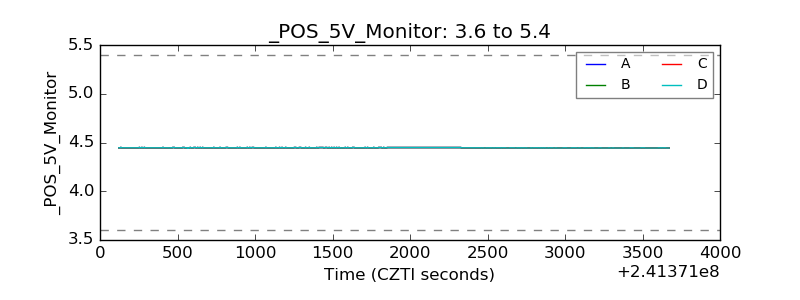 |
| _ROLL_ROT | 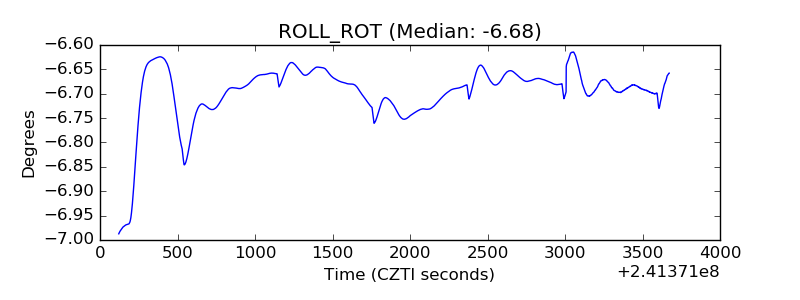 |
| _Roll_DEC | 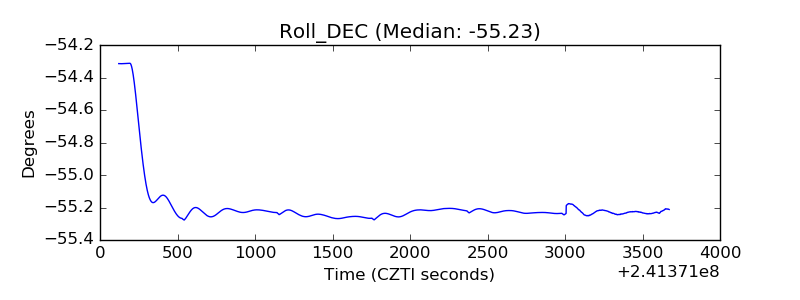 |
| _Roll_RA | 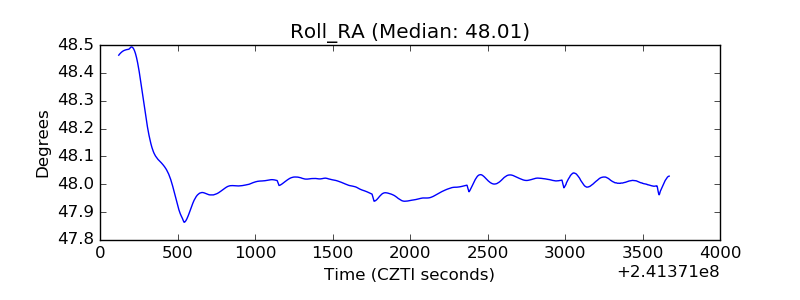 |
| Veto Counter | 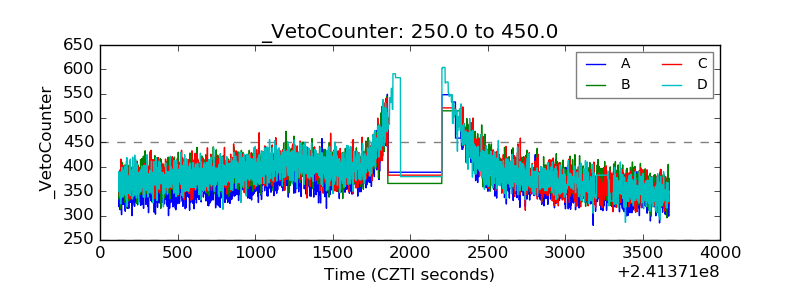 |