| Param | Original file | Final file |
|---|---|---|
| Filename | modeM0/AS1A03_112T01_9000001488_10329cztM0_level2.evt | modeM0/AS1A03_112T01_9000001488_10329cztM0_level2_quad_clean.evt |
| Size (bytes) | 652,461,120 | 118,416,960 |
| Size | 622.2 MB | 112.9 MB |
| Events in quadrant A | 4,753,783 | 718,863 |
| Events in quadrant B | 4,479,581 | 717,115 |
| Events in quadrant C | 4,121,363 | 752,730 |
| Events in quadrant D | 5,774,968 | 754,687 |
| Mode M9 | |||
|---|---|---|---|
| Quadrant | BADHDUFLAG | Total packets | Discarded packets |
| A | 0 | 11 | 6 |
| B | 0 | 12 | 6 |
| C | 0 | 12 | 6 |
| D | 0 | 12 | 6 |
| Mode SS | |||
|---|---|---|---|
| Quadrant | BADHDUFLAG | Total packets | Discarded packets |
| A | 0 | 464 | 243 |
| B | 0 | 464 | 257 |
| C | 0 | 464 | 260 |
| D | 0 | 449 | 230 |
| Mode M0 | |||
|---|---|---|---|
| Quadrant | BADHDUFLAG | Total packets | Discarded packets |
| A | 0 | 53053 | 33466 |
| B | 0 | 52875 | 33586 |
| C | 0 | 46194 | 27063 |
| D | 0 | 60138 | 36818 |
| Quadrant | Total seconds | Saturated seconds | Saturation percentage |
|---|---|---|---|
| A | 8681 | 89 | 1.025228% |
| B | 8840 | 55 | 0.622172% |
| C | 9495 | 12 | 0.126382% |
| D | 9813 | 119 | 1.212677% |
Noise dominated data is calculated using 1-second bins in cleaned event files. If a bin has >2000 counts, and if more than 50% of those come from <1% of pixels, then it is considered to be noise-dominated and hence unusable.
| Quadrant | # 1 sec bins | Bins with >0 counts | Bins with >2000 counts | High rate bins dominated by noise | Noise dominated (total time) | Noise dominated (detector-on time) | Marked lightcurve |
|---|---|---|---|---|---|---|---|
| A | 12223 | 10425 | 29 | 29 | 0.24% | 0.28% | 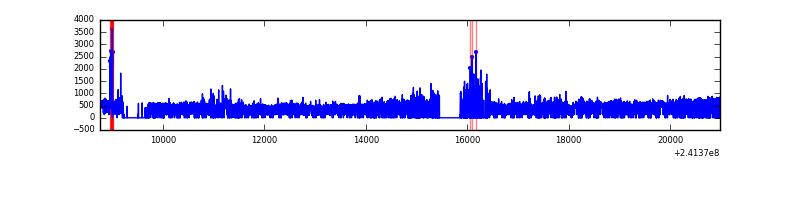 |
| B | 12225 | 10610 | 6 | 6 | 0.05% | 0.06% | 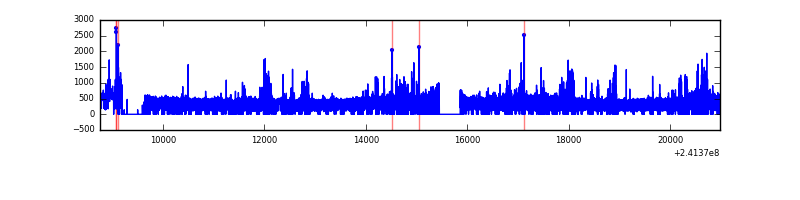 |
| C | 12225 | 11053 | 0 | 0 | 0.00% | 0.00% | 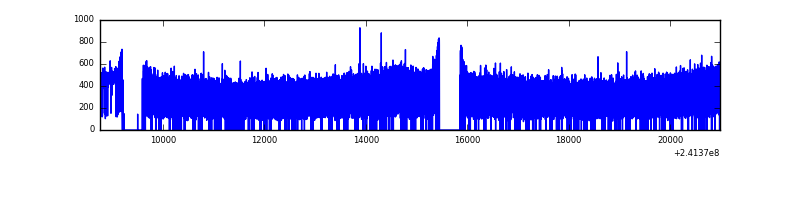 |
| D | 12224 | 10710 | 38 | 38 | 0.31% | 0.35% | 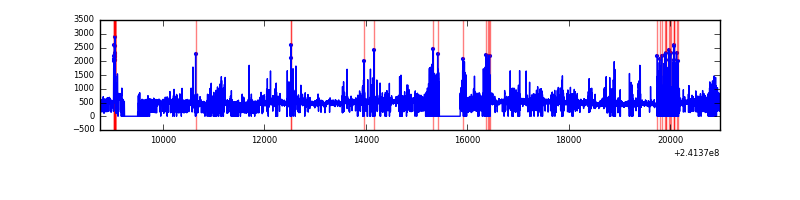 |
Top three noisy pixels from each quadrant. If the there are fewer than three noisy pixels in the level2.evt file, extra rows are filled as -1
| Pixel properties | Quadrant properties | ||||||
|---|---|---|---|---|---|---|---|
| Quadrant | DetID | PixID | Counts | Sigma | Mean | Median | Sigma |
| A | 8 | 15 | 828613 | 4138.31 | 975 | 953 | 200.0 |
| A | 15 | 174 | 70922 | 349.84 | 975 | 953 | 200.0 |
| A | 8 | 5 | 42356 | 207.01 | 975 | 953 | 200.0 |
| B | 4 | 239 | 304294 | 1591.39 | 1002 | 976 | 190.6 |
| B | 11 | 51 | 93711 | 486.54 | 1002 | 976 | 190.6 |
| B | 0 | 214 | 74246 | 384.42 | 1002 | 976 | 190.6 |
| C | 8 | 128 | 8735 | 31.65 | 1051 | 1056 | 242.6 |
| C | 13 | 61 | 8092 | 29.0 | 1051 | 1056 | 242.6 |
| C | 14 | 234 | 5930 | 20.09 | 1051 | 1056 | 242.6 |
| D | 8 | 195 | 694186 | 2680.28 | 1072 | 1041 | 258.6 |
| D | 1 | 52 | 455079 | 1755.69 | 1072 | 1041 | 258.6 |
| D | 2 | 33 | 251724 | 969.35 | 1072 | 1041 | 258.6 |
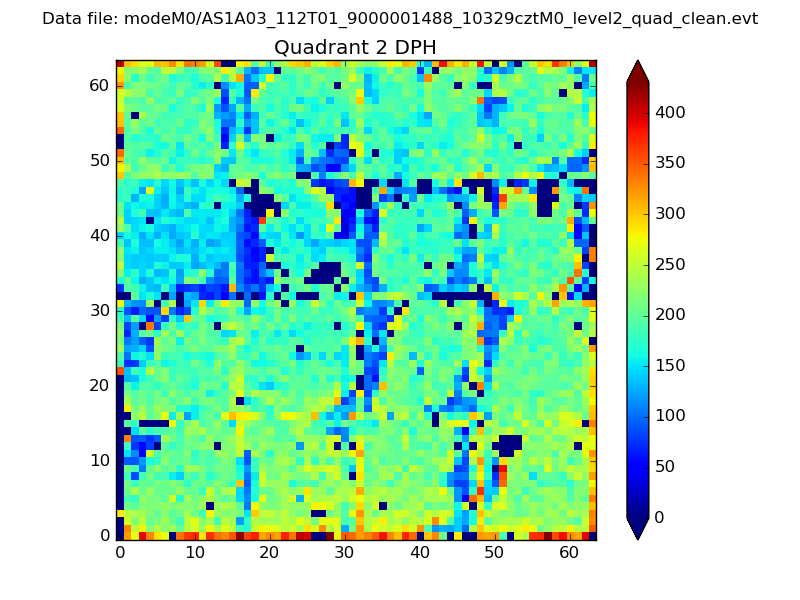
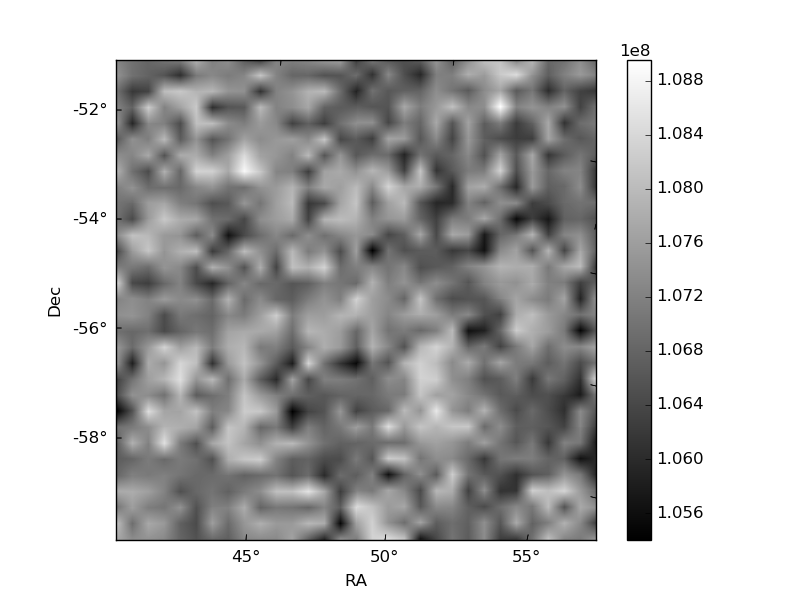
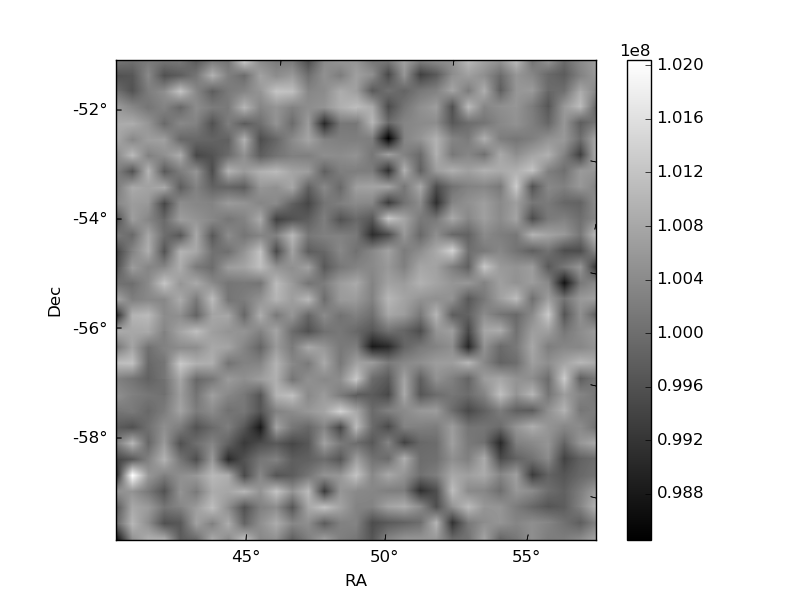
Histogram calculated using DETX and DETY for each event in the final _common_clean file
| Quadrant A | 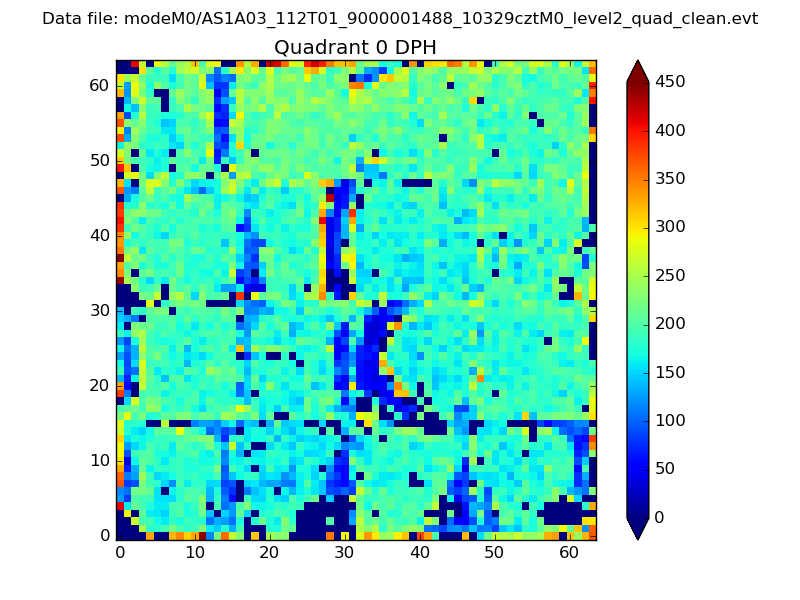 |
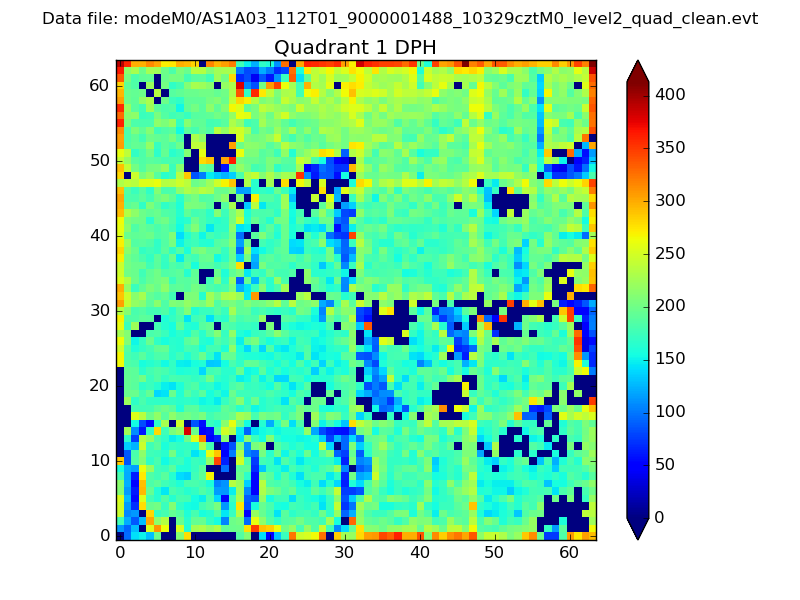 |
Quadrant B |
|---|---|---|---|
| Quadrant D | 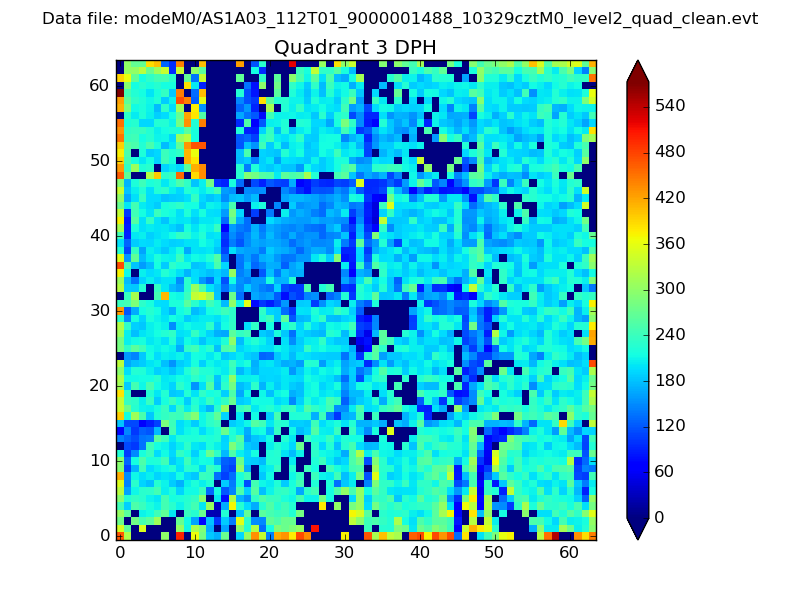 |
 |
Quadrant C |
| Plot type | Count rate plots | Images |
|---|---|---|
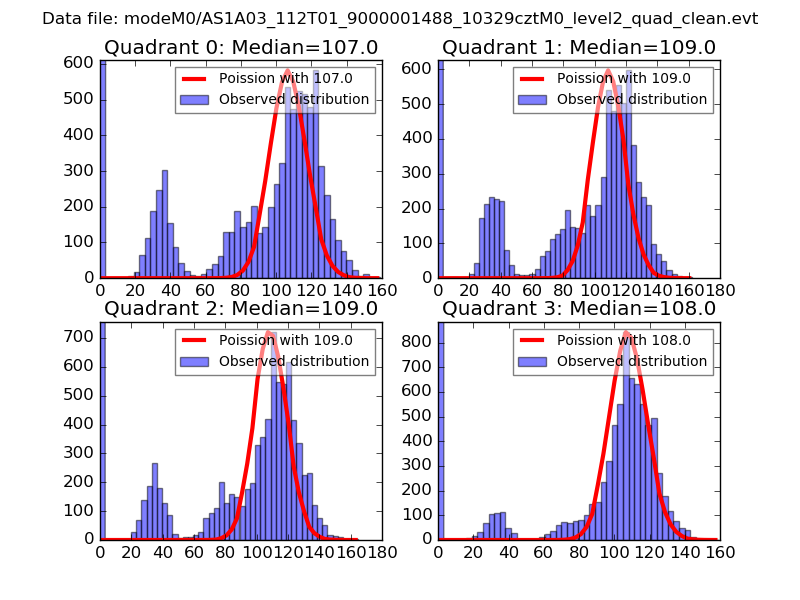
| Comparison with Poisson distribution Blue bars denote a histogram of data divided into 1 sec bins. Red curve is a Poisson curve with rate = median count rate of data. |
 |
 |
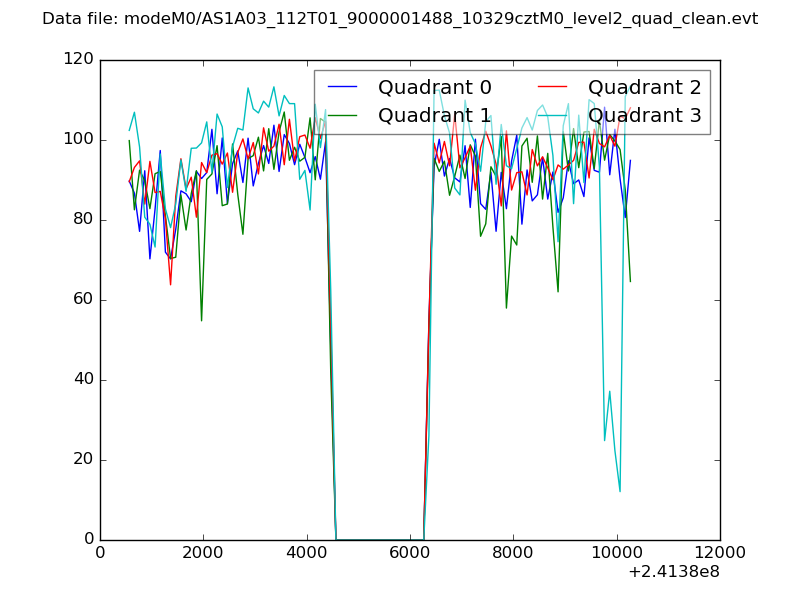
| Quadrant-wise count rates Data is divided into 100 sec bins |
 |
|
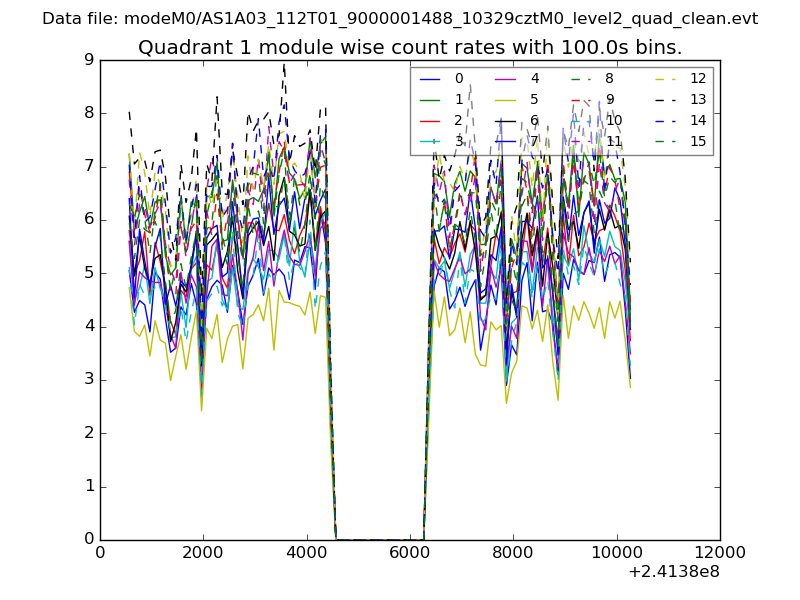
| Module-wise count rates for Quadrant A Data is divided into 100 sec bins |
 |
 |
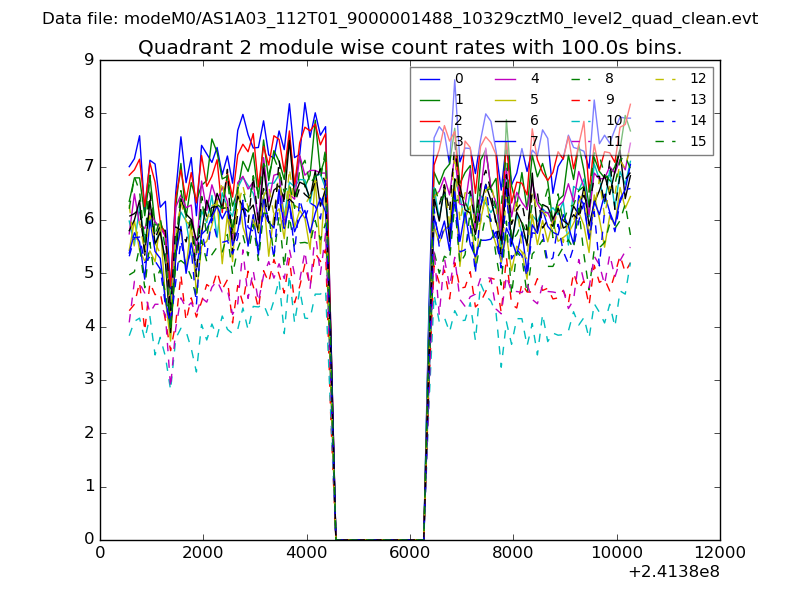
| Module-wise count rates for Quadrant B Data is divided into 100 sec bins |
 |
 |
| Module-wise count rates for Quadrant C Data is divided into 100 sec bins |
 |
 |
| Module-wise count rates for Quadrant D Data is divided into 100 sec bins |
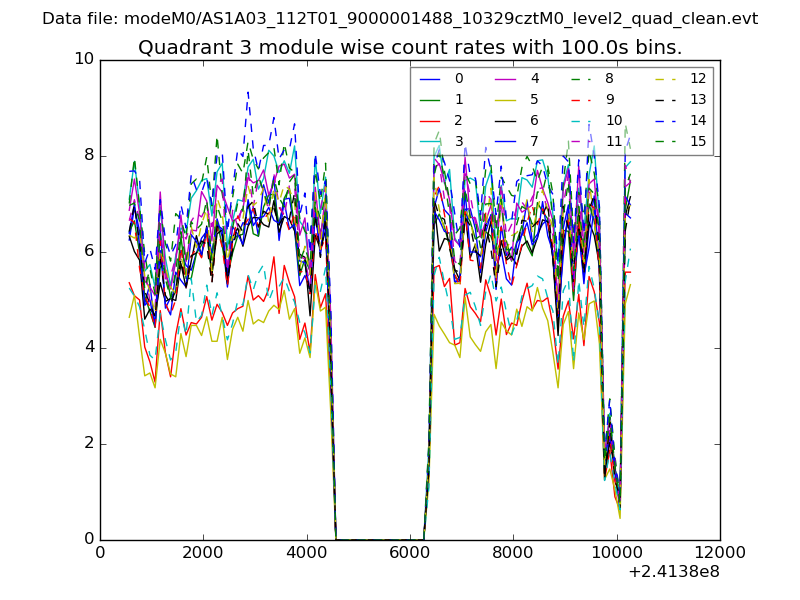 |
 |
| Parameter | Plot |
|---|---|
| CZT HV Monitor | 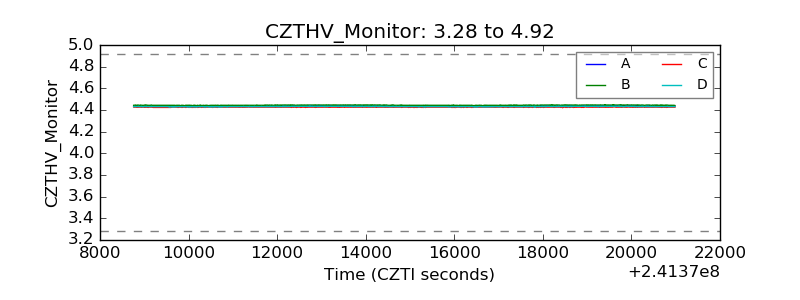 |
| D_VDD | 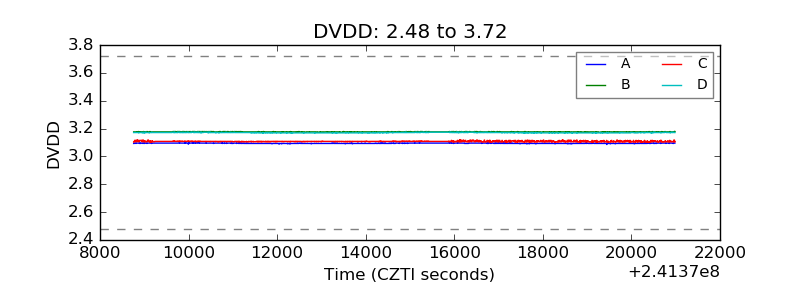 |
| Temperature 1 | 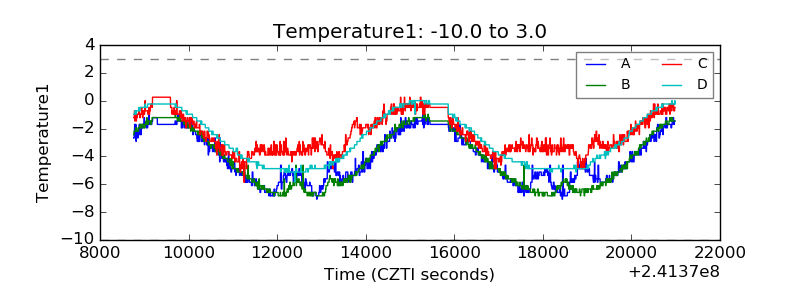 |
| Veto HV Monitor | 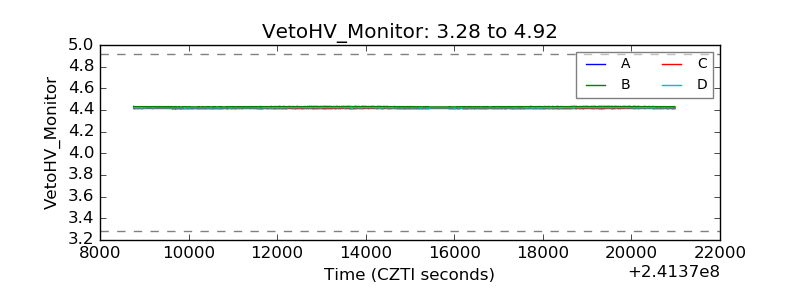 |
| Veto LLD | 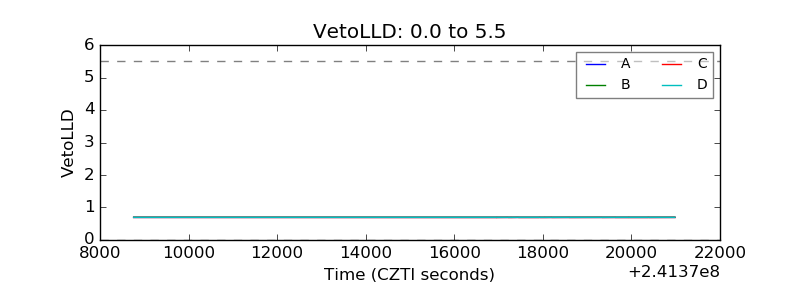 |
| Alpha Counter | 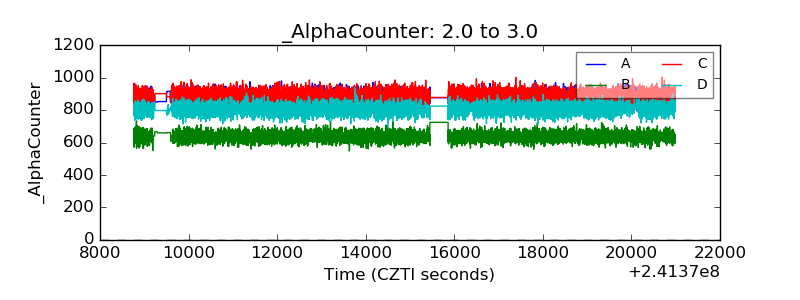 |
| _CPM_Rate | 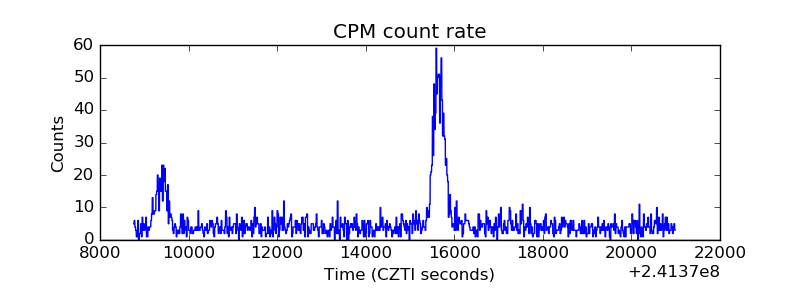 |
| CZT Counter | 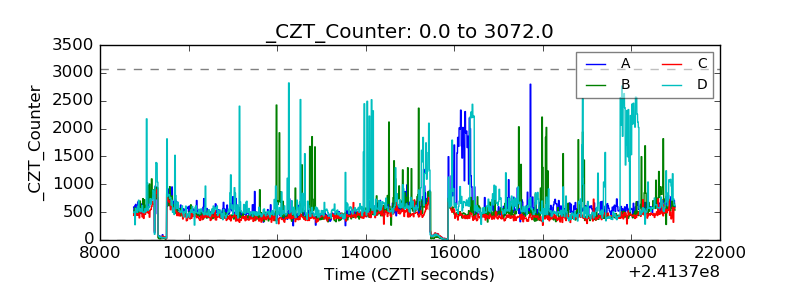 |
| +2.5 Volts monitor |  |
| +5 Volts monitor |  |
| _ROLL_ROT | 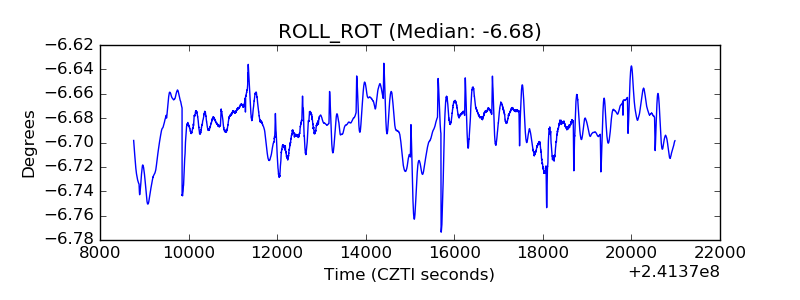 |
| _Roll_DEC | 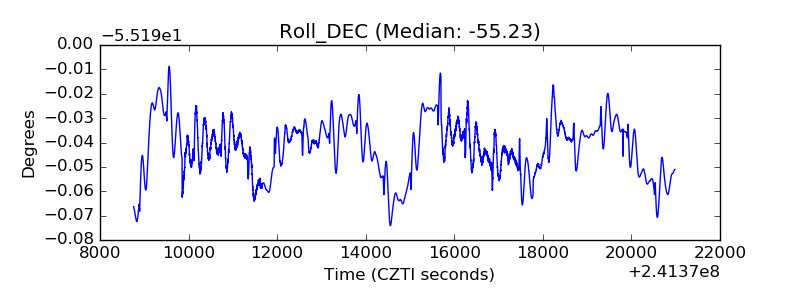 |
| _Roll_RA | 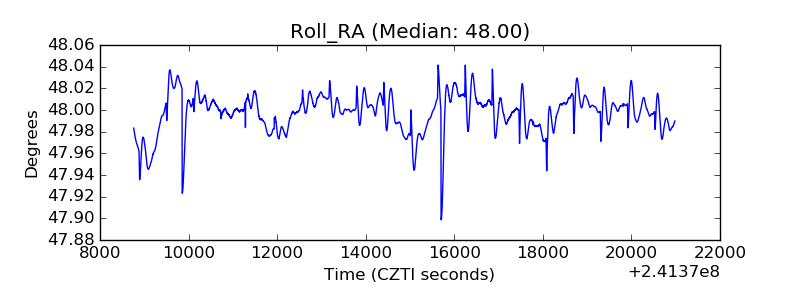 |
| Veto Counter | 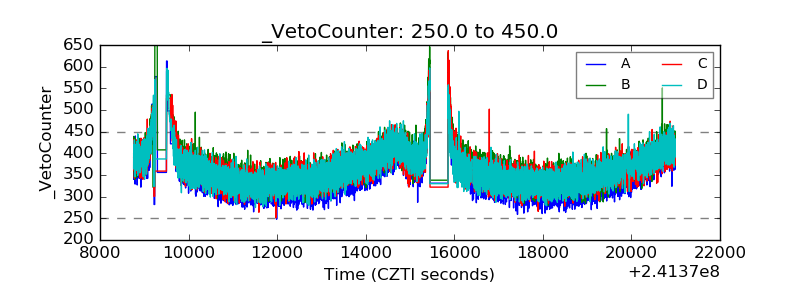 |