| Param | Original file | Final file |
|---|---|---|
| Filename | modeM0/AS1A03_112T01_9000001488_10331cztM0_level2.evt | modeM0/AS1A03_112T01_9000001488_10331cztM0_level2_quad_clean.evt |
| Size (bytes) | 1,191,718,080 | 222,560,640 |
| Size | 1.1 GB | 212.3 MB |
| Events in quadrant A | 8,395,628 | 1,348,860 |
| Events in quadrant B | 8,945,430 | 1,381,021 |
| Events in quadrant C | 7,733,673 | 1,401,156 |
| Events in quadrant D | 9,839,910 | 1,411,995 |
| Mode M9 | |||
|---|---|---|---|
| Quadrant | BADHDUFLAG | Total packets | Discarded packets |
| A | 0 | 50 | 15 |
| B | 0 | 55 | 20 |
| C | 0 | 55 | 20 |
| D | 0 | 53 | 18 |
| Mode SS | |||
|---|---|---|---|
| Quadrant | BADHDUFLAG | Total packets | Discarded packets |
| A | 0 | 562 | 189 |
| B | 0 | 562 | 190 |
| C | 0 | 562 | 196 |
| D | 0 | 549 | 178 |
| Mode M0 | |||
|---|---|---|---|
| Quadrant | BADHDUFLAG | Total packets | Discarded packets |
| A | 0 | 63791 | 27193 |
| B | 0 | 61986 | 23933 |
| C | 0 | 55694 | 20537 |
| D | 0 | 61794 | 20316 |
| Quadrant | Total seconds | Saturated seconds | Saturation percentage |
|---|---|---|---|
| A | 16713 | 113 | 0.676120% |
| B | 16975 | 243 | 1.431517% |
| C | 17399 | 53 | 0.304615% |
| D | 18324 | 184 | 1.004148% |
Noise dominated data is calculated using 1-second bins in cleaned event files. If a bin has >2000 counts, and if more than 50% of those come from <1% of pixels, then it is considered to be noise-dominated and hence unusable.
| Quadrant | # 1 sec bins | Bins with >0 counts | Bins with >2000 counts | High rate bins dominated by noise | Noise dominated (total time) | Noise dominated (detector-on time) | Marked lightcurve |
|---|---|---|---|---|---|---|---|
| A | 22283 | 18011 | 20 | 20 | 0.09% | 0.11% | 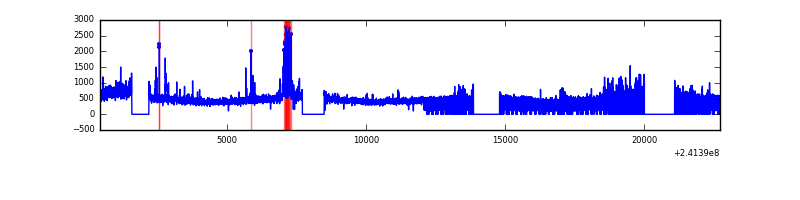 |
| B | 22283 | 18288 | 106 | 106 | 0.48% | 0.58% | 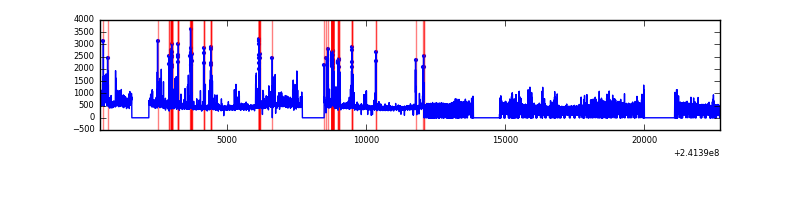 |
| C | 22282 | 18588 | 0 | 0 | 0.00% | 0.00% | 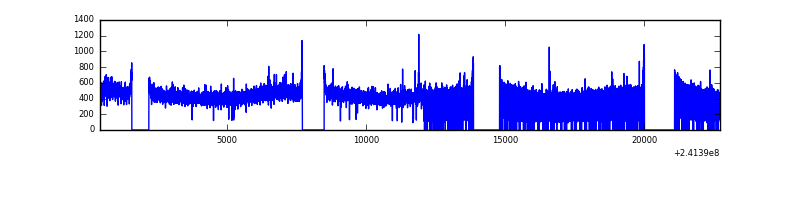 |
| D | 22283 | 18609 | 121 | 121 | 0.54% | 0.65% | 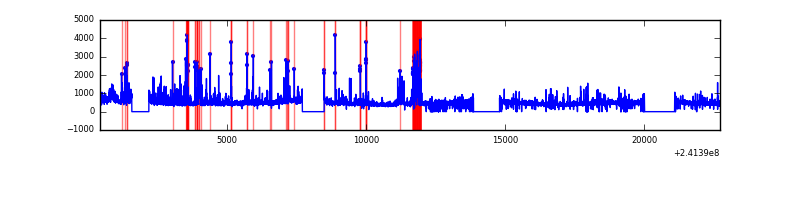 |
Top three noisy pixels from each quadrant. If the there are fewer than three noisy pixels in the level2.evt file, extra rows are filled as -1
| Pixel properties | Quadrant properties | ||||||
|---|---|---|---|---|---|---|---|
| Quadrant | DetID | PixID | Counts | Sigma | Mean | Median | Sigma |
| A | 8 | 15 | 505101 | 1301.26 | 1917 | 1874 | 386.7 |
| A | 13 | 251 | 407227 | 1048.17 | 1917 | 1874 | 386.7 |
| A | 3 | 1 | 43597 | 107.89 | 1917 | 1874 | 386.7 |
| B | 4 | 239 | 849654 | 2282.77 | 1962 | 1910 | 371.4 |
| B | 11 | 51 | 181975 | 484.87 | 1962 | 1910 | 371.4 |
| B | 0 | 219 | 97955 | 258.63 | 1962 | 1910 | 371.4 |
| C | 13 | 61 | 14689 | 27.72 | 1980 | 1987 | 458.2 |
| C | 14 | 234 | 11879 | 21.59 | 1980 | 1987 | 458.2 |
| C | 3 | 202 | 4981 | 6.53 | 1980 | 1987 | 458.2 |
| D | 2 | 33 | 606288 | 1234.14 | 2064 | 2009 | 489.6 |
| D | 8 | 195 | 509303 | 1036.06 | 2064 | 2009 | 489.6 |
| D | 1 | 52 | 329719 | 669.29 | 2064 | 2009 | 489.6 |
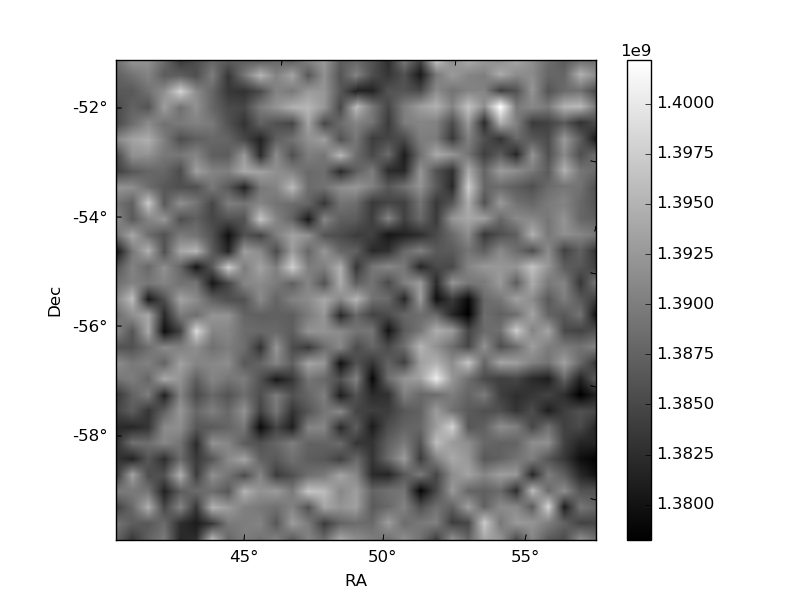
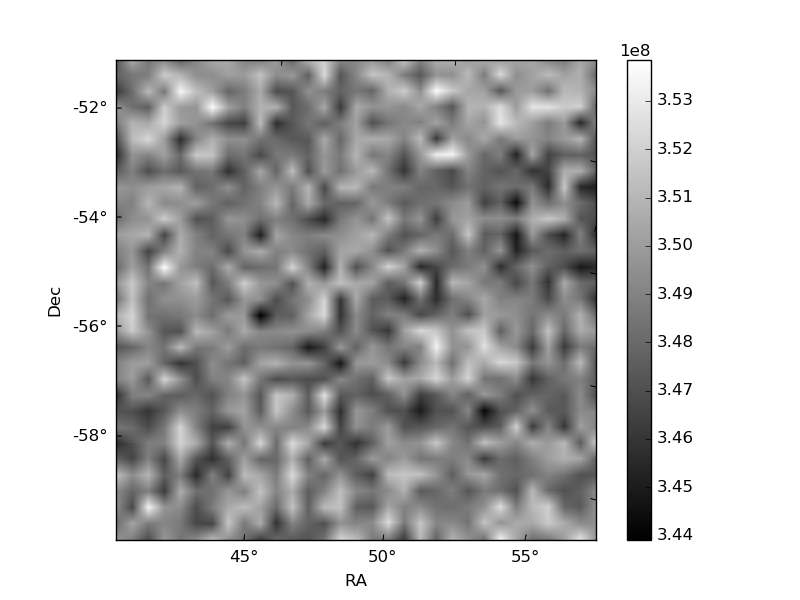
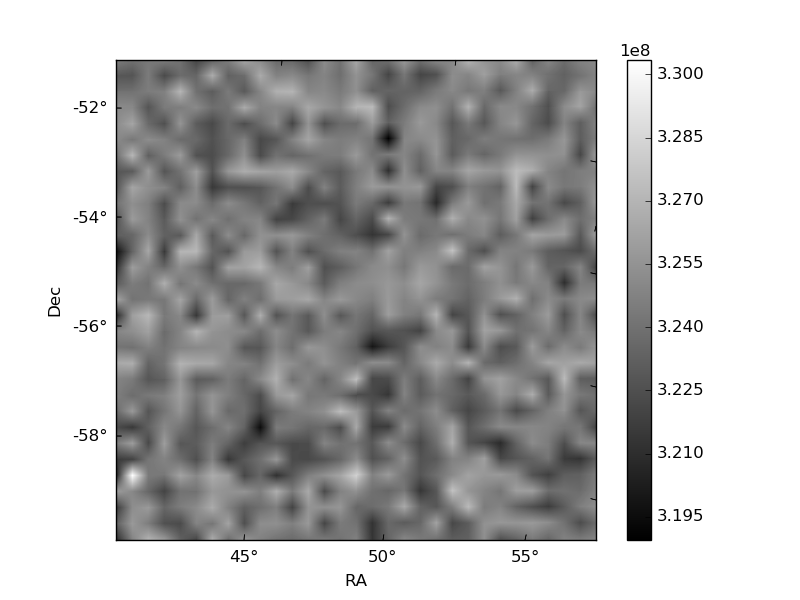
Histogram calculated using DETX and DETY for each event in the final _common_clean file
| Quadrant A | 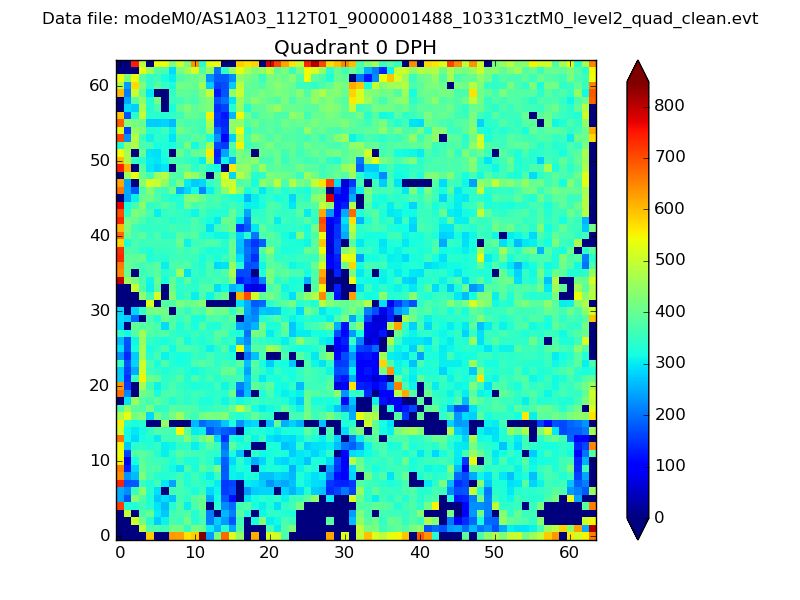 |
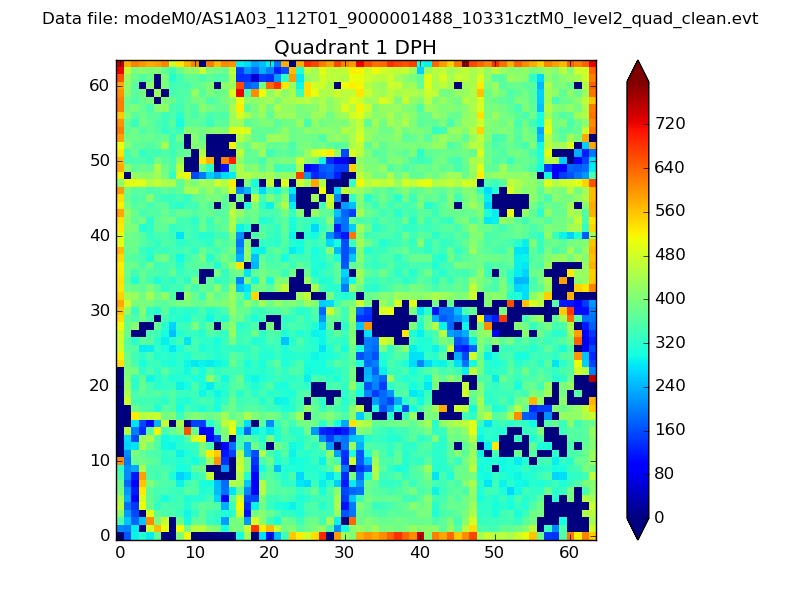 |
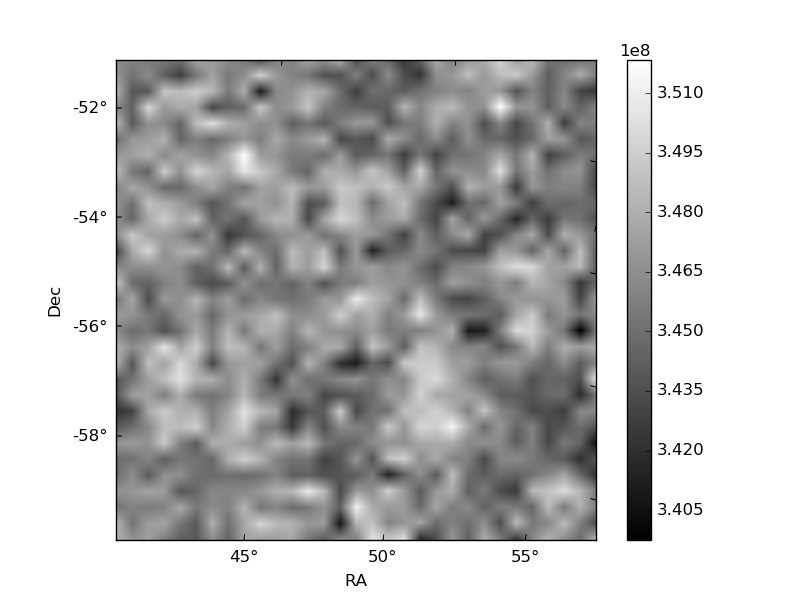
Quadrant B |
|---|---|---|---|
| Quadrant D | 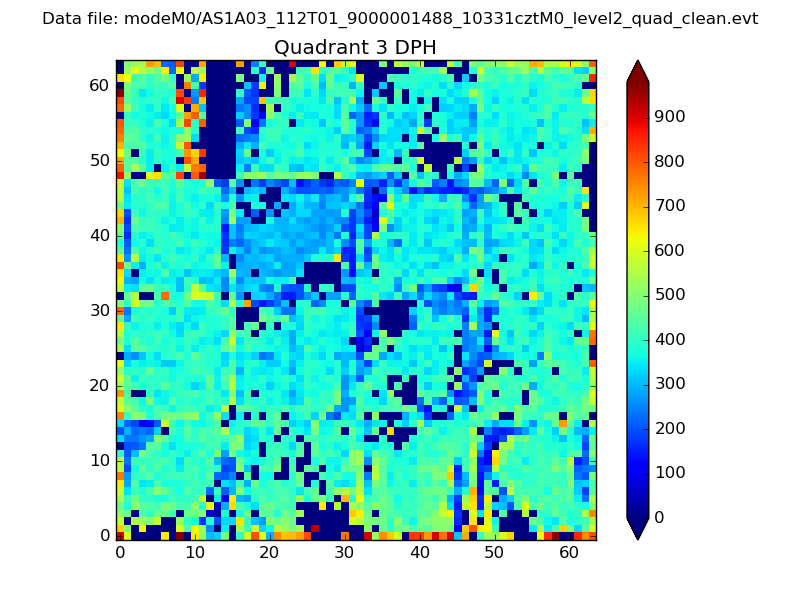 |
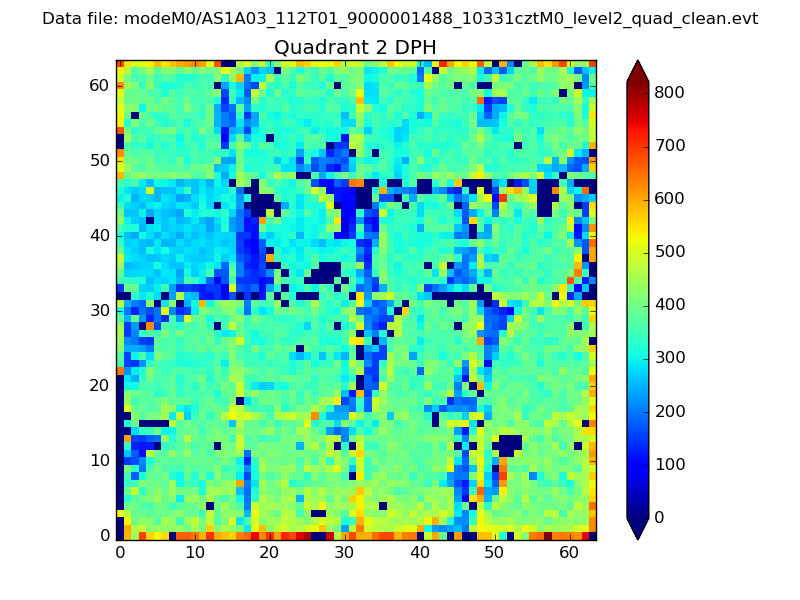 |
Quadrant C |
| Plot type | Count rate plots | Images |
|---|---|---|
| Comparison with Poisson distribution Blue bars denote a histogram of data divided into 1 sec bins. Red curve is a Poisson curve with rate = median count rate of data. |
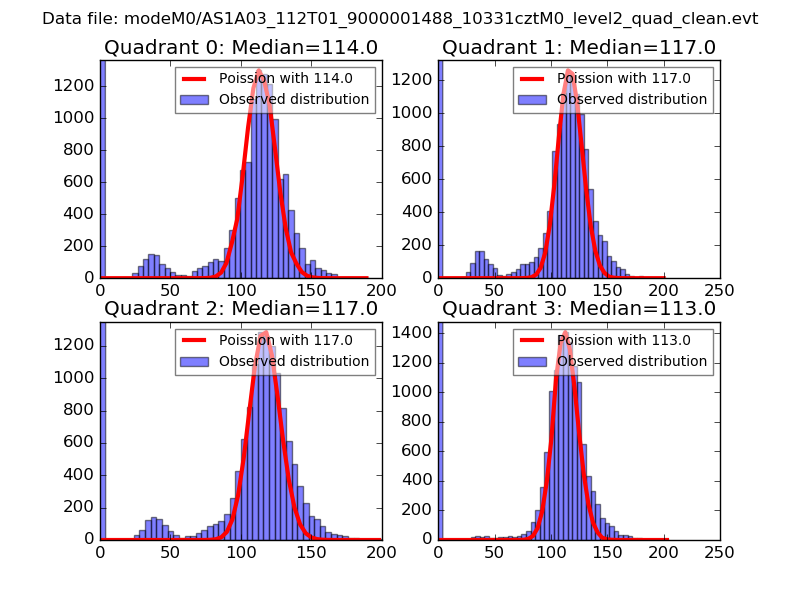 |
 |
| Quadrant-wise count rates Data is divided into 100 sec bins |
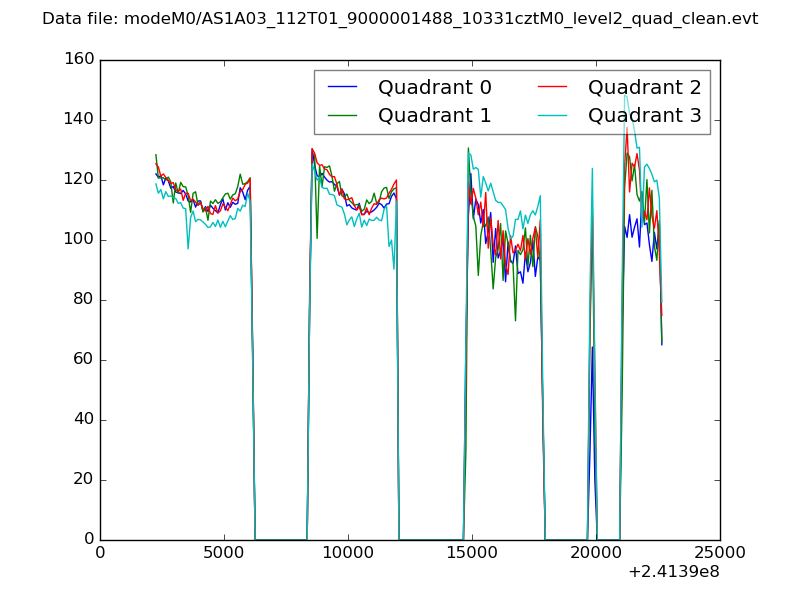 |
|
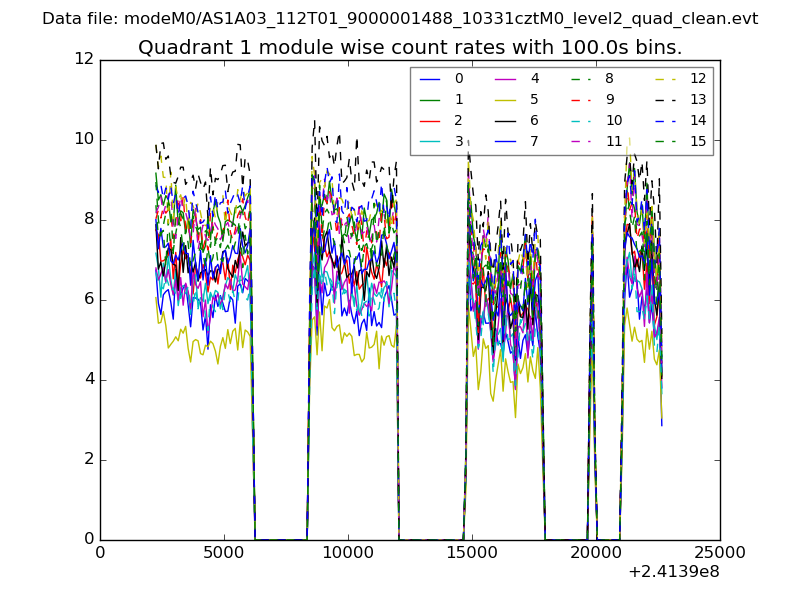
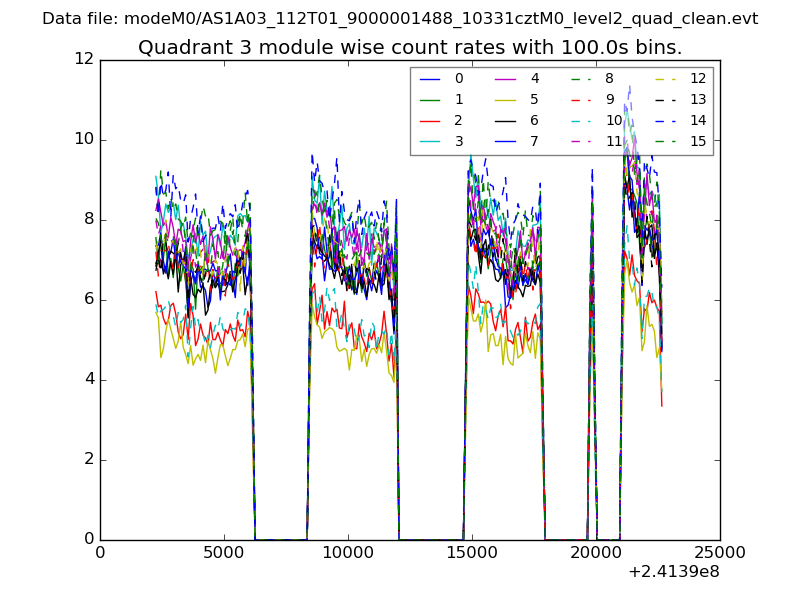
| Module-wise count rates for Quadrant A Data is divided into 100 sec bins |
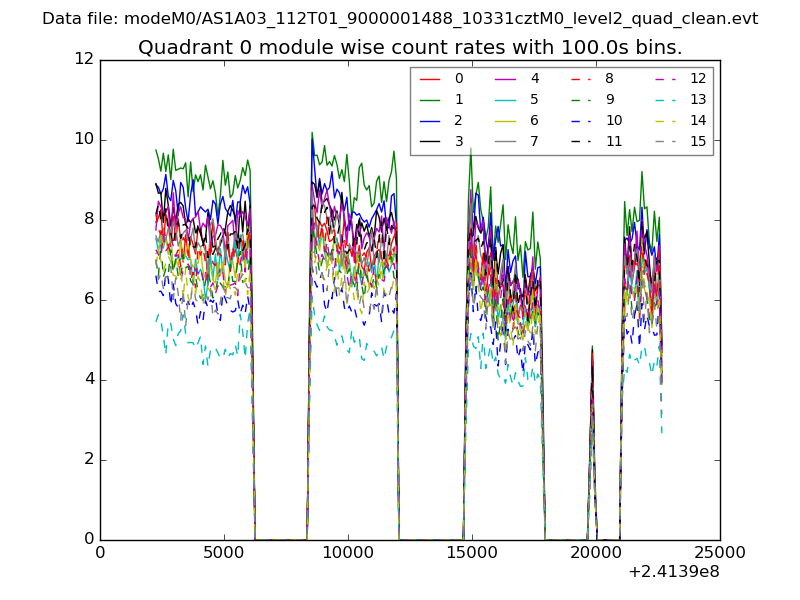 |
 |
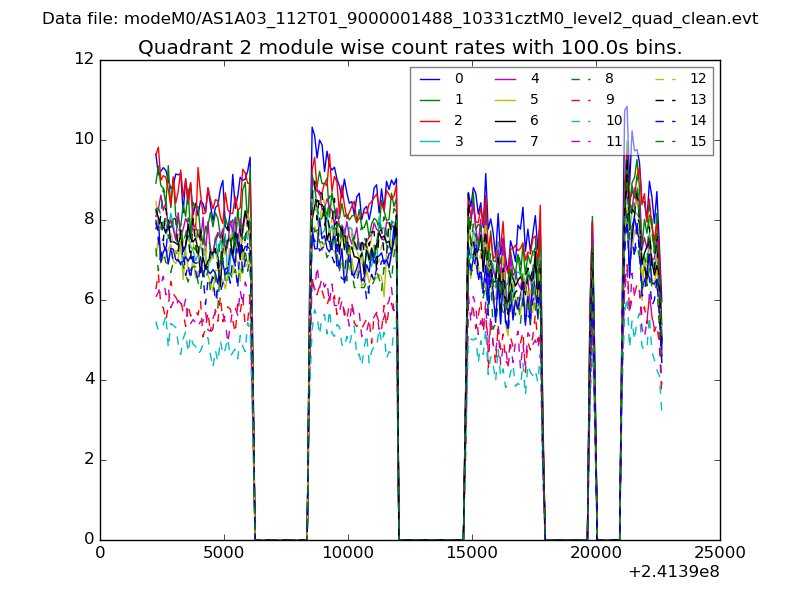
| Module-wise count rates for Quadrant B Data is divided into 100 sec bins |
 |
 |
| Module-wise count rates for Quadrant C Data is divided into 100 sec bins |
 |
 |
| Module-wise count rates for Quadrant D Data is divided into 100 sec bins |
 |
 |
| Parameter | Plot |
|---|---|
| CZT HV Monitor | 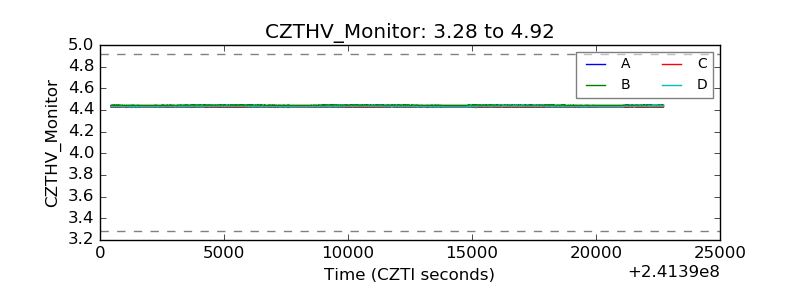 |
| D_VDD | 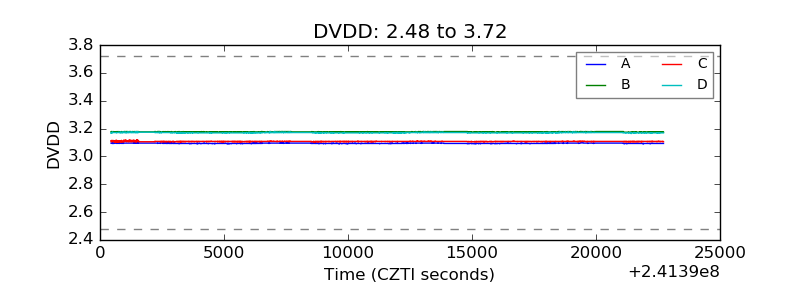 |
| Temperature 1 | 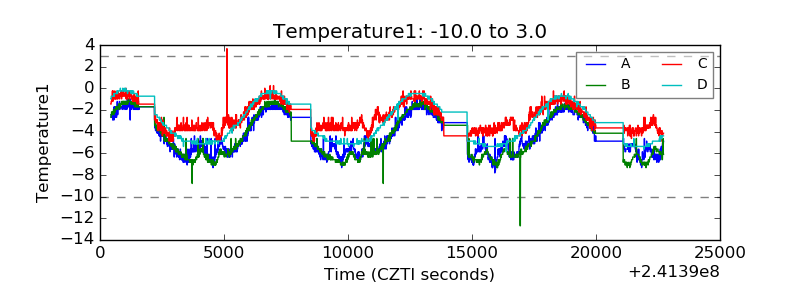 |
| Veto HV Monitor | 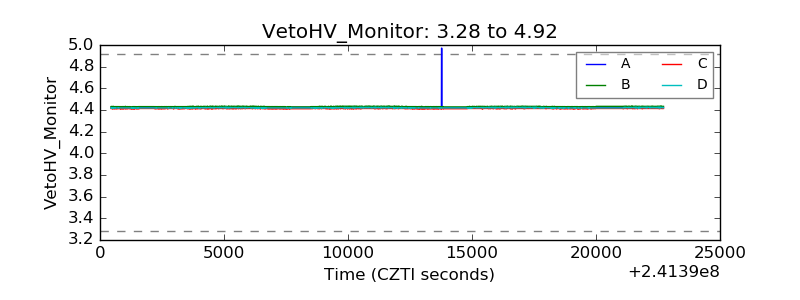 |
| Veto LLD |  |
| Alpha Counter | 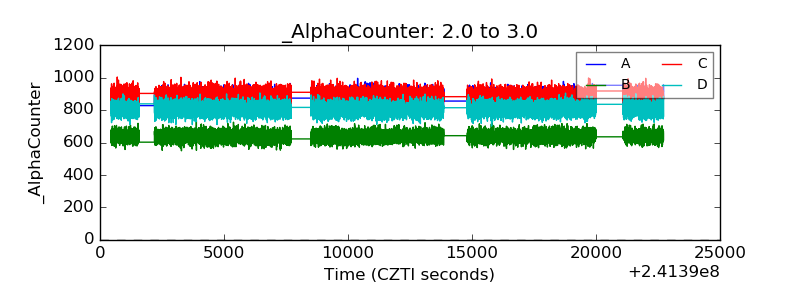 |
| _CPM_Rate | 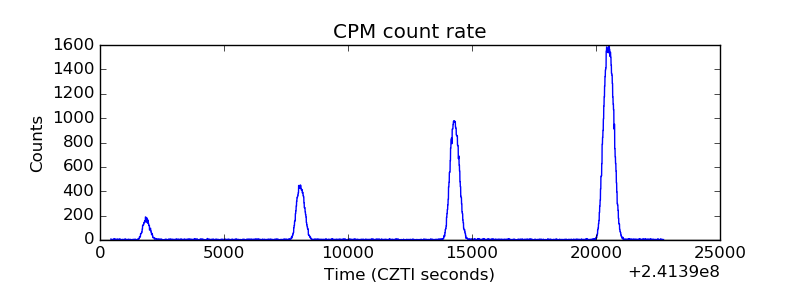 |
| CZT Counter | 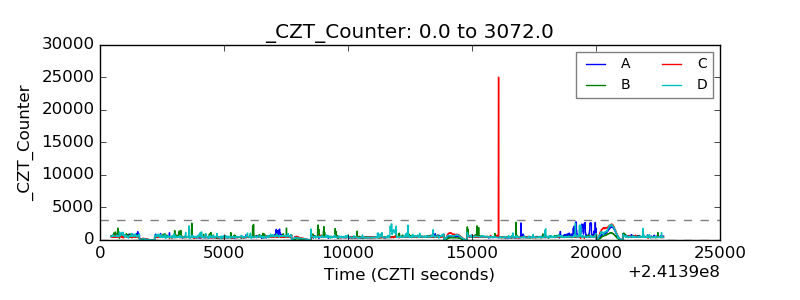 |
| +2.5 Volts monitor |  |
| +5 Volts monitor |  |
| _ROLL_ROT | 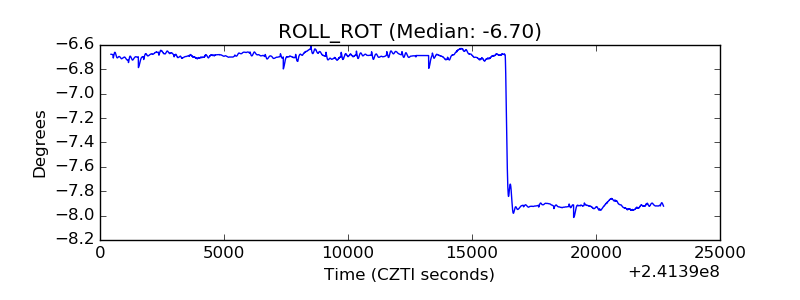 |
| _Roll_DEC | 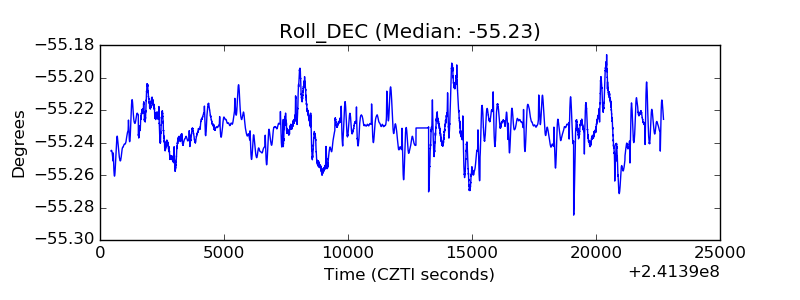 |
| _Roll_RA | 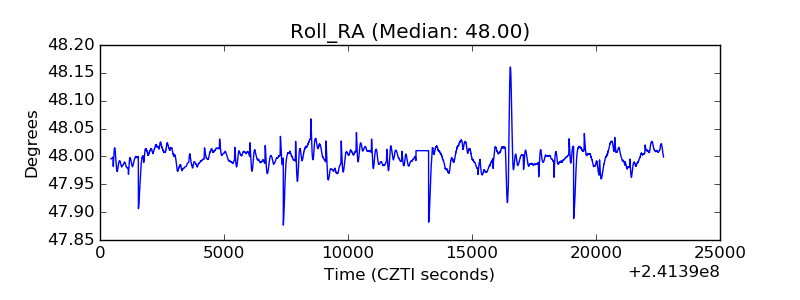 |
| Veto Counter | 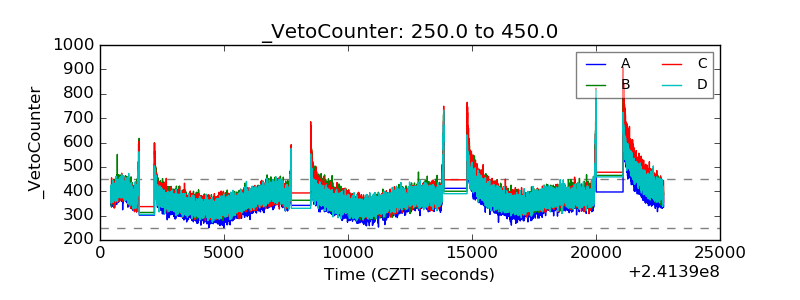 |