| Param | Original file | Final file |
|---|---|---|
| Filename | modeM0/AS1A03_112T01_9000001488_10332cztM0_level2.evt | modeM0/AS1A03_112T01_9000001488_10332cztM0_level2_quad_clean.evt |
| Size (bytes) | 292,740,480 | 64,031,040 |
| Size | 279.2 MB | 61.1 MB |
| Events in quadrant A | 2,006,790 | 373,267 |
| Events in quadrant B | 2,083,093 | 405,985 |
| Events in quadrant C | 2,188,465 | 434,299 |
| Events in quadrant D | 2,287,618 | 417,403 |
| Mode M9 | |||
|---|---|---|---|
| Quadrant | BADHDUFLAG | Total packets | Discarded packets |
| A | 0 | 22 | 10 |
| B | 0 | 24 | 12 |
| C | 0 | 23 | 11 |
| D | 0 | 19 | 7 |
| Mode SS | |||
|---|---|---|---|
| Quadrant | BADHDUFLAG | Total packets | Discarded packets |
| A | 0 | 190 | 80 |
| B | 0 | 190 | 84 |
| C | 0 | 190 | 85 |
| D | 0 | 184 | 76 |
| Mode M0 | |||
|---|---|---|---|
| Quadrant | BADHDUFLAG | Total packets | Discarded packets |
| A | 0 | 21571 | 13652 |
| B | 0 | 20984 | 12141 |
| C | 0 | 19276 | 9610 |
| D | 0 | 23061 | 13518 |
| Quadrant | Total seconds | Saturated seconds | Saturation percentage |
|---|---|---|---|
| A | 3808 | 2 | 0.052521% |
| B | 4361 | 5 | 0.114653% |
| C | 4805 | 2 | 0.041623% |
| D | 4350 | 25 | 0.574713% |
Noise dominated data is calculated using 1-second bins in cleaned event files. If a bin has >2000 counts, and if more than 50% of those come from <1% of pixels, then it is considered to be noise-dominated and hence unusable.
| Quadrant | # 1 sec bins | Bins with >0 counts | Bins with >2000 counts | High rate bins dominated by noise | Noise dominated (total time) | Noise dominated (detector-on time) | Marked lightcurve |
|---|---|---|---|---|---|---|---|
| A | 6832 | 4392 | 0 | 0 | 0.00% | 0.00% | 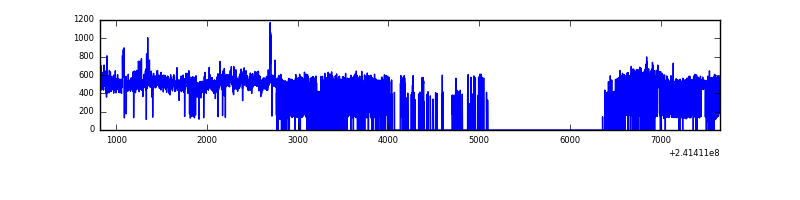 |
| B | 6833 | 4991 | 1 | 1 | 0.01% | 0.02% | 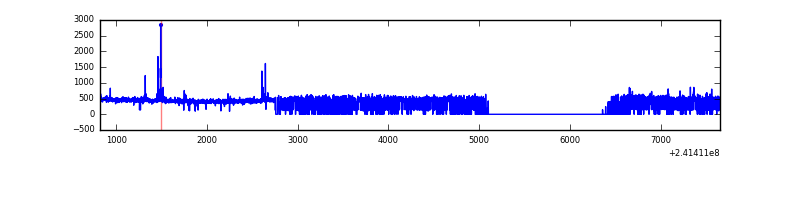 |
| C | 6833 | 5339 | 1 | 1 | 0.01% | 0.02% | 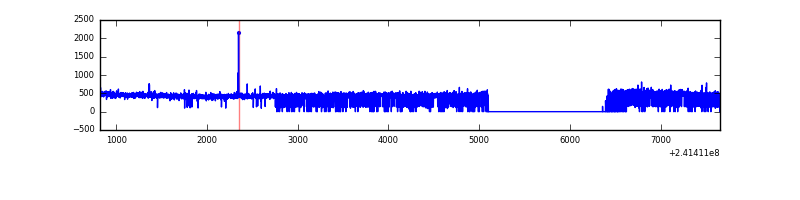 |
| D | 6833 | 4684 | 21 | 21 | 0.31% | 0.45% | 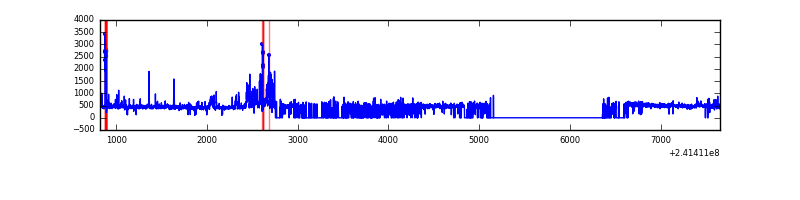 |
Top three noisy pixels from each quadrant. If the there are fewer than three noisy pixels in the level2.evt file, extra rows are filled as -1
| Pixel properties | Quadrant properties | ||||||
|---|---|---|---|---|---|---|---|
| Quadrant | DetID | PixID | Counts | Sigma | Mean | Median | Sigma |
| A | 8 | 15 | 295516 | 3331.53 | 434 | 424 | 88.6 |
| A | 13 | 251 | 23832 | 264.27 | 434 | 424 | 88.6 |
| A | 15 | 174 | 10049 | 108.66 | 434 | 424 | 88.6 |
| B | 4 | 239 | 45879 | 472.31 | 505 | 492 | 96.1 |
| B | 0 | 187 | 23828 | 242.84 | 505 | 492 | 96.1 |
| B | 11 | 51 | 23791 | 242.45 | 505 | 492 | 96.1 |
| C | 14 | 234 | 8245 | 59.34 | 559 | 562 | 129.5 |
| C | 13 | 61 | 4194 | 28.05 | 559 | 562 | 129.5 |
| C | 3 | 202 | 1466 | 6.98 | 559 | 562 | 129.5 |
| D | 1 | 52 | 259088 | 2148.03 | 500 | 485 | 120.4 |
| D | 2 | 14 | 53707 | 442.08 | 500 | 485 | 120.4 |
| D | 2 | 33 | 27551 | 224.82 | 500 | 485 | 120.4 |
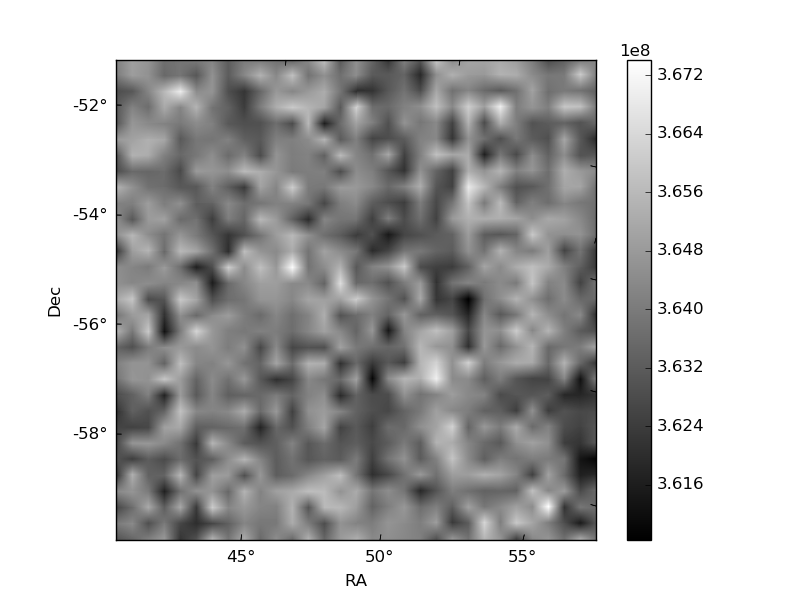
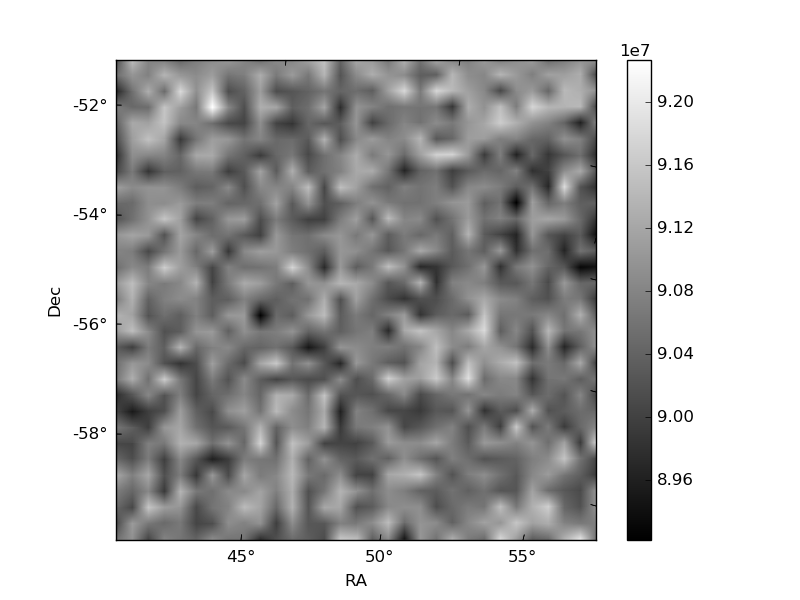
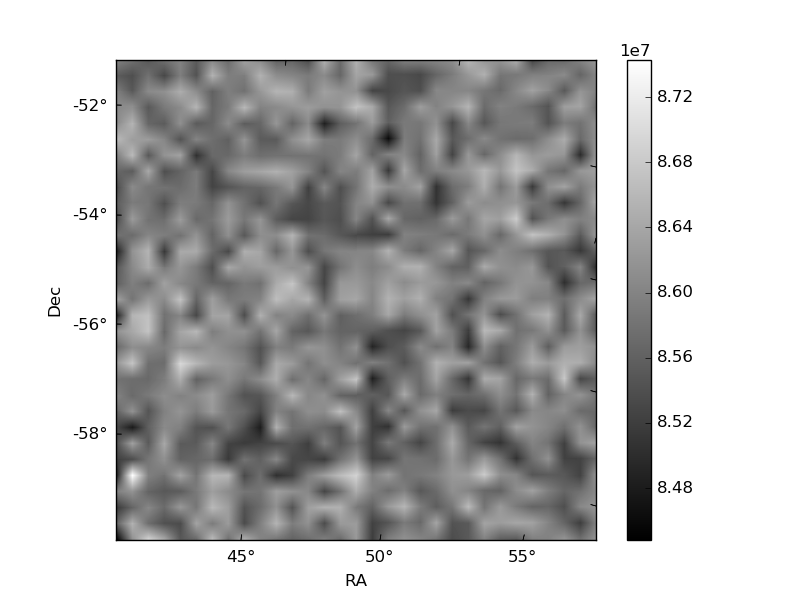
Histogram calculated using DETX and DETY for each event in the final _common_clean file
| Quadrant A | 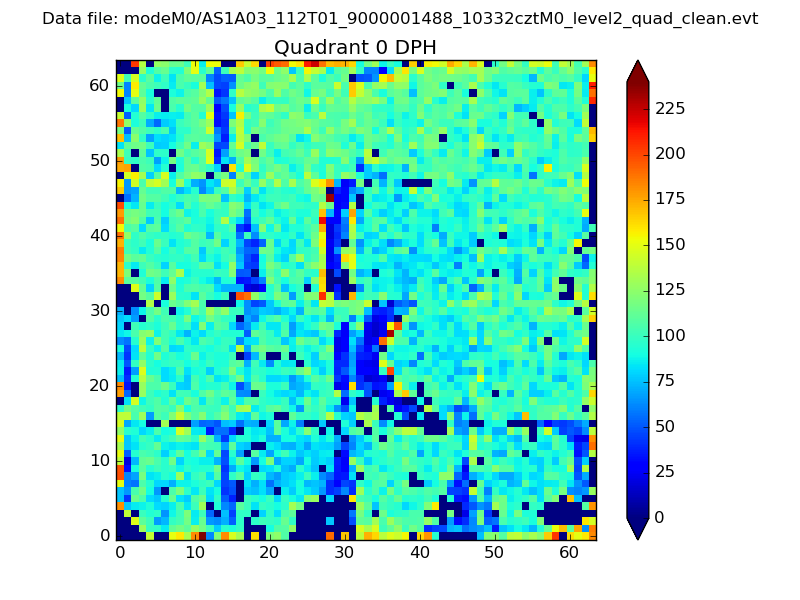 |
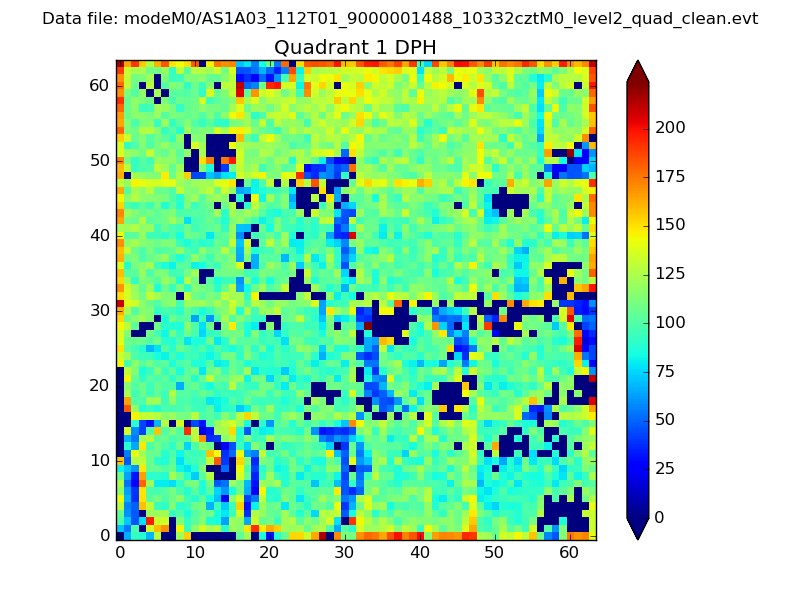 |
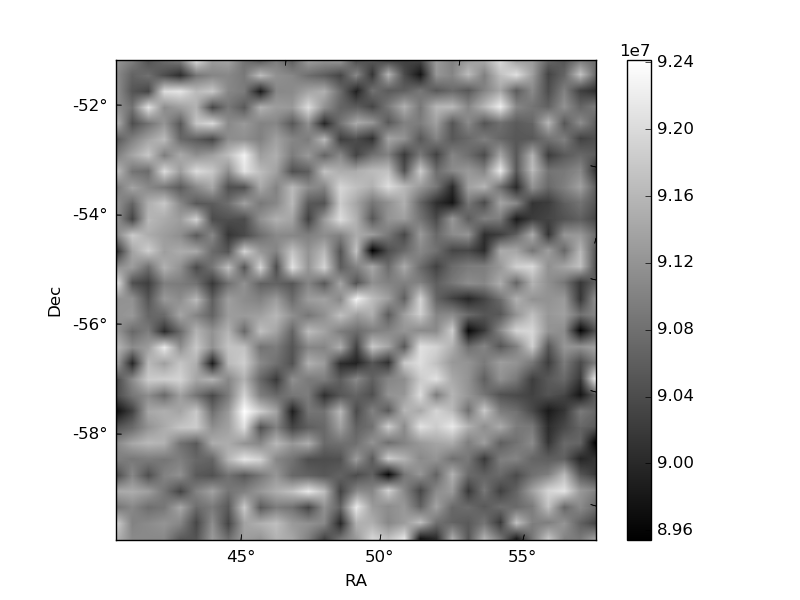
Quadrant B |
|---|---|---|---|
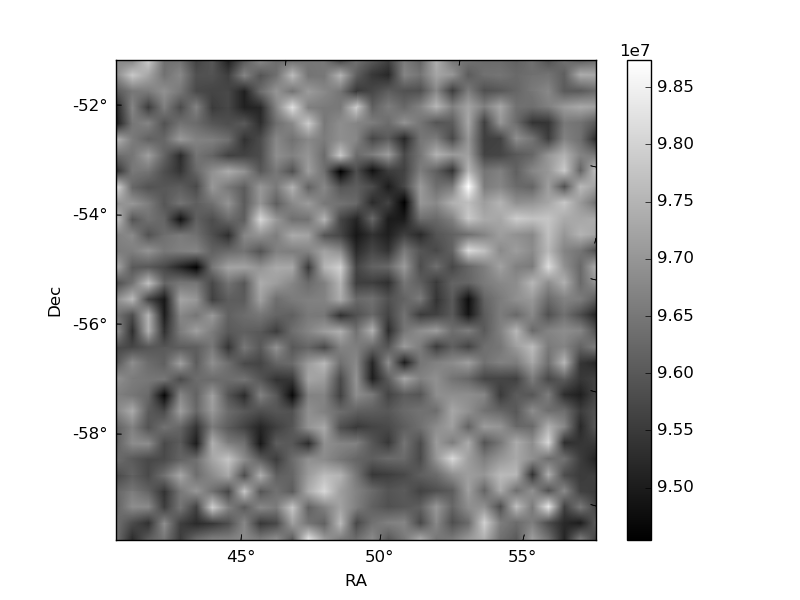
| Quadrant D | 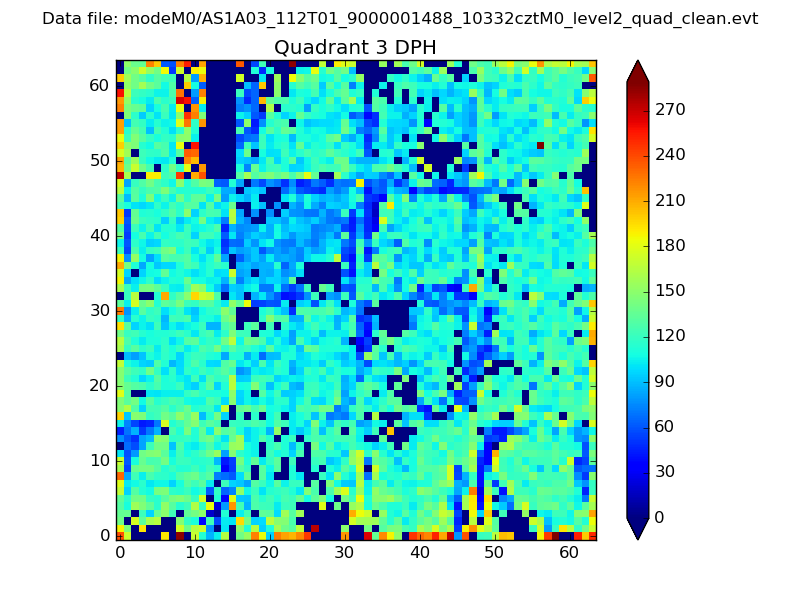 |
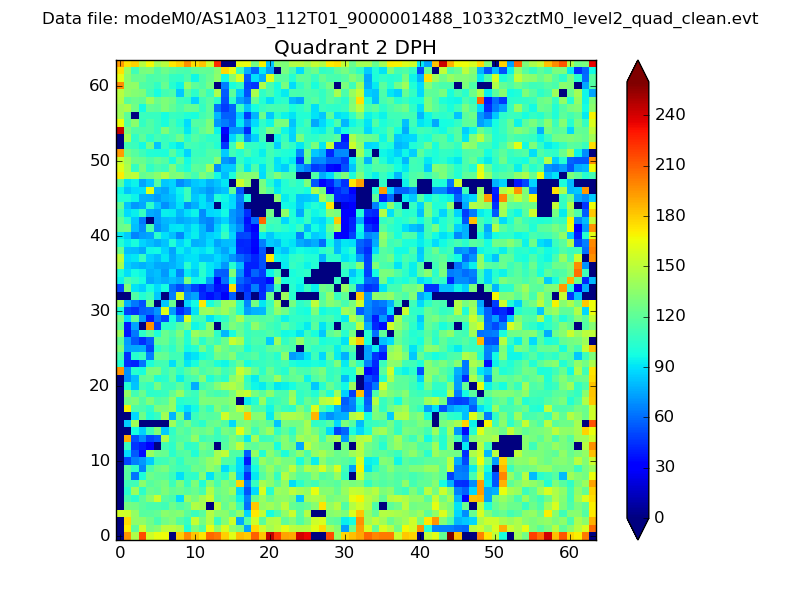 |
Quadrant C |
| Plot type | Count rate plots | Images |
|---|---|---|
| Comparison with Poisson distribution Blue bars denote a histogram of data divided into 1 sec bins. Red curve is a Poisson curve with rate = median count rate of data. |
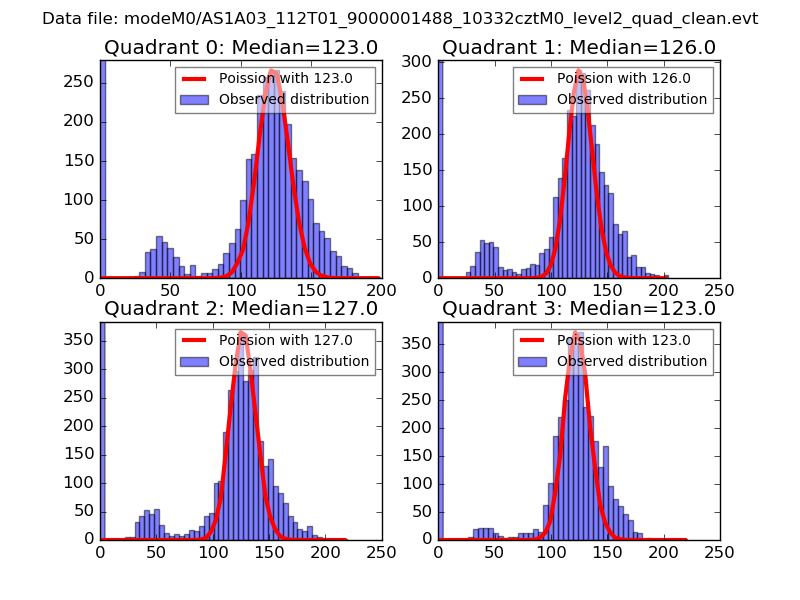 |
 |
| Quadrant-wise count rates Data is divided into 100 sec bins |
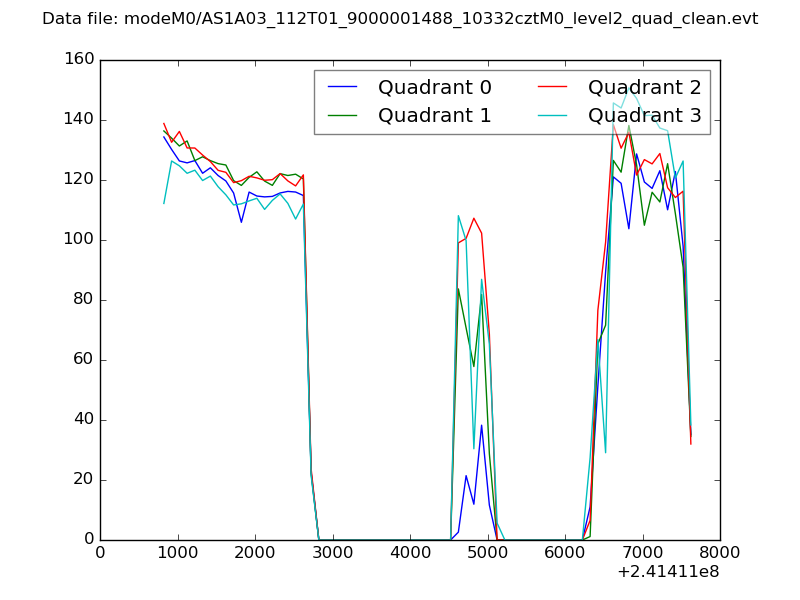 |
|
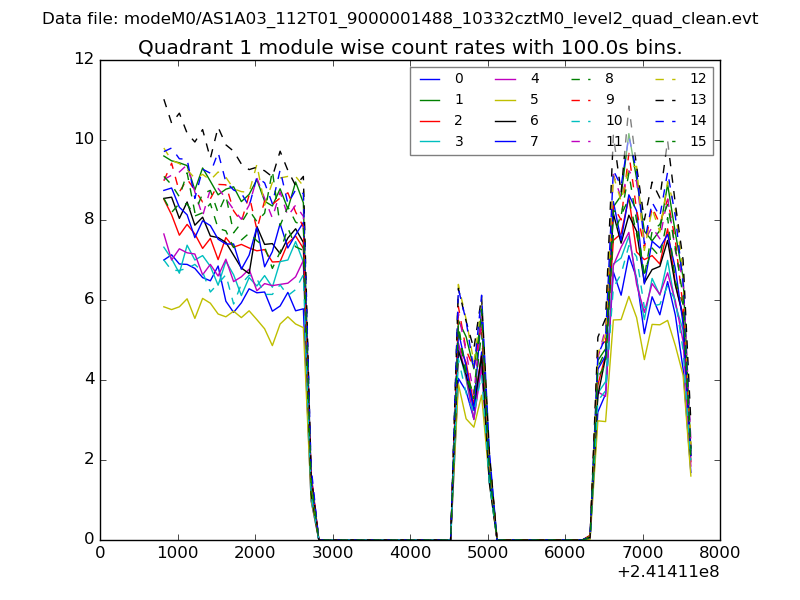
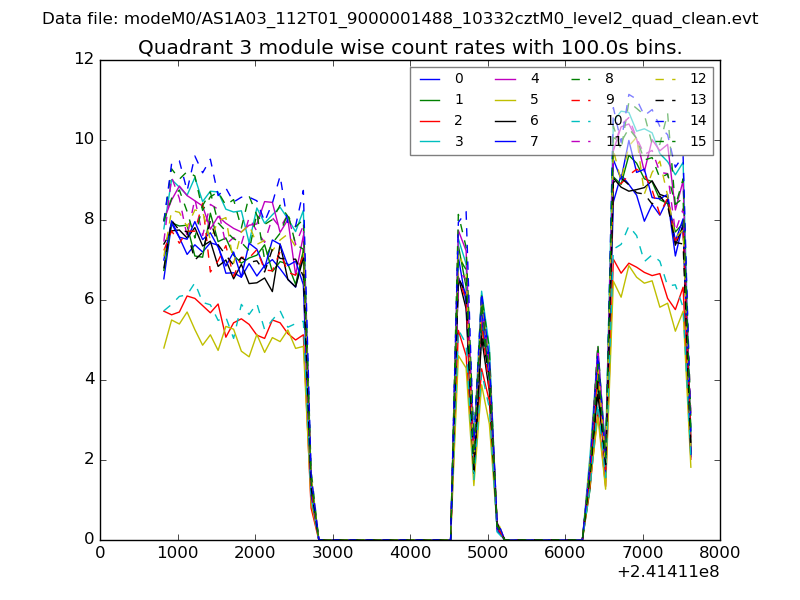
| Module-wise count rates for Quadrant A Data is divided into 100 sec bins |
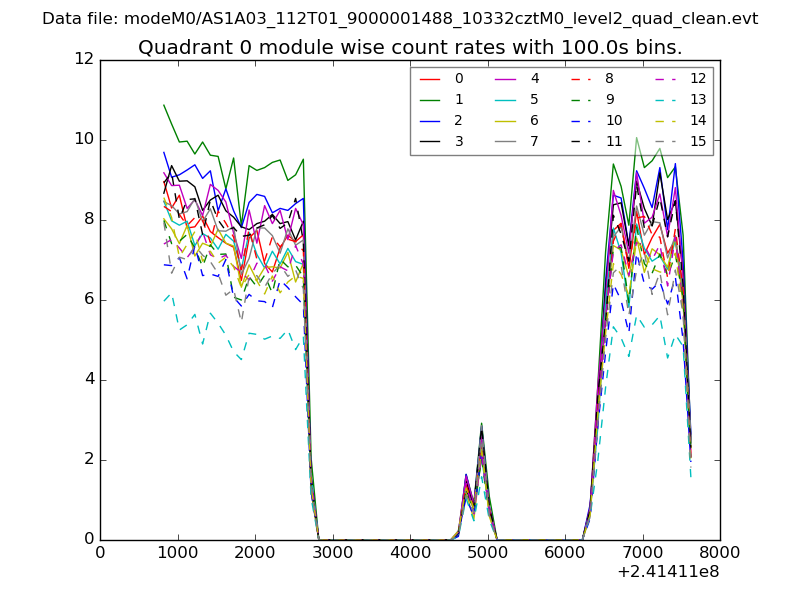 |
 |
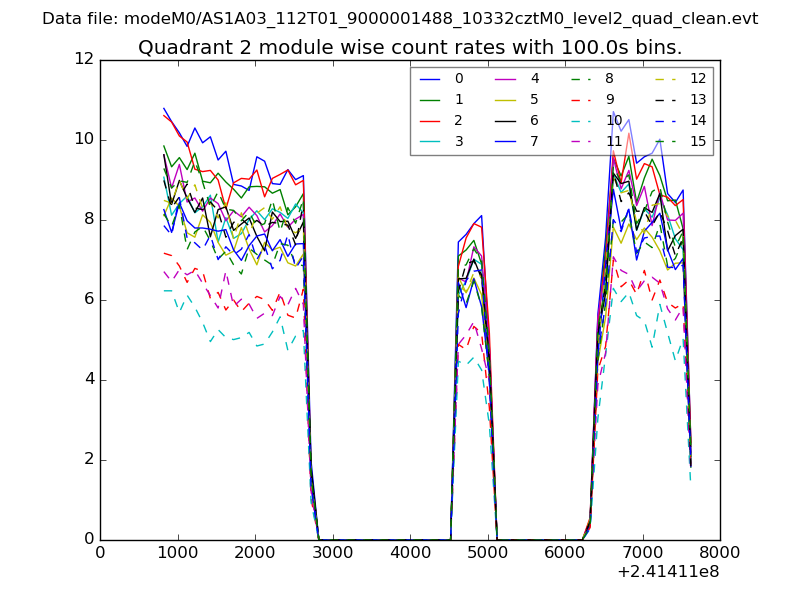
| Module-wise count rates for Quadrant B Data is divided into 100 sec bins |
 |
 |
| Module-wise count rates for Quadrant C Data is divided into 100 sec bins |
 |
 |
| Module-wise count rates for Quadrant D Data is divided into 100 sec bins |
 |
 |
| Parameter | Plot |
|---|---|
| CZT HV Monitor | 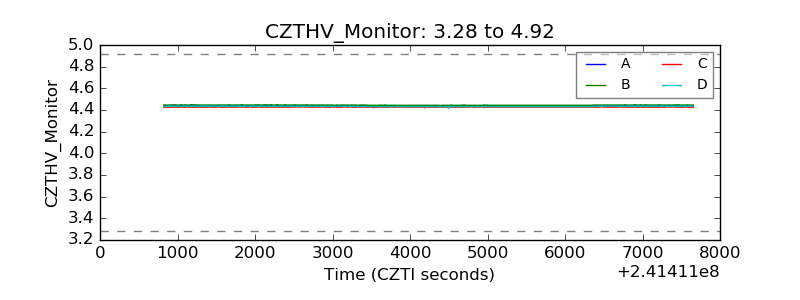 |
| D_VDD | 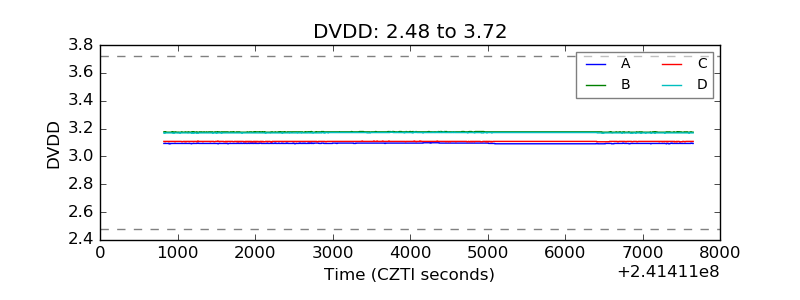 |
| Temperature 1 | 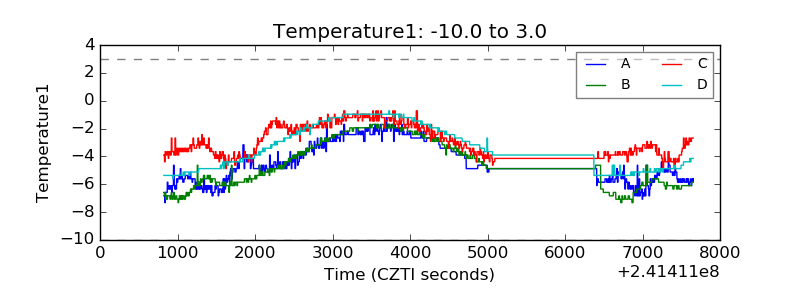 |
| Veto HV Monitor | 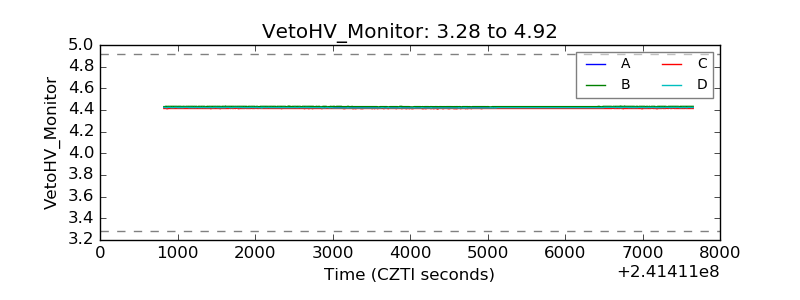 |
| Veto LLD | 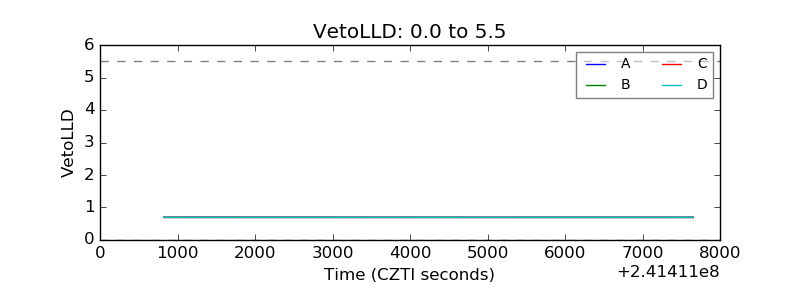 |
| Alpha Counter | 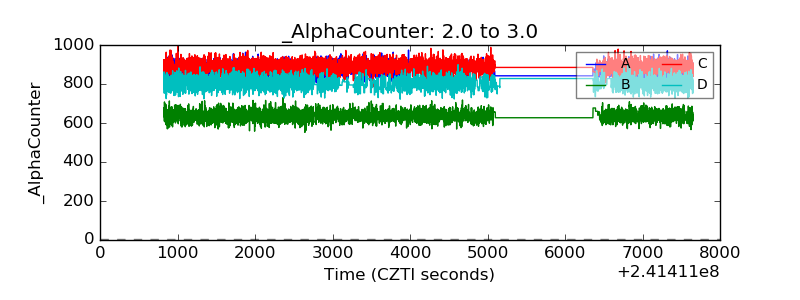 |
| _CPM_Rate | 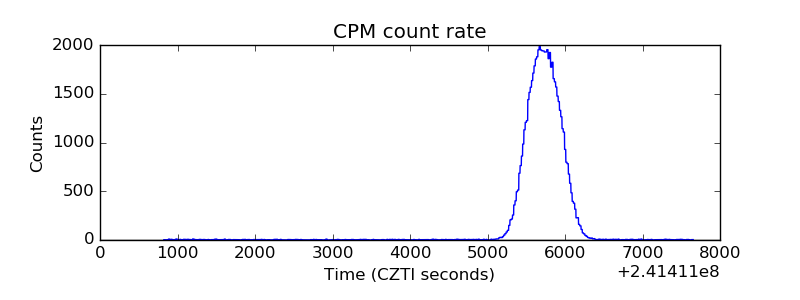 |
| CZT Counter | 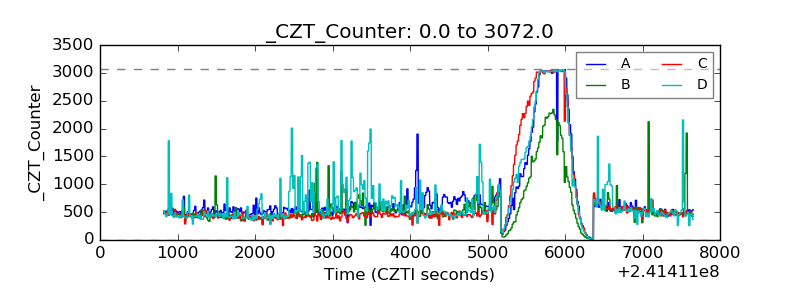 |
| +2.5 Volts monitor |  |
| +5 Volts monitor |  |
| _ROLL_ROT | 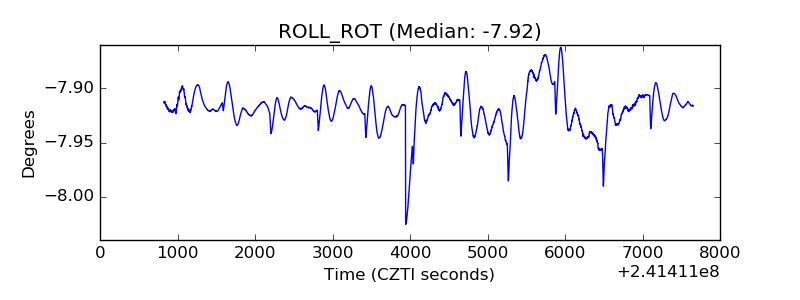 |
| _Roll_DEC | 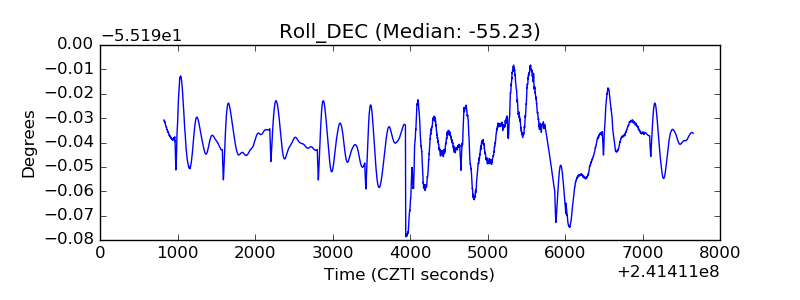 |
| _Roll_RA | 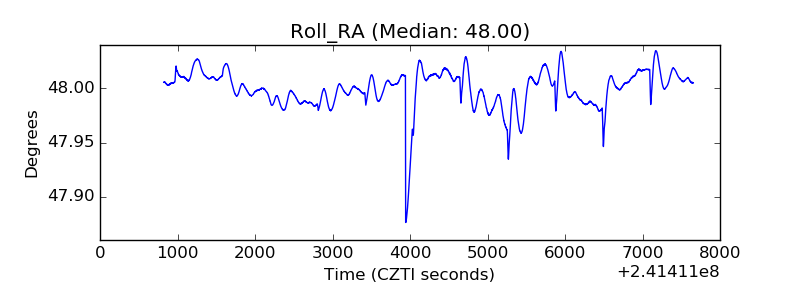 |
| Veto Counter | 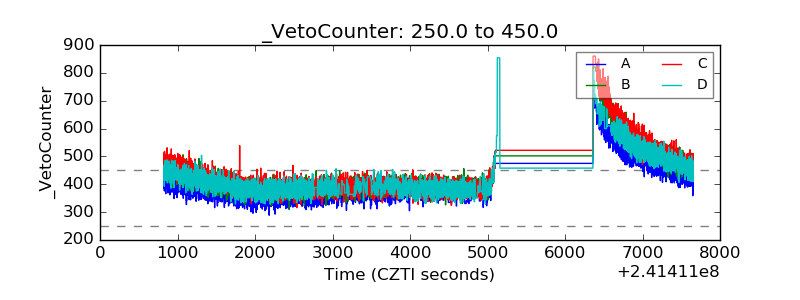 |