| Param | Original file | Final file |
|---|---|---|
| Filename | modeM0/AS1A03_112T01_9000001488_10333cztM0_level2.evt | modeM0/AS1A03_112T01_9000001488_10333cztM0_level2_quad_clean.evt |
| Size (bytes) | 374,616,000 | 79,971,840 |
| Size | 357.3 MB | 76.3 MB |
| Events in quadrant A | 2,767,264 | 488,545 |
| Events in quadrant B | 2,607,948 | 507,662 |
| Events in quadrant C | 2,522,860 | 523,970 |
| Events in quadrant D | 3,095,775 | 540,756 |
| Mode M9 | |||
|---|---|---|---|
| Quadrant | BADHDUFLAG | Total packets | Discarded packets |
| A | 0 | 23 | 10 |
| B | 0 | 26 | 13 |
| C | 0 | 26 | 13 |
| D | 0 | 20 | 7 |
| Mode SS | |||
|---|---|---|---|
| Quadrant | BADHDUFLAG | Total packets | Discarded packets |
| A | 0 | 236 | 123 |
| B | 0 | 236 | 123 |
| C | 0 | 236 | 124 |
| D | 0 | 225 | 114 |
| Mode M0 | |||
|---|---|---|---|
| Quadrant | BADHDUFLAG | Total packets | Discarded packets |
| A | 0 | 26921 | 15671 |
| B | 0 | 26569 | 15886 |
| C | 0 | 24538 | 13856 |
| D | 0 | 26994 | 14249 |
| Quadrant | Total seconds | Saturated seconds | Saturation percentage |
|---|---|---|---|
| A | 4842 | 37 | 0.764147% |
| B | 4917 | 49 | 0.996543% |
| C | 5114 | 33 | 0.645287% |
| D | 5710 | 45 | 0.788091% |
Noise dominated data is calculated using 1-second bins in cleaned event files. If a bin has >2000 counts, and if more than 50% of those come from <1% of pixels, then it is considered to be noise-dominated and hence unusable.
| Quadrant | # 1 sec bins | Bins with >0 counts | Bins with >2000 counts | High rate bins dominated by noise | Noise dominated (total time) | Noise dominated (detector-on time) | Marked lightcurve |
|---|---|---|---|---|---|---|---|
| A | 7380 | 5726 | 0 | 0 | 0.00% | 0.00% | 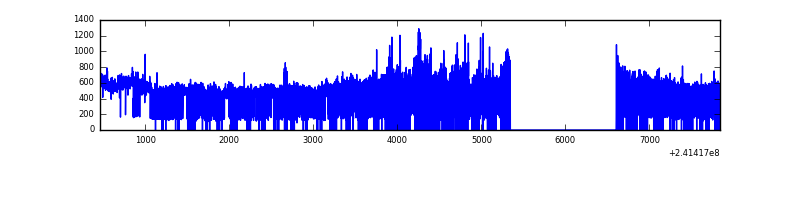 |
| B | 7380 | 5751 | 0 | 0 | 0.00% | 0.00% | 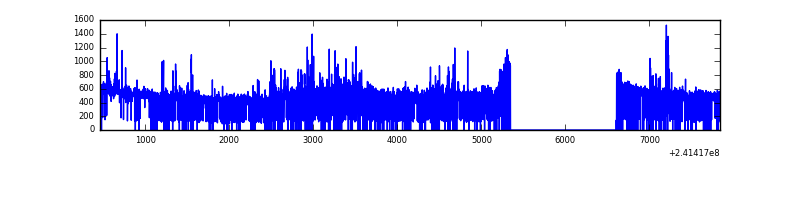 |
| C | 7380 | 5897 | 0 | 0 | 0.00% | 0.00% | 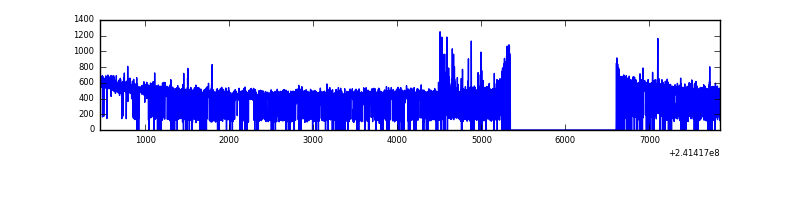 |
| D | 7380 | 5945 | 1 | 1 | 0.01% | 0.02% | 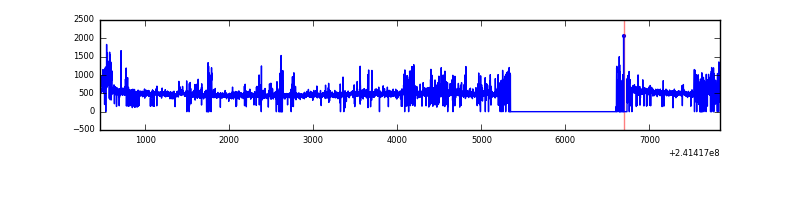 |
Top three noisy pixels from each quadrant. If the there are fewer than three noisy pixels in the level2.evt file, extra rows are filled as -1
| Pixel properties | Quadrant properties | ||||||
|---|---|---|---|---|---|---|---|
| Quadrant | DetID | PixID | Counts | Sigma | Mean | Median | Sigma |
| A | 8 | 15 | 351685 | 2908.17 | 604 | 593 | 120.7 |
| A | 13 | 251 | 72934 | 599.22 | 604 | 593 | 120.7 |
| A | 3 | 1 | 7944 | 60.89 | 604 | 593 | 120.7 |
| B | 4 | 239 | 70454 | 608.27 | 615 | 602 | 114.8 |
| B | 11 | 51 | 52193 | 449.26 | 615 | 602 | 114.8 |
| B | 0 | 214 | 33739 | 288.56 | 615 | 602 | 114.8 |
| C | 4 | 254 | 35622 | 239.49 | 636 | 641 | 146.1 |
| C | 14 | 234 | 5747 | 34.96 | 636 | 641 | 146.1 |
| C | 13 | 61 | 4710 | 27.86 | 636 | 641 | 146.1 |
| D | 1 | 52 | 222503 | 1331.94 | 702 | 685 | 166.5 |
| D | 5 | 222 | 51621 | 305.85 | 702 | 685 | 166.5 |
| D | 8 | 195 | 46842 | 277.16 | 702 | 685 | 166.5 |
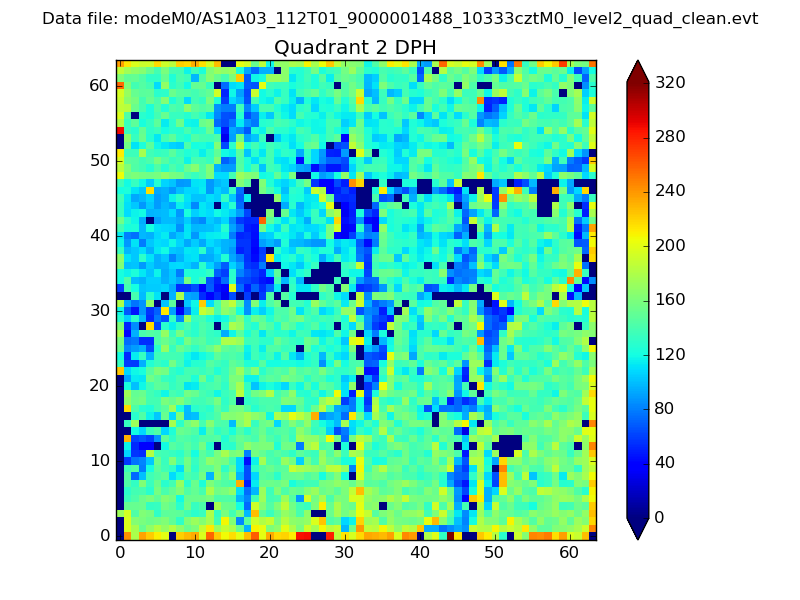
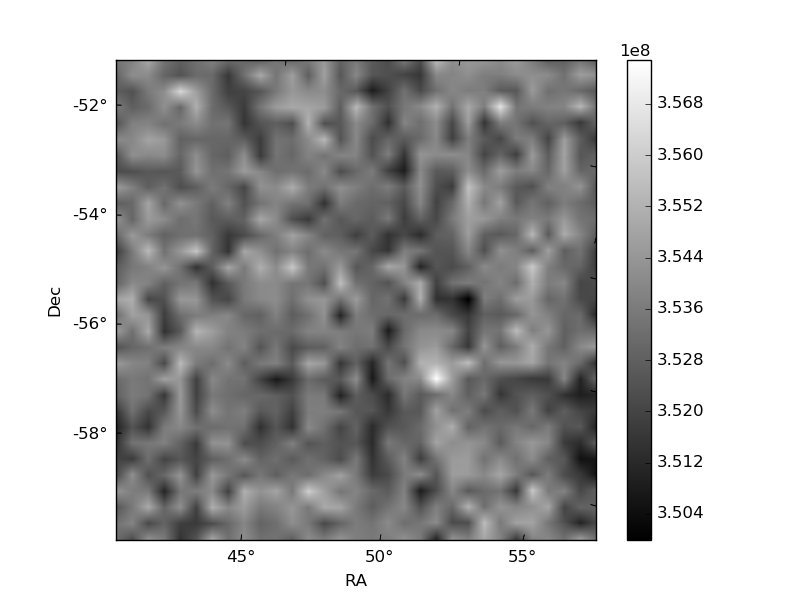
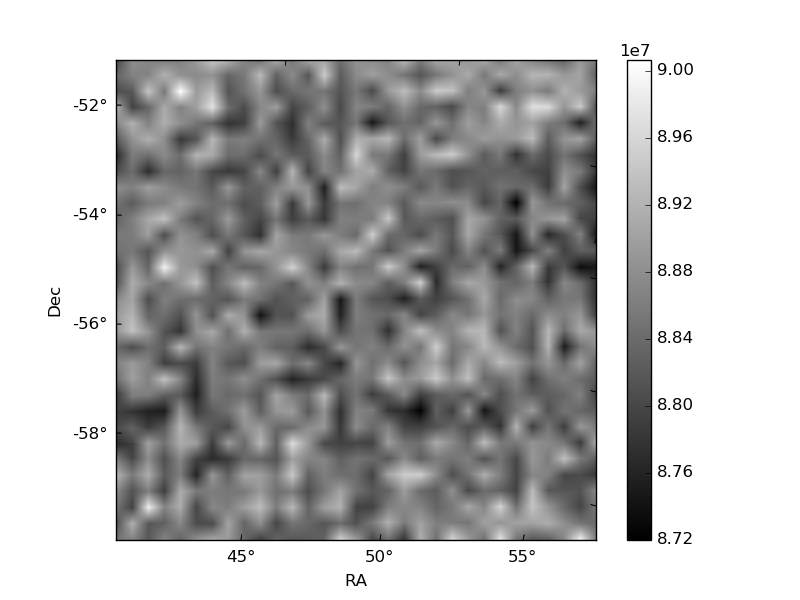
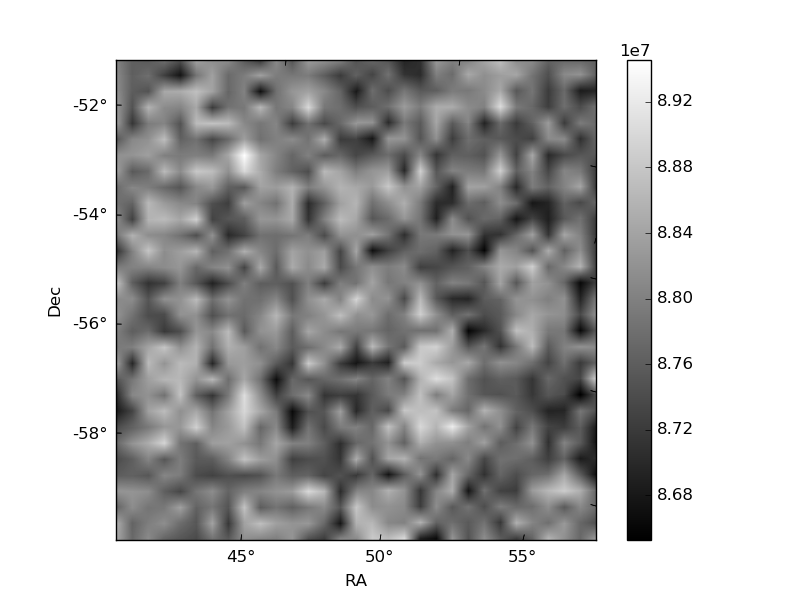
Histogram calculated using DETX and DETY for each event in the final _common_clean file
| Quadrant A | 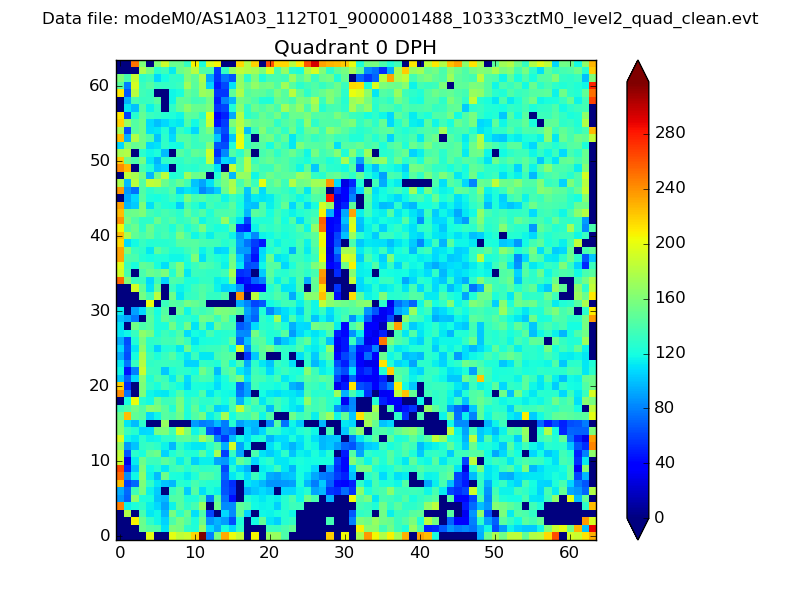 |
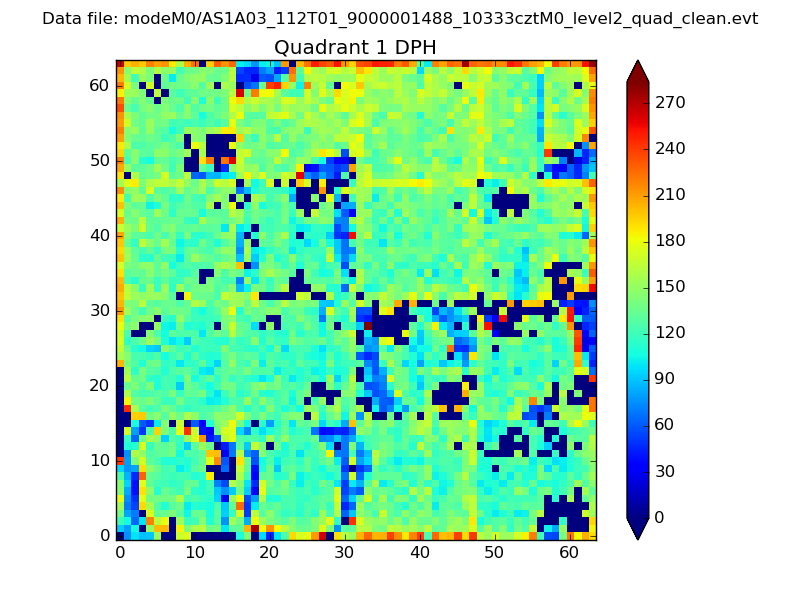 |
Quadrant B |
|---|---|---|---|
| Quadrant D | 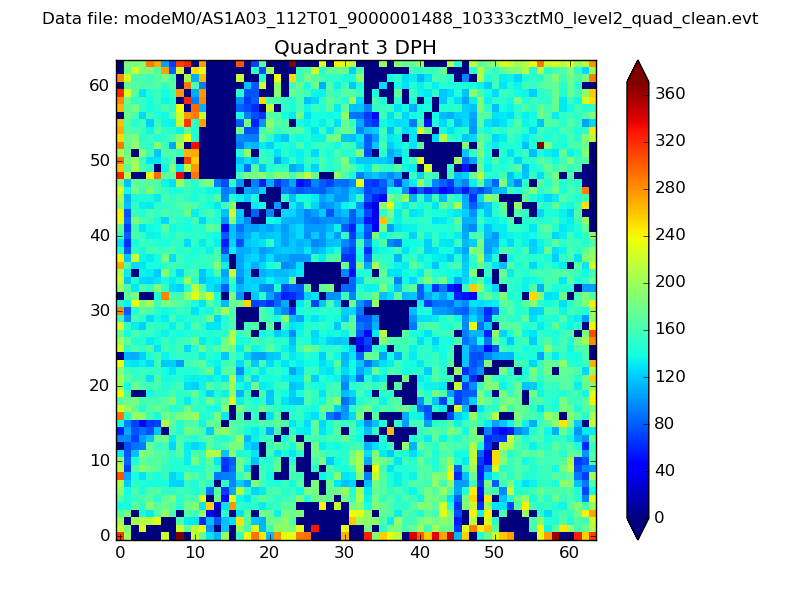 |
 |
Quadrant C |
| Plot type | Count rate plots | Images |
|---|---|---|
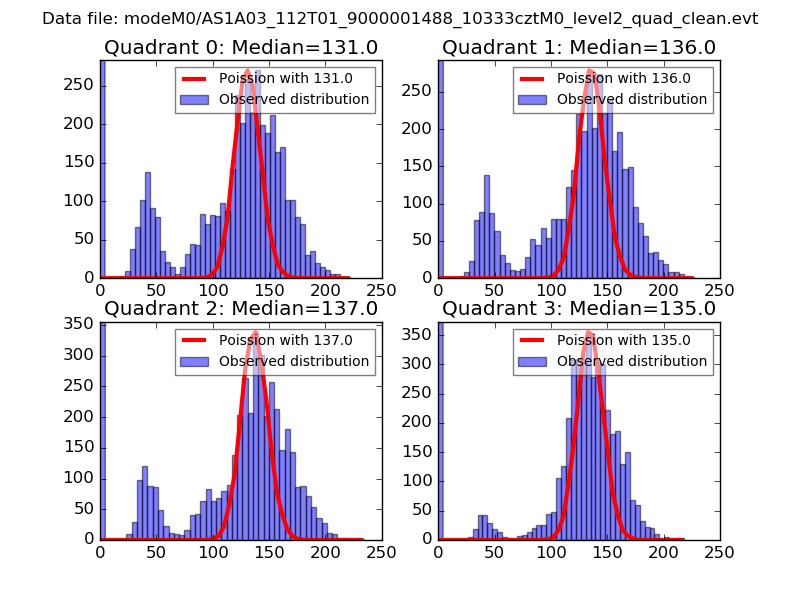
| Comparison with Poisson distribution Blue bars denote a histogram of data divided into 1 sec bins. Red curve is a Poisson curve with rate = median count rate of data. |
 |
 |
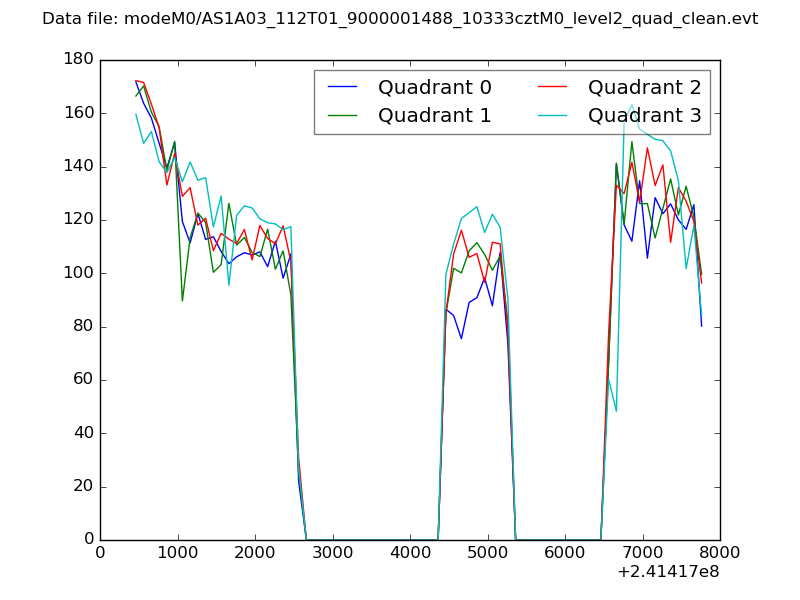
| Quadrant-wise count rates Data is divided into 100 sec bins |
 |
|
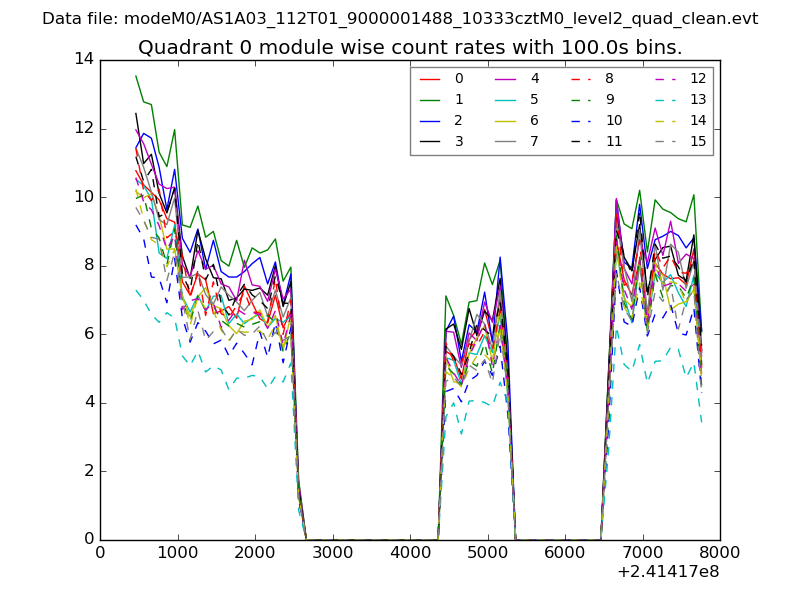
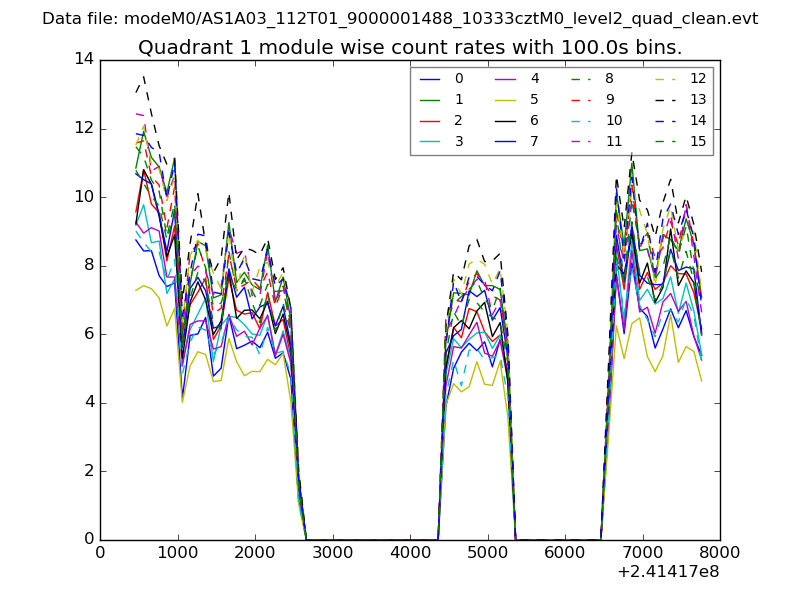
| Module-wise count rates for Quadrant A Data is divided into 100 sec bins |
 |
 |
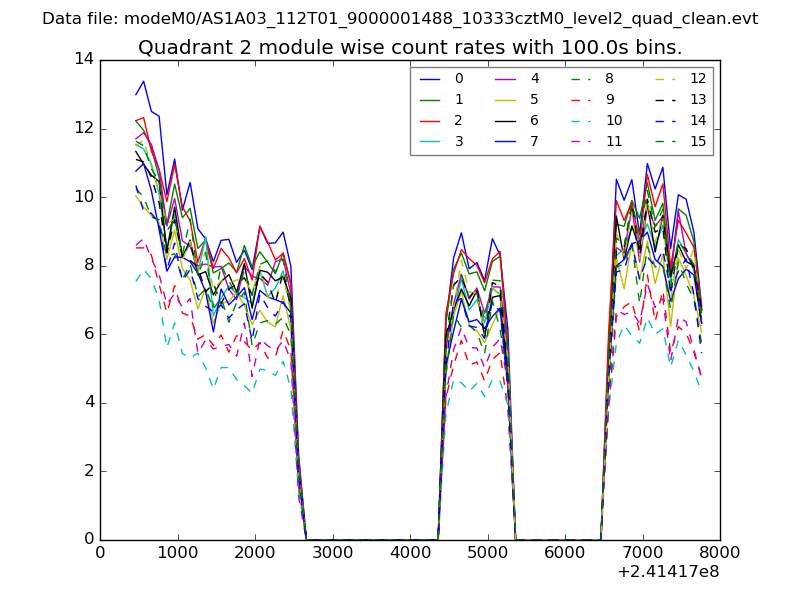
| Module-wise count rates for Quadrant B Data is divided into 100 sec bins |
 |
 |
| Module-wise count rates for Quadrant C Data is divided into 100 sec bins |
 |
 |
| Module-wise count rates for Quadrant D Data is divided into 100 sec bins |
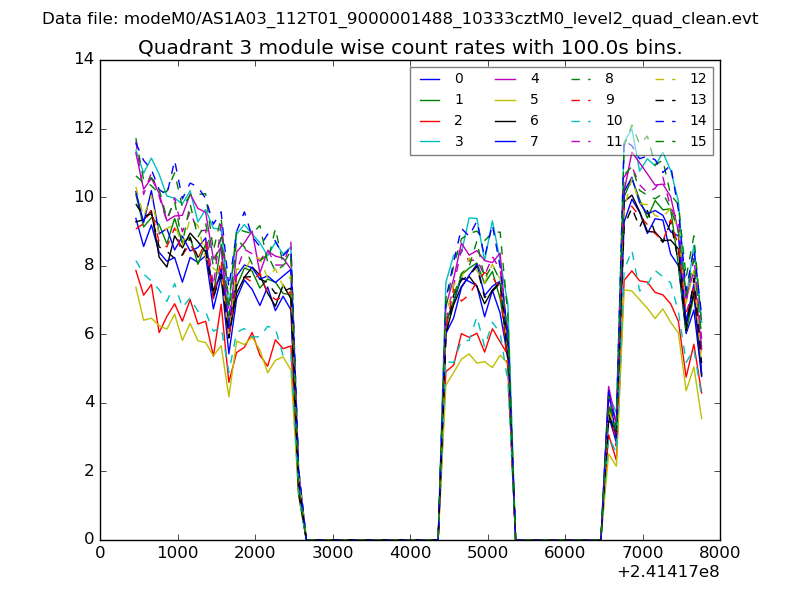 |
 |
| Parameter | Plot |
|---|---|
| CZT HV Monitor | 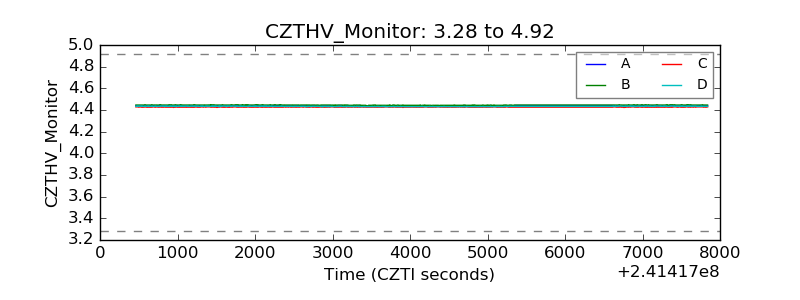 |
| D_VDD | 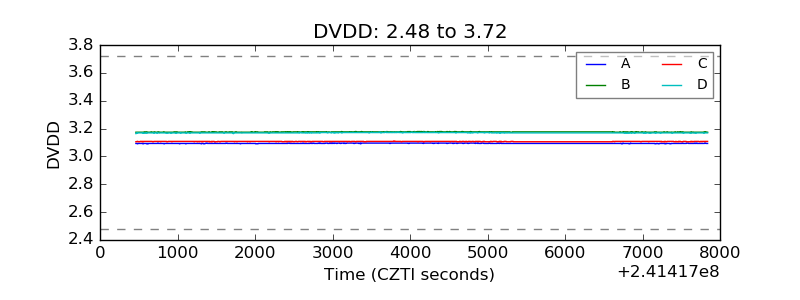 |
| Temperature 1 | 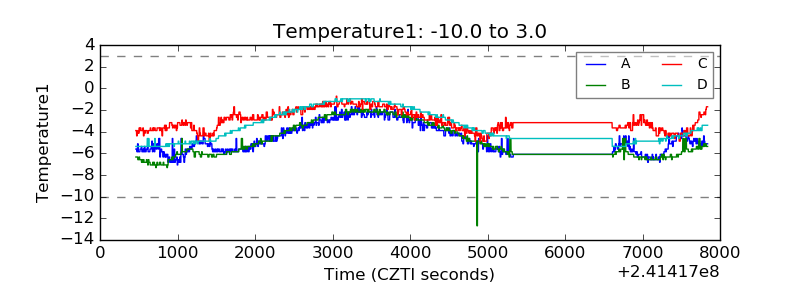 |
| Veto HV Monitor | 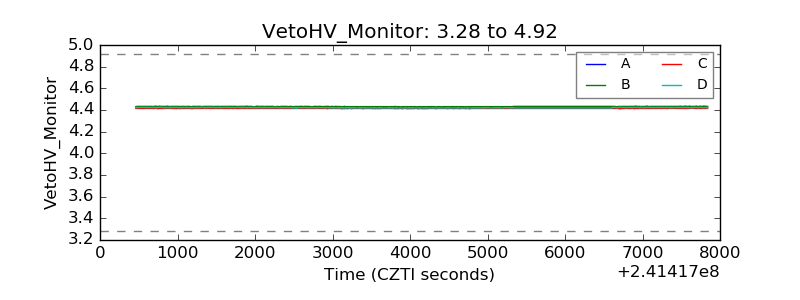 |
| Veto LLD | 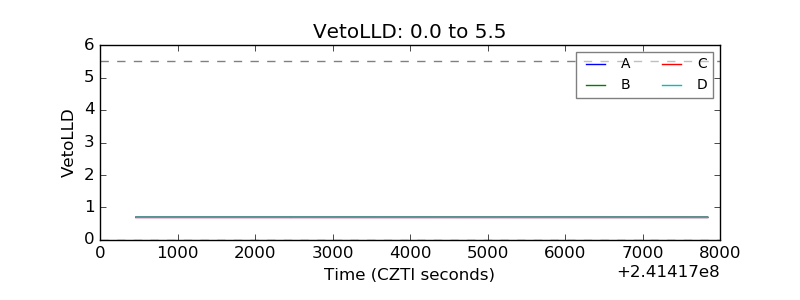 |
| Alpha Counter | 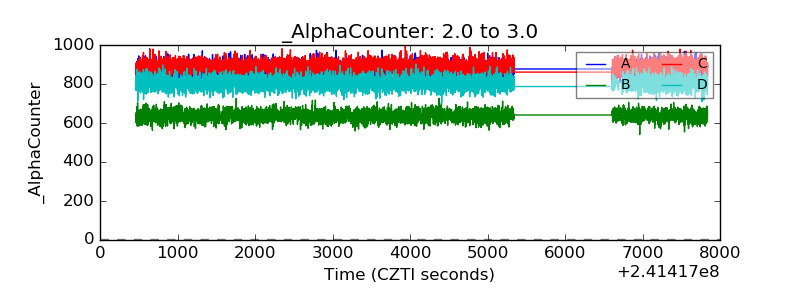 |
| _CPM_Rate | 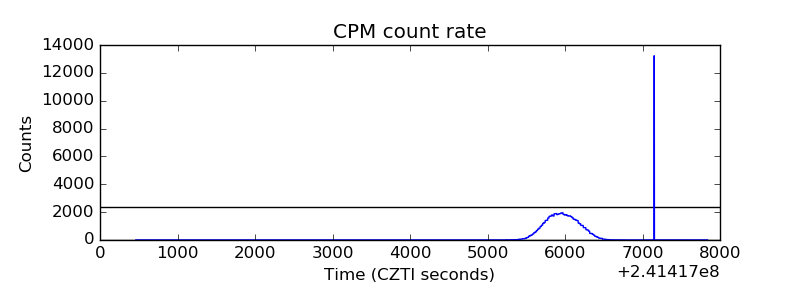 |
| CZT Counter | 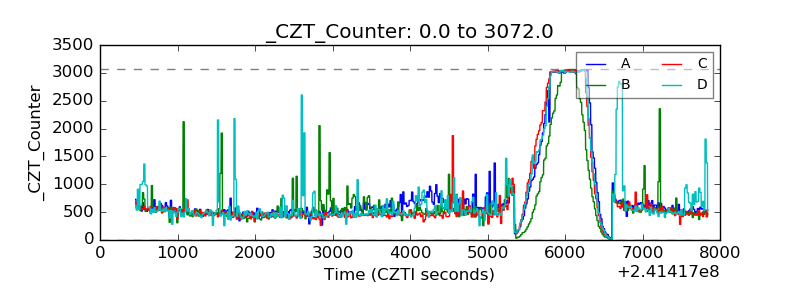 |
| +2.5 Volts monitor |  |
| +5 Volts monitor |  |
| _ROLL_ROT | 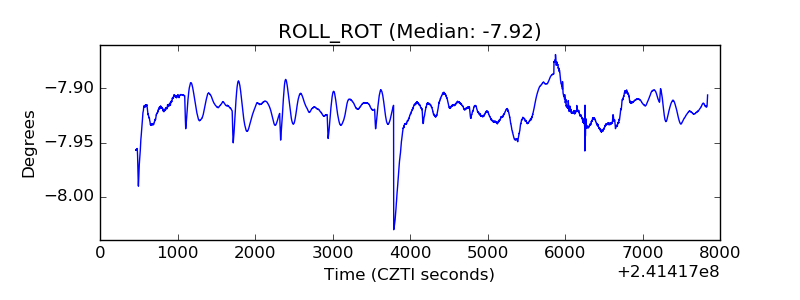 |
| _Roll_DEC | 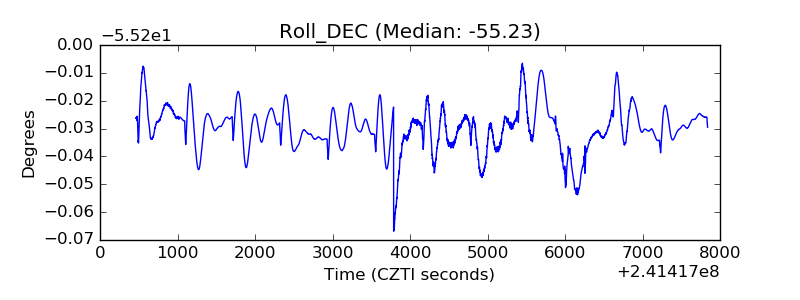 |
| _Roll_RA | 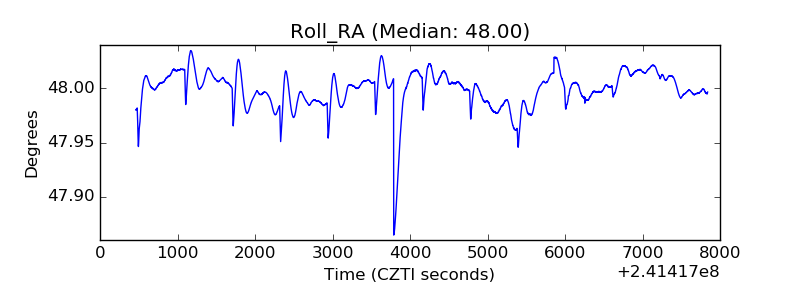 |
| Veto Counter | 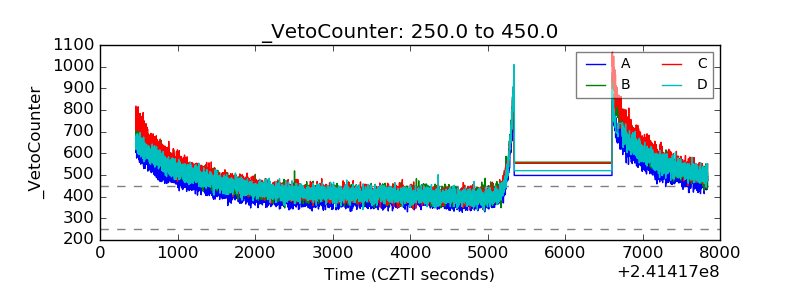 |