| Param | Original file | Final file |
|---|---|---|
| Filename | modeM0/AS1A03_112T01_9000001488_10335cztM0_level2.evt | modeM0/AS1A03_112T01_9000001488_10335cztM0_level2_quad_clean.evt |
| Size (bytes) | 260,199,360 | 49,144,320 |
| Size | 248.1 MB | 46.9 MB |
| Events in quadrant A | 1,930,587 | 283,493 |
| Events in quadrant B | 1,832,733 | 309,294 |
| Events in quadrant C | 1,751,125 | 311,641 |
| Events in quadrant D | 2,110,621 | 320,672 |
| Mode SS | |||
|---|---|---|---|
| Quadrant | BADHDUFLAG | Total packets | Discarded packets |
| A | 0 | 174 | 92 |
| B | 0 | 174 | 89 |
| C | 0 | 174 | 93 |
| D | 0 | 166 | 84 |
| Mode M0 | |||
|---|---|---|---|
| Quadrant | BADHDUFLAG | Total packets | Discarded packets |
| A | 0 | 18639 | 10878 |
| B | 0 | 18224 | 10643 |
| C | 0 | 17370 | 9778 |
| D | 0 | 20218 | 11649 |
| Quadrant | Total seconds | Saturated seconds | Saturation percentage |
|---|---|---|---|
| A | 3518 | 4 | 0.113701% |
| B | 3657 | 1 | 0.027345% |
| C | 3751 | 3 | 0.079979% |
| D | 3909 | 3 | 0.076746% |
Noise dominated data is calculated using 1-second bins in cleaned event files. If a bin has >2000 counts, and if more than 50% of those come from <1% of pixels, then it is considered to be noise-dominated and hence unusable.
| Quadrant | # 1 sec bins | Bins with >0 counts | Bins with >2000 counts | High rate bins dominated by noise | Noise dominated (total time) | Noise dominated (detector-on time) | Marked lightcurve |
|---|---|---|---|---|---|---|---|
| A | 4443 | 4175 | 0 | 0 | 0.00% | 0.00% | 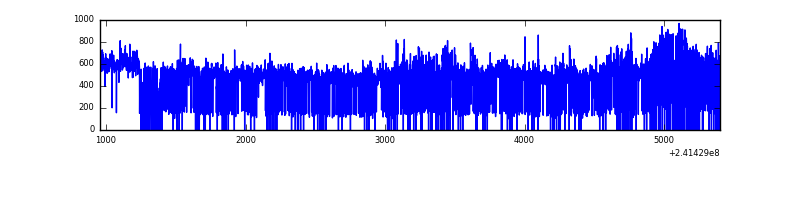 |
| B | 4442 | 4263 | 0 | 0 | 0.00% | 0.00% | 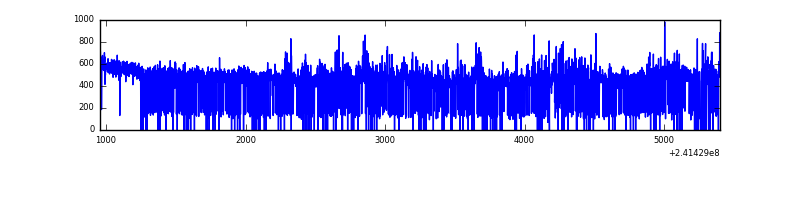 |
| C | 4443 | 4324 | 0 | 0 | 0.00% | 0.00% | 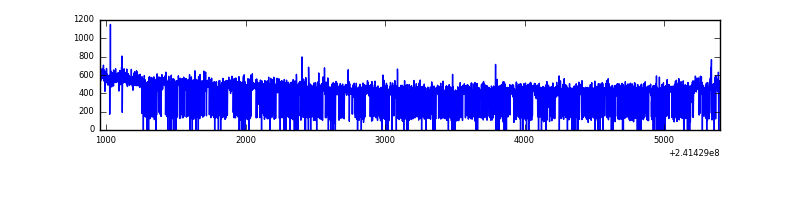 |
| D | 4443 | 4180 | 0 | 0 | 0.00% | 0.00% | 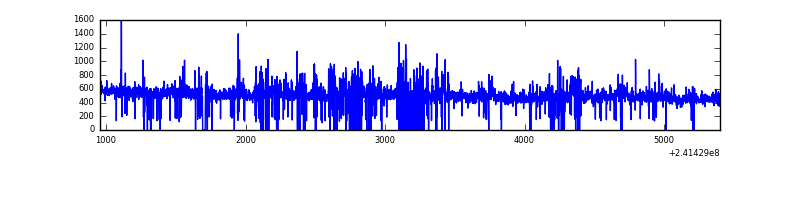 |
Top three noisy pixels from each quadrant. If the there are fewer than three noisy pixels in the level2.evt file, extra rows are filled as -1
| Pixel properties | Quadrant properties | ||||||
|---|---|---|---|---|---|---|---|
| Quadrant | DetID | PixID | Counts | Sigma | Mean | Median | Sigma |
| A | 8 | 15 | 234515 | 2706.85 | 428 | 420 | 86.5 |
| A | 13 | 251 | 42491 | 486.47 | 428 | 420 | 86.5 |
| A | 0 | 226 | 3951 | 40.83 | 428 | 420 | 86.5 |
| B | 11 | 51 | 56230 | 673.06 | 443 | 435 | 82.9 |
| B | 4 | 239 | 24602 | 291.53 | 443 | 435 | 82.9 |
| B | 0 | 219 | 14848 | 173.86 | 443 | 435 | 82.9 |
| C | 14 | 234 | 3516 | 29.99 | 447 | 450 | 102.2 |
| C | 13 | 61 | 3192 | 26.82 | 447 | 450 | 102.2 |
| C | 4 | 254 | 2553 | 20.57 | 447 | 450 | 102.2 |
| D | 1 | 20 | 133892 | 1219.67 | 465 | 454 | 109.4 |
| D | 1 | 52 | 95159 | 865.63 | 465 | 454 | 109.4 |
| D | 8 | 195 | 53543 | 485.25 | 465 | 454 | 109.4 |
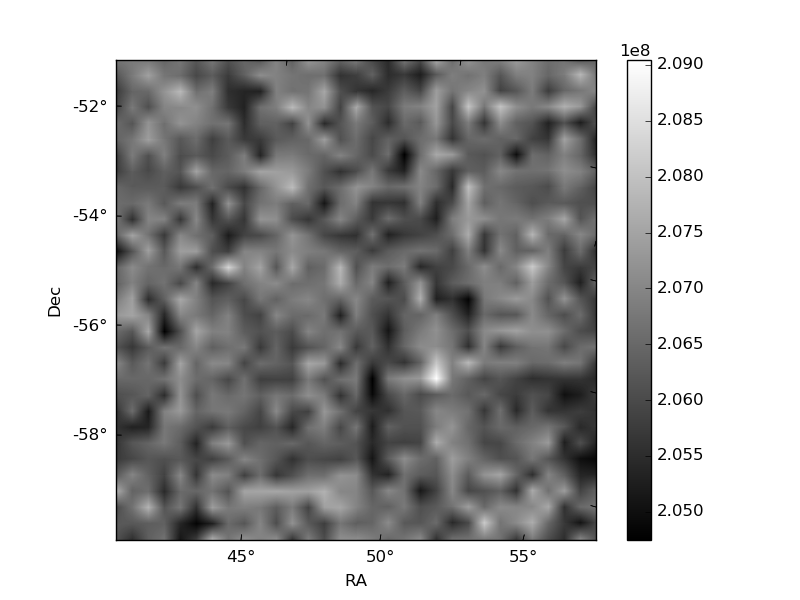
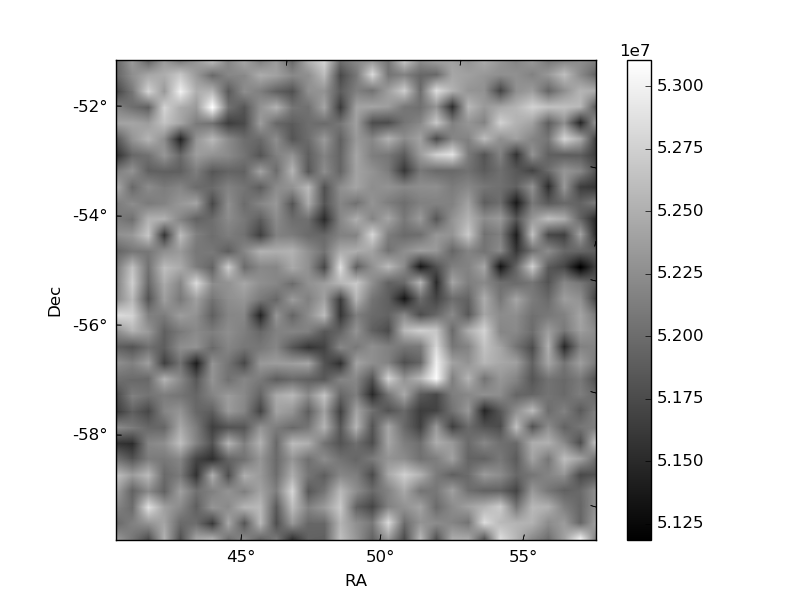
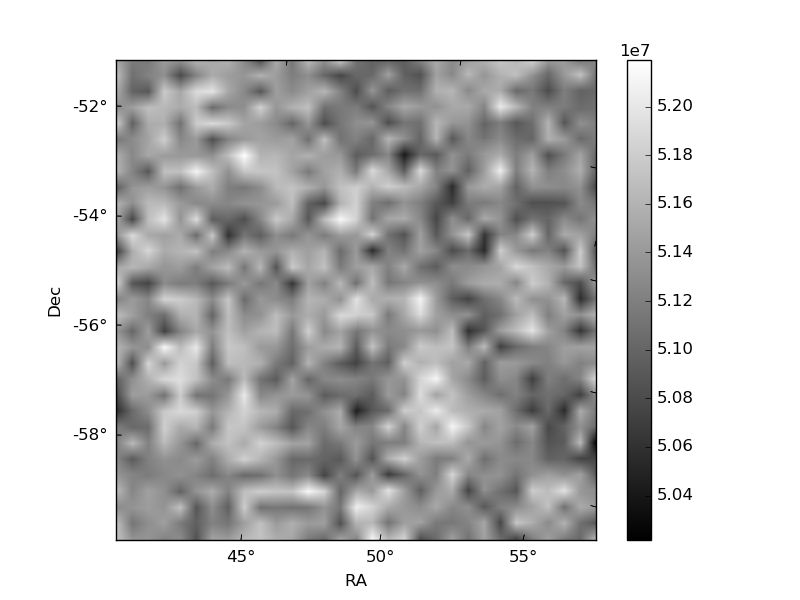
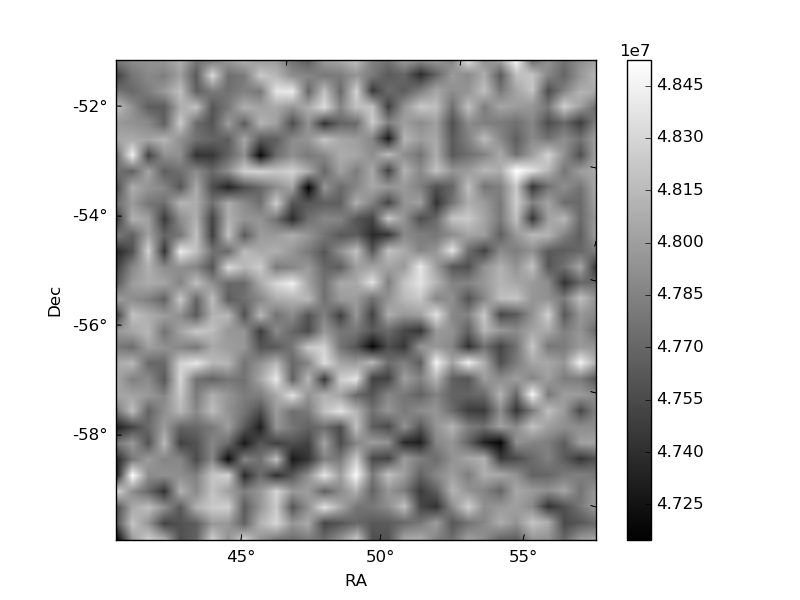
Histogram calculated using DETX and DETY for each event in the final _common_clean file
| Quadrant A | 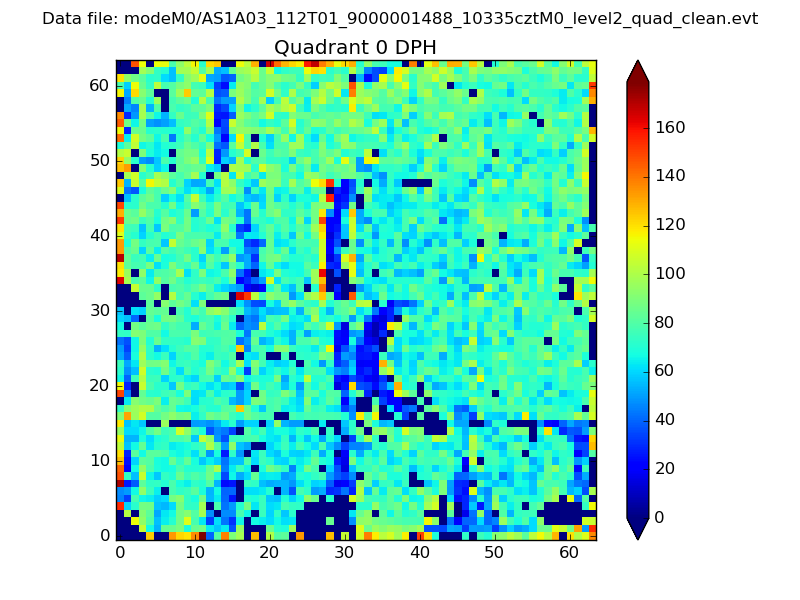 |
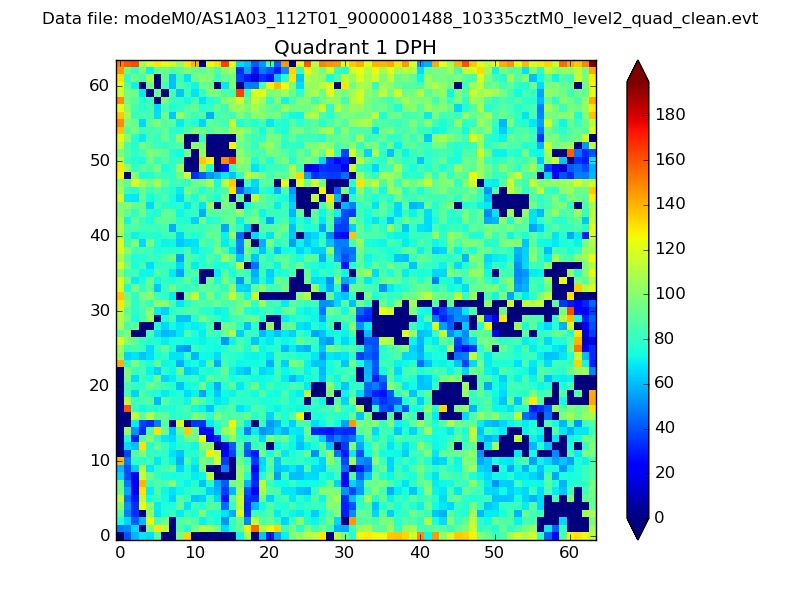 |
Quadrant B |
|---|---|---|---|
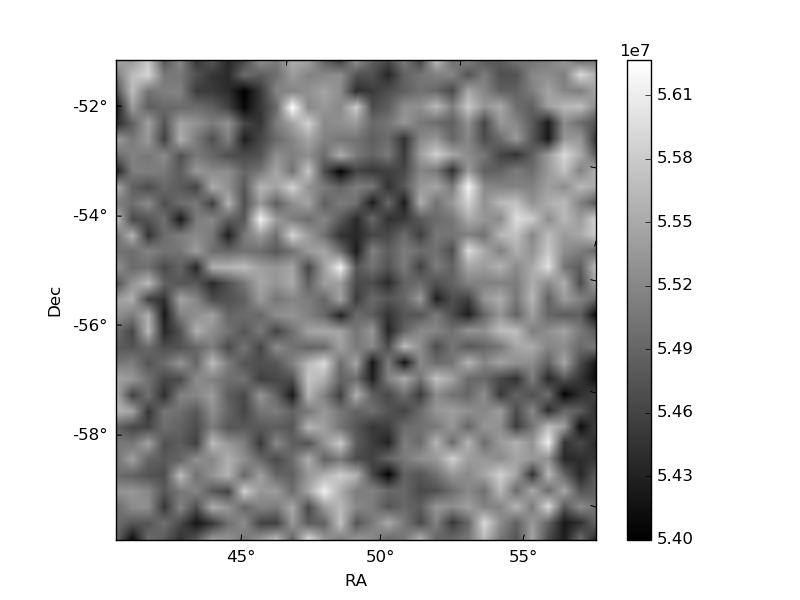
| Quadrant D | 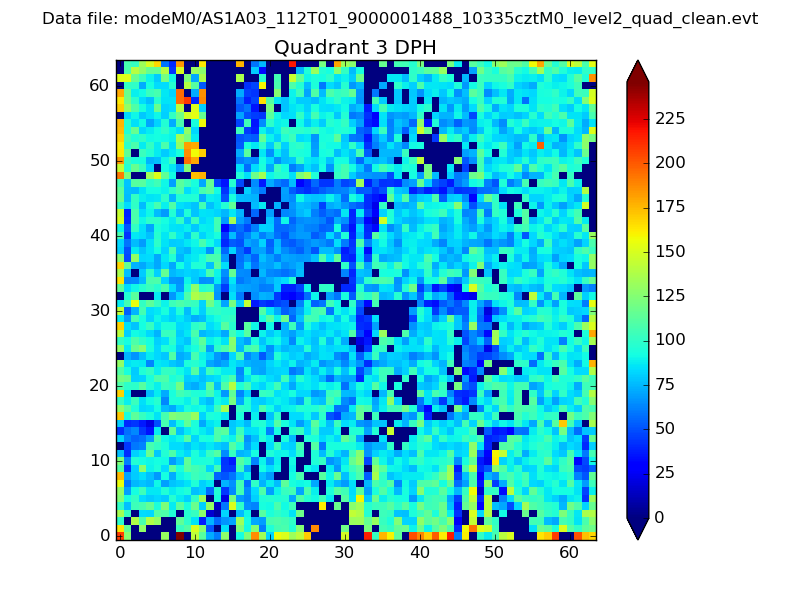 |
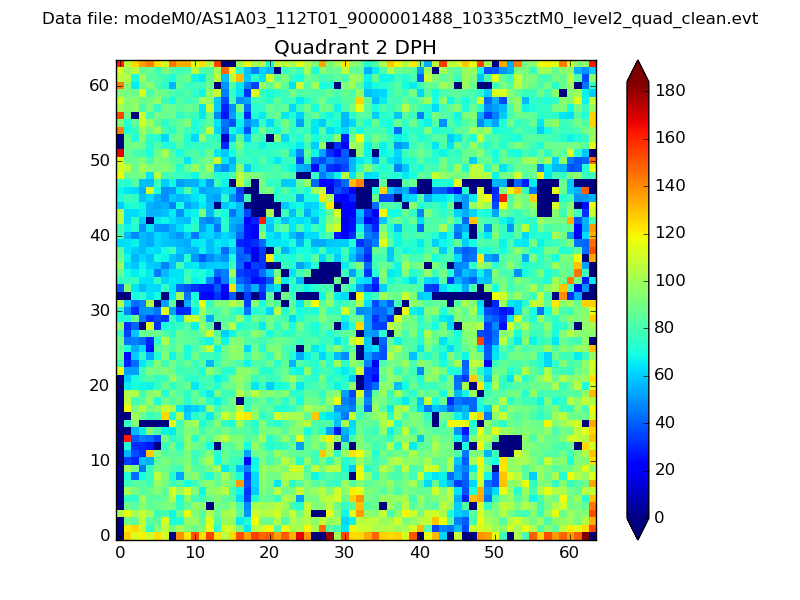 |
Quadrant C |
| Plot type | Count rate plots | Images |
|---|---|---|
| Comparison with Poisson distribution Blue bars denote a histogram of data divided into 1 sec bins. Red curve is a Poisson curve with rate = median count rate of data. |
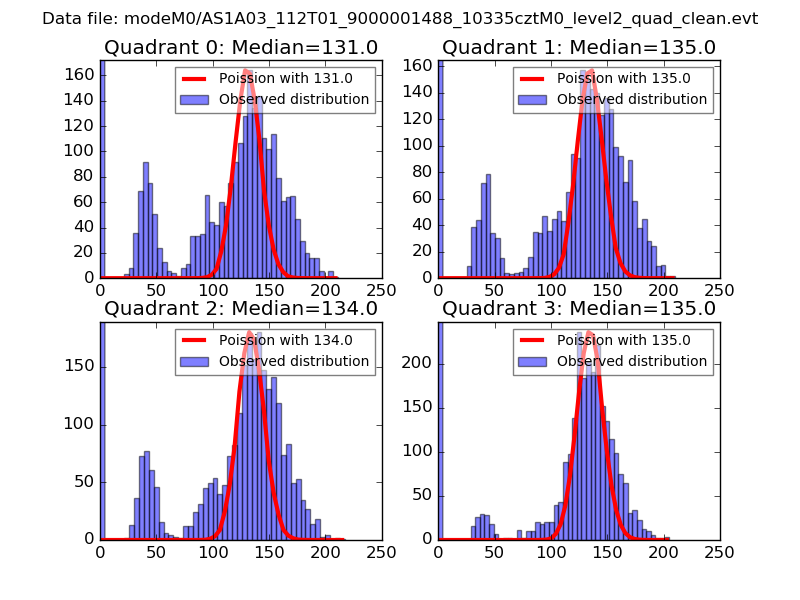 |
 |
| Quadrant-wise count rates Data is divided into 100 sec bins |
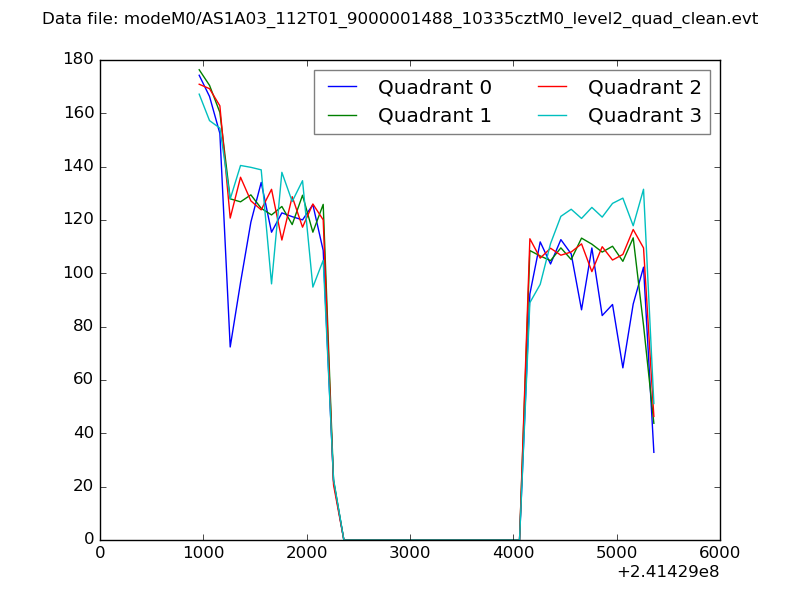 |
|
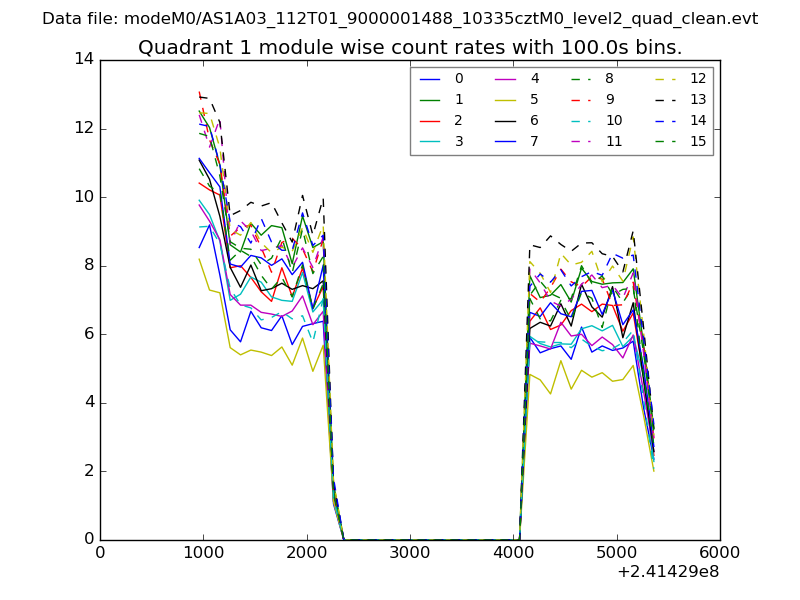
| Module-wise count rates for Quadrant A Data is divided into 100 sec bins |
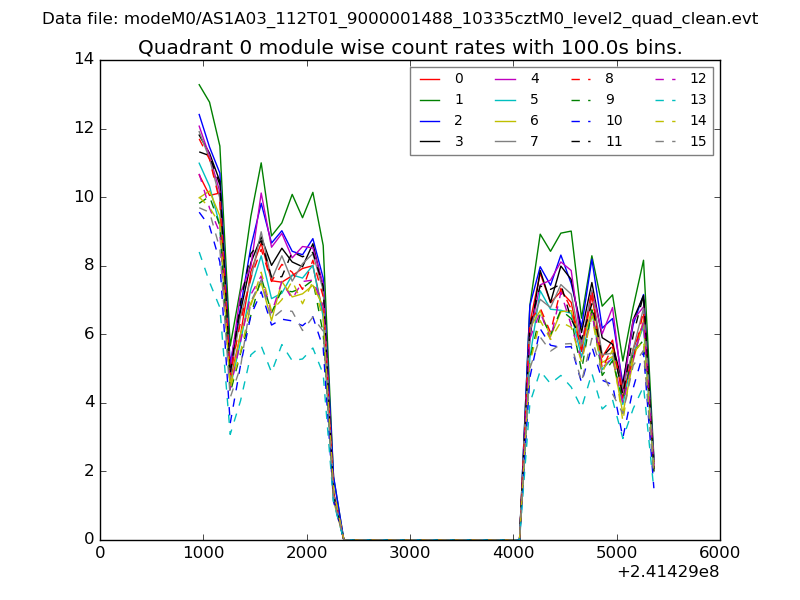 |
 |
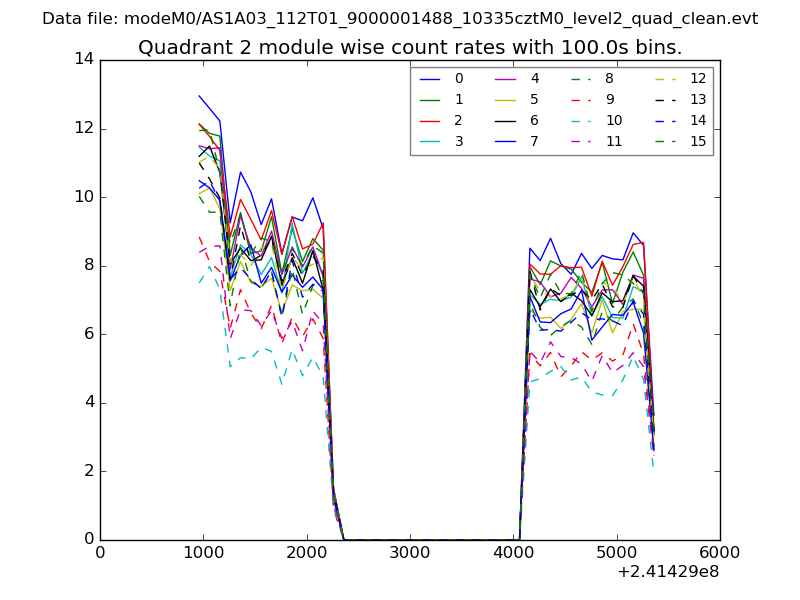
| Module-wise count rates for Quadrant B Data is divided into 100 sec bins |
 |
 |
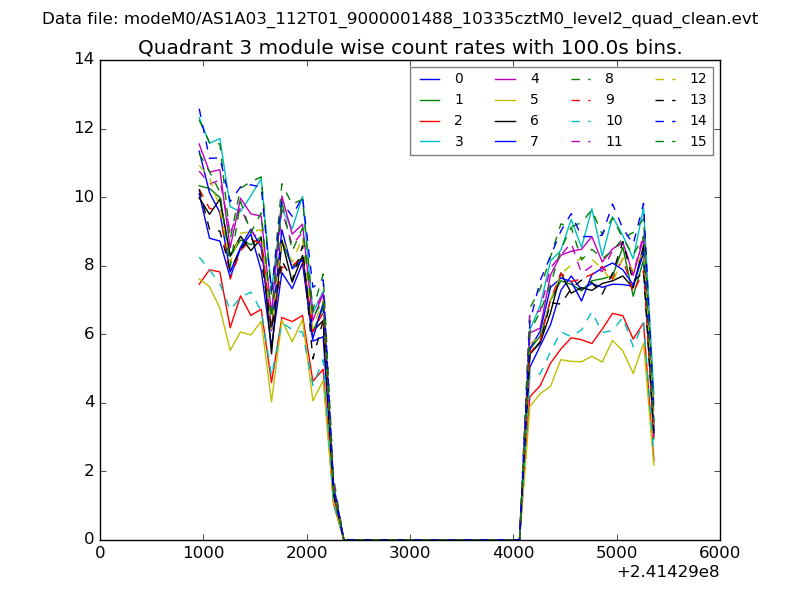
| Module-wise count rates for Quadrant C Data is divided into 100 sec bins |
 |
 |
| Module-wise count rates for Quadrant D Data is divided into 100 sec bins |
 |
 |
| Parameter | Plot |
|---|---|
| CZT HV Monitor | 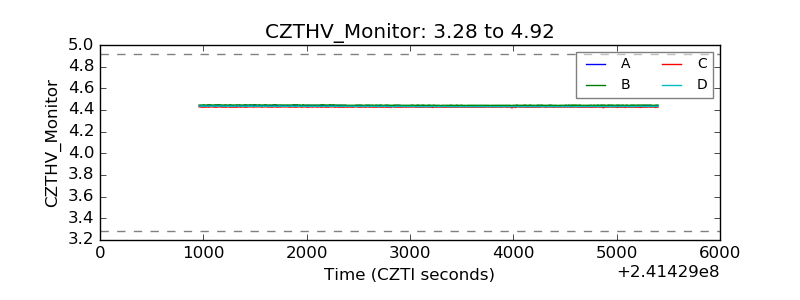 |
| D_VDD |  |
| Temperature 1 | 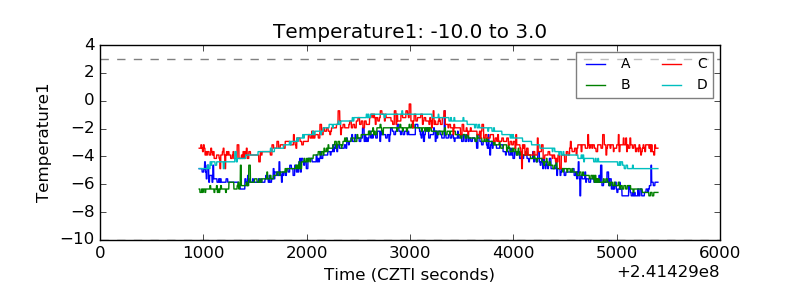 |
| Veto HV Monitor | 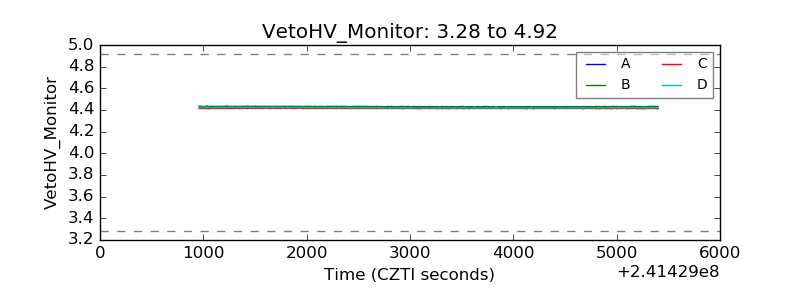 |
| Veto LLD | 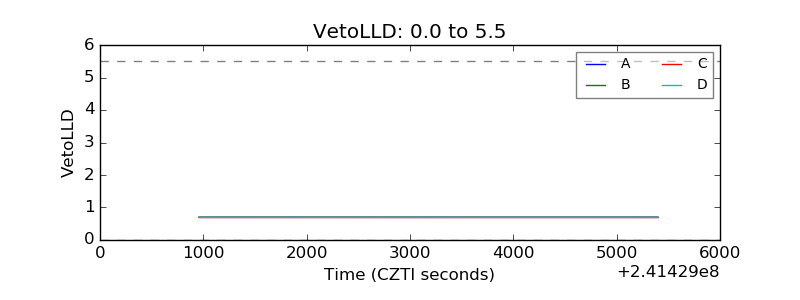 |
| Alpha Counter | 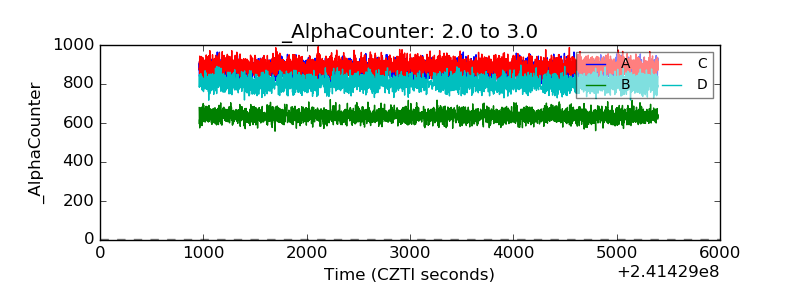 |
| _CPM_Rate | 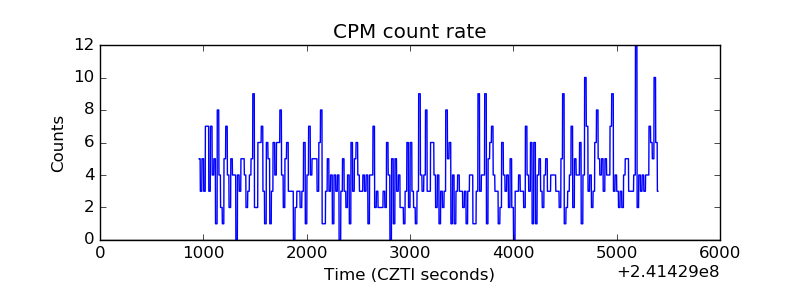 |
| CZT Counter | 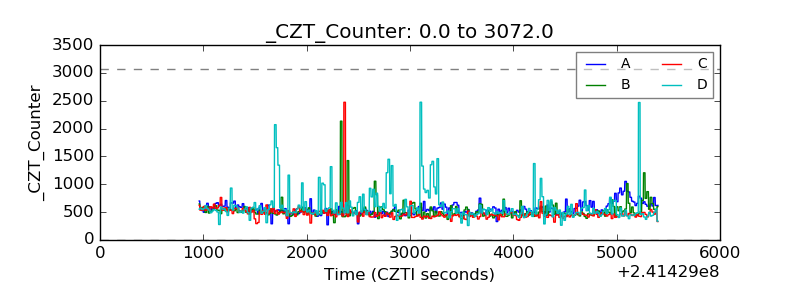 |
| +2.5 Volts monitor |  |
| +5 Volts monitor | 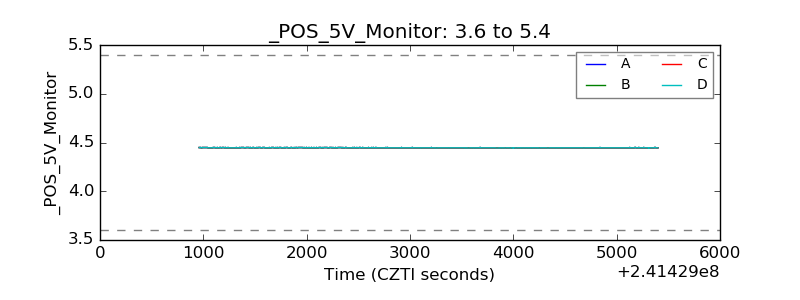 |
| _ROLL_ROT | 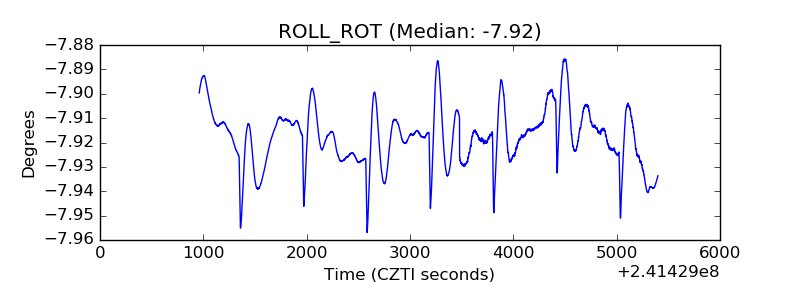 |
| _Roll_DEC | 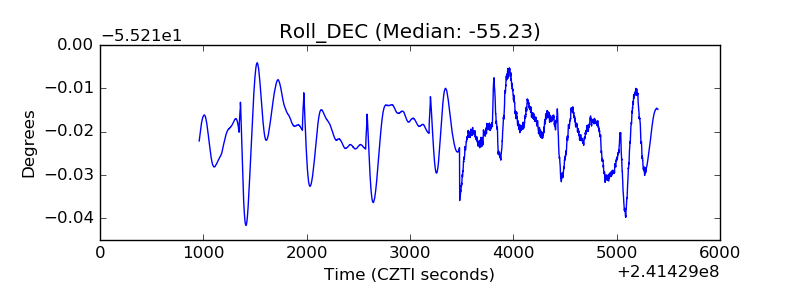 |
| _Roll_RA | 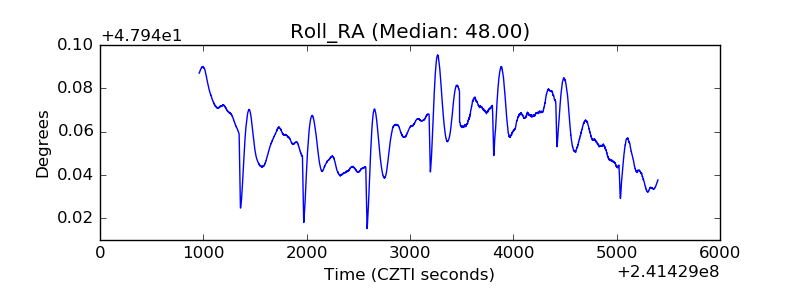 |
| Veto Counter | 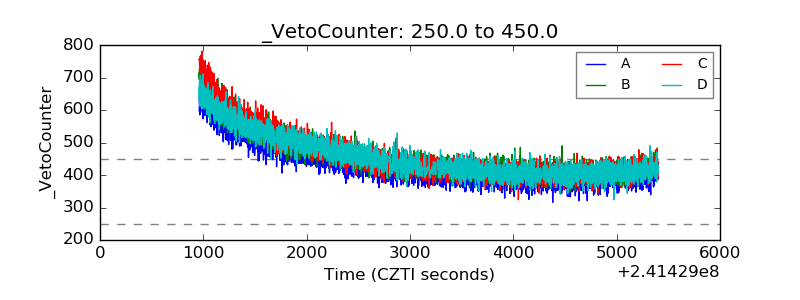 |