| Param | Original file | Final file |
|---|---|---|
| Filename | modeM0/AS1C02_038T02_9000001490_10335cztM0_level2.evt | modeM0/AS1C02_038T02_9000001490_10335cztM0_level2_quad_clean.evt |
| Size (bytes) | 76,619,520 | 11,551,680 |
| Size | 73.1 MB | 11.0 MB |
| Events in quadrant A | 566,081 | 58,661 |
| Events in quadrant B | 534,423 | 70,023 |
| Events in quadrant C | 538,591 | 67,806 |
| Events in quadrant D | 608,671 | 74,471 |
| Mode M9 | |||
|---|---|---|---|
| Quadrant | BADHDUFLAG | Total packets | Discarded packets |
| A | 0 | 24 | 11 |
| B | 0 | 26 | 13 |
| C | 0 | 26 | 13 |
| D | 0 | 21 | 8 |
| Mode SS | |||
|---|---|---|---|
| Quadrant | BADHDUFLAG | Total packets | Discarded packets |
| A | 0 | 52 | 28 |
| B | 0 | 52 | 30 |
| C | 0 | 52 | 29 |
| D | 0 | 51 | 26 |
| Mode M0 | |||
|---|---|---|---|
| Quadrant | BADHDUFLAG | Total packets | Discarded packets |
| A | 0 | 6727 | 4368 |
| B | 0 | 5676 | 3560 |
| C | 0 | 5314 | 3148 |
| D | 0 | 6049 | 3612 |
| Quadrant | Total seconds | Saturated seconds | Saturation percentage |
|---|---|---|---|
| A | 897 | 3 | 0.334448% |
| B | 998 | 2 | 0.200401% |
| C | 1051 | 2 | 0.190295% |
| D | 1140 | 3 | 0.263158% |
Noise dominated data is calculated using 1-second bins in cleaned event files. If a bin has >2000 counts, and if more than 50% of those come from <1% of pixels, then it is considered to be noise-dominated and hence unusable.
| Quadrant | # 1 sec bins | Bins with >0 counts | Bins with >2000 counts | High rate bins dominated by noise | Noise dominated (total time) | Noise dominated (detector-on time) | Marked lightcurve |
|---|---|---|---|---|---|---|---|
| A | 1276 | 1120 | 0 | 0 | 0.00% | 0.00% | 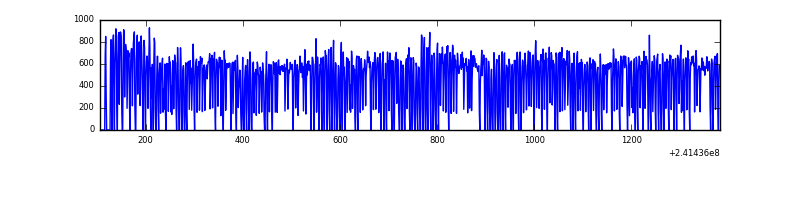 |
| B | 1276 | 1182 | 0 | 0 | 0.00% | 0.00% |  |
| C | 1276 | 1227 | 0 | 0 | 0.00% | 0.00% | 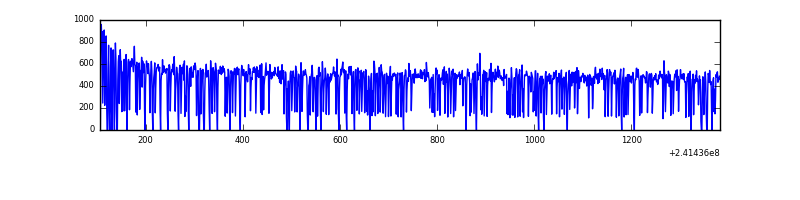 |
| D | 1276 | 1183 | 0 | 0 | 0.00% | 0.00% |  |
Top three noisy pixels from each quadrant. If the there are fewer than three noisy pixels in the level2.evt file, extra rows are filled as -1
| Pixel properties | Quadrant properties | ||||||
|---|---|---|---|---|---|---|---|
| Quadrant | DetID | PixID | Counts | Sigma | Mean | Median | Sigma |
| A | 8 | 15 | 84461 | 3276.43 | 119 | 117 | 25.7 |
| A | 13 | 251 | 20575 | 794.71 | 119 | 117 | 25.7 |
| A | 0 | 226 | 1145 | 39.93 | 119 | 117 | 25.7 |
| B | 0 | 214 | 8425 | 306.3 | 132 | 129 | 27.1 |
| B | 4 | 239 | 6568 | 237.74 | 132 | 129 | 27.1 |
| B | 0 | 219 | 3323 | 117.93 | 132 | 129 | 27.1 |
| C | 13 | 61 | 980 | 25.35 | 137 | 138 | 33.2 |
| C | 14 | 234 | 619 | 14.48 | 137 | 138 | 33.2 |
| C | 14 | 67 | 415 | 8.34 | 137 | 138 | 33.2 |
| D | 8 | 195 | 11782 | 315.89 | 150 | 146 | 36.8 |
| D | 2 | 33 | 8245 | 219.87 | 150 | 146 | 36.8 |
| D | 1 | 20 | 6743 | 179.09 | 150 | 146 | 36.8 |
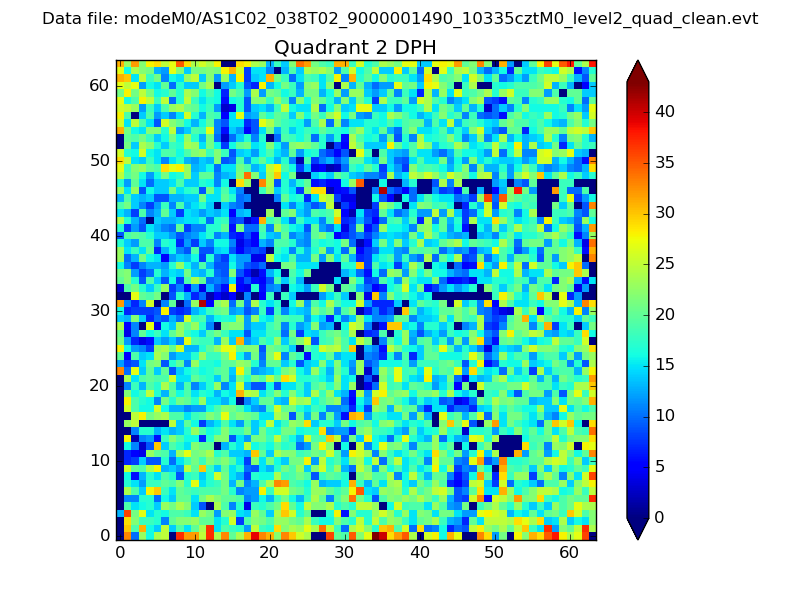
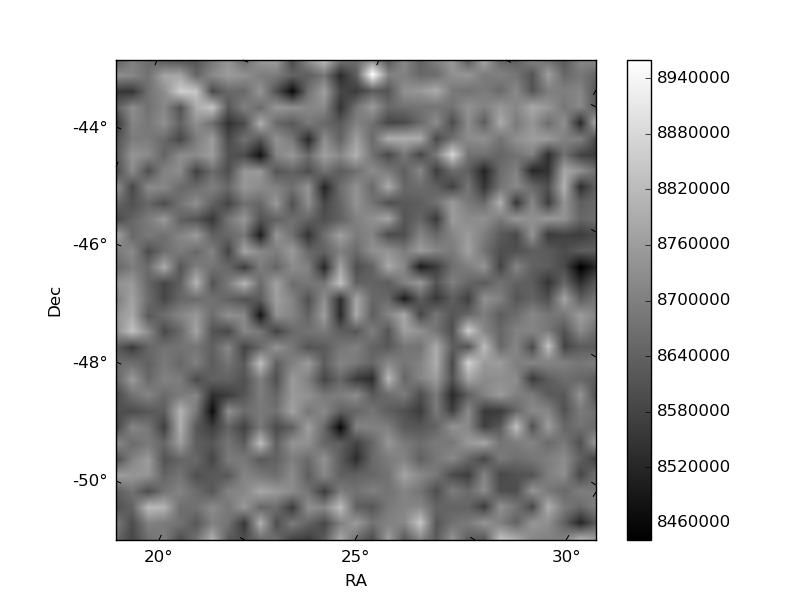
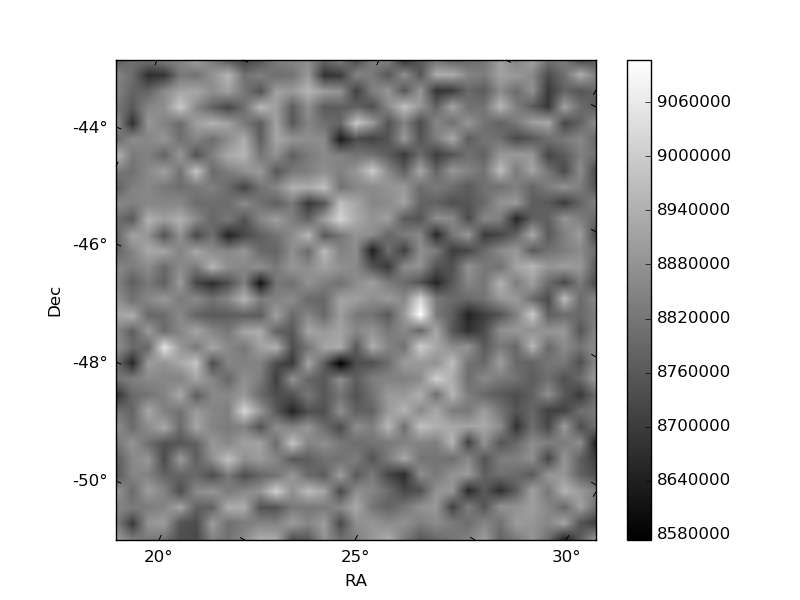
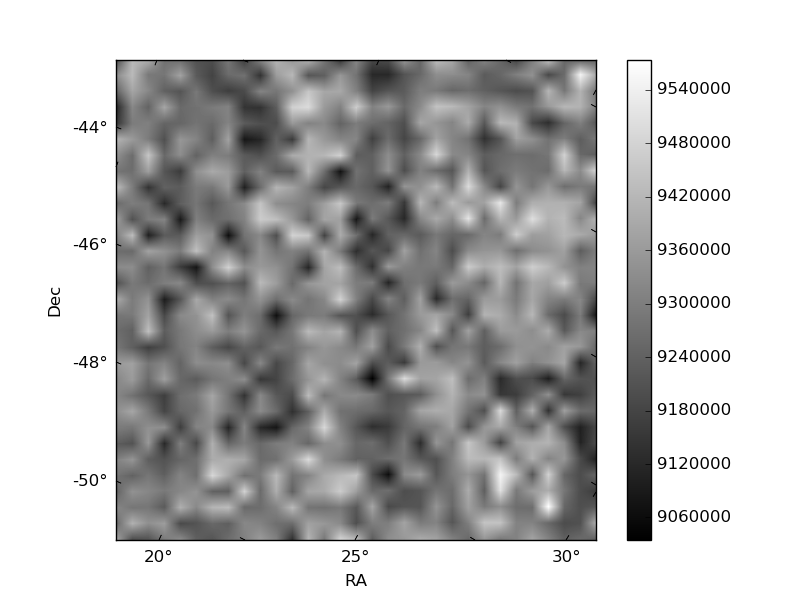
Histogram calculated using DETX and DETY for each event in the final _common_clean file
| Quadrant A | 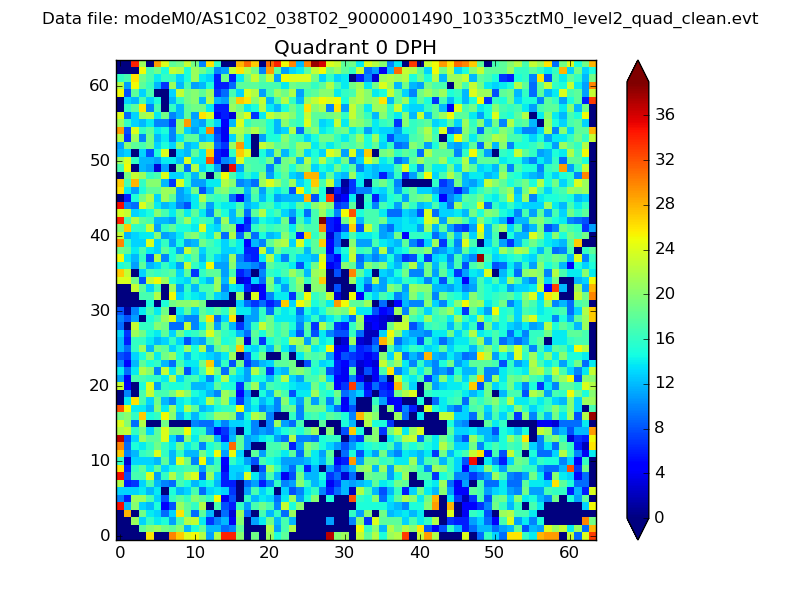 |
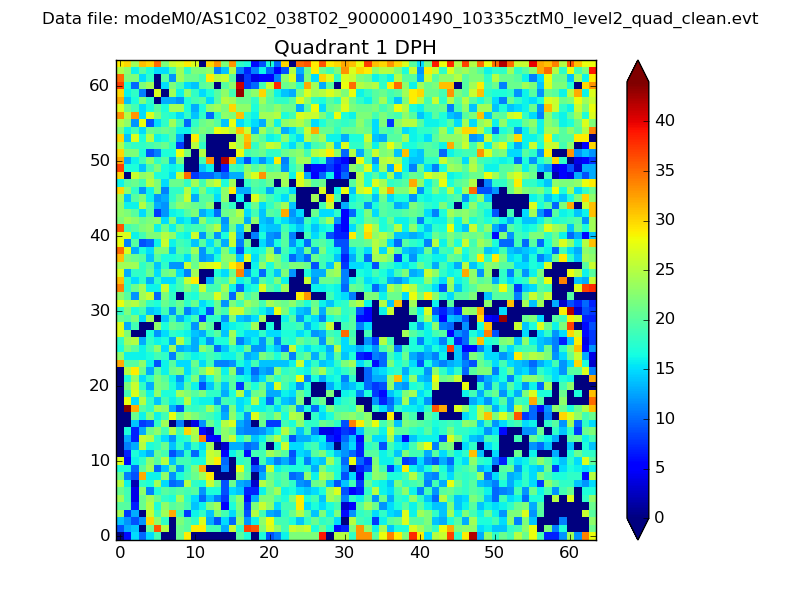 |
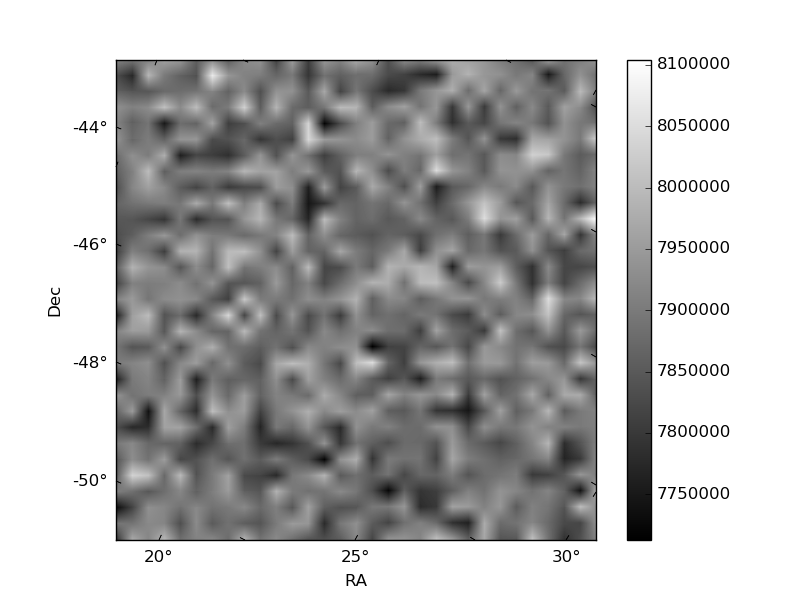
Quadrant B |
|---|---|---|---|
| Quadrant D | 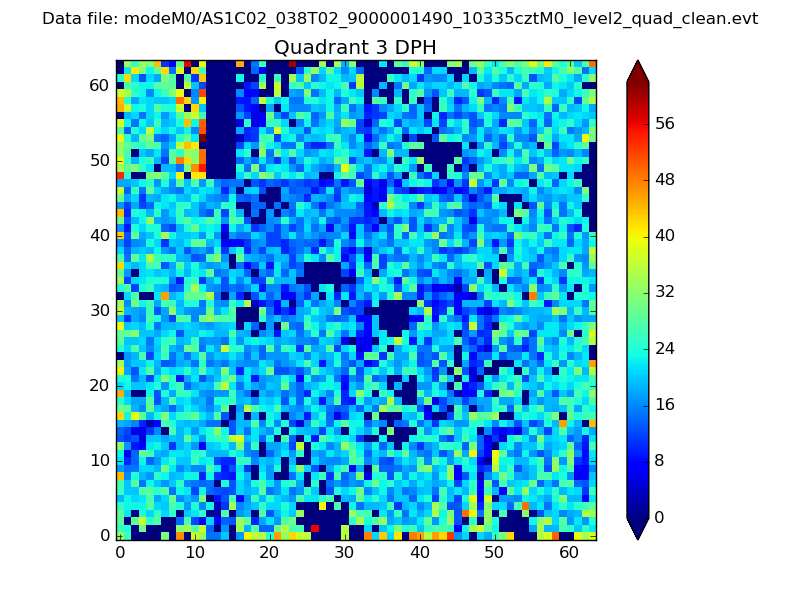 |
 |
Quadrant C |
| Plot type | Count rate plots | Images |
|---|---|---|
| Comparison with Poisson distribution Blue bars denote a histogram of data divided into 1 sec bins. Red curve is a Poisson curve with rate = median count rate of data. |
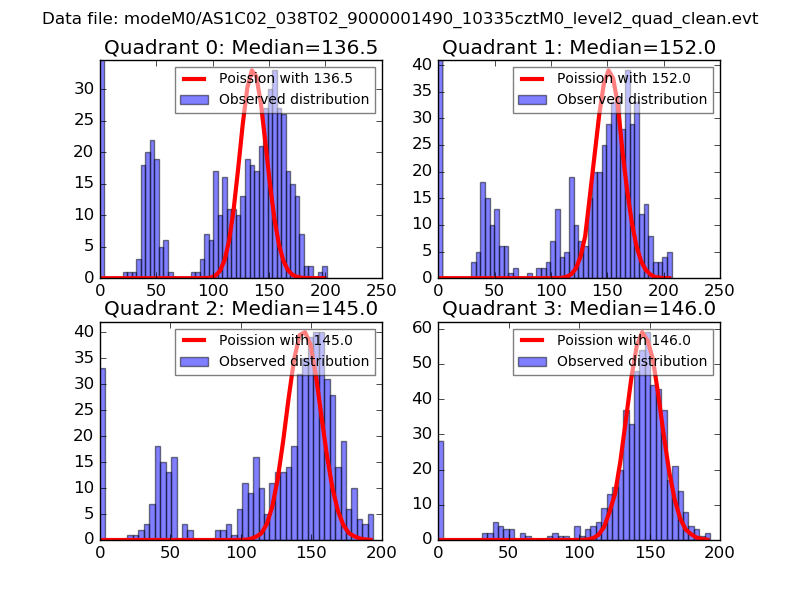 |
 |
| Quadrant-wise count rates Data is divided into 100 sec bins |
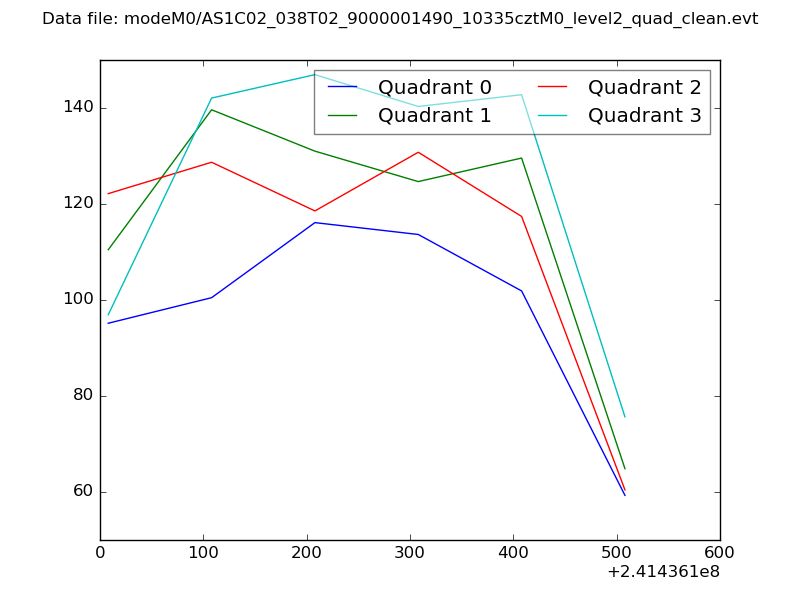 |
|
| Module-wise count rates for Quadrant A Data is divided into 100 sec bins |
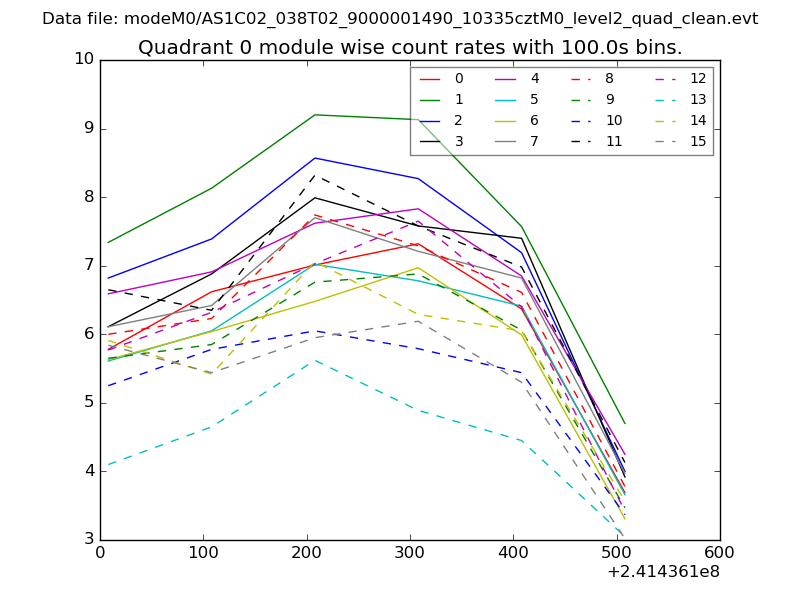 |
 |
| Module-wise count rates for Quadrant B Data is divided into 100 sec bins |
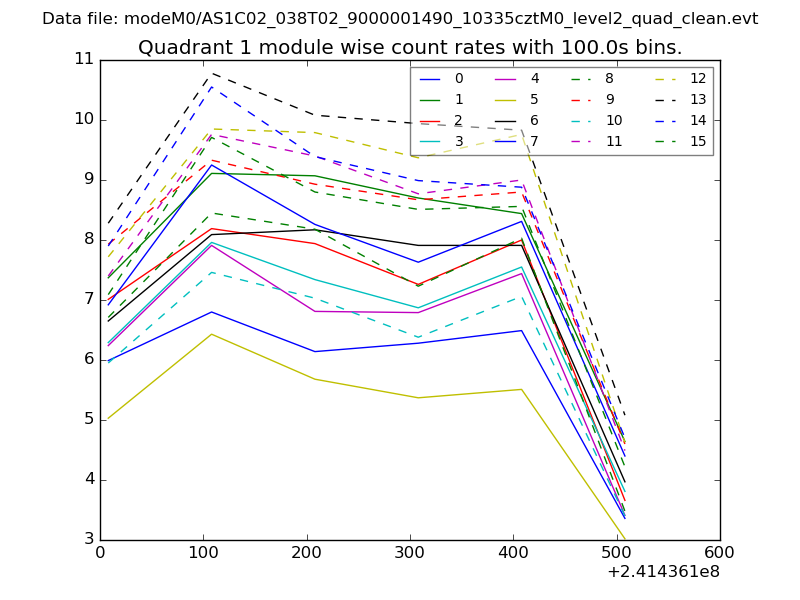 |
 |
| Module-wise count rates for Quadrant C Data is divided into 100 sec bins |
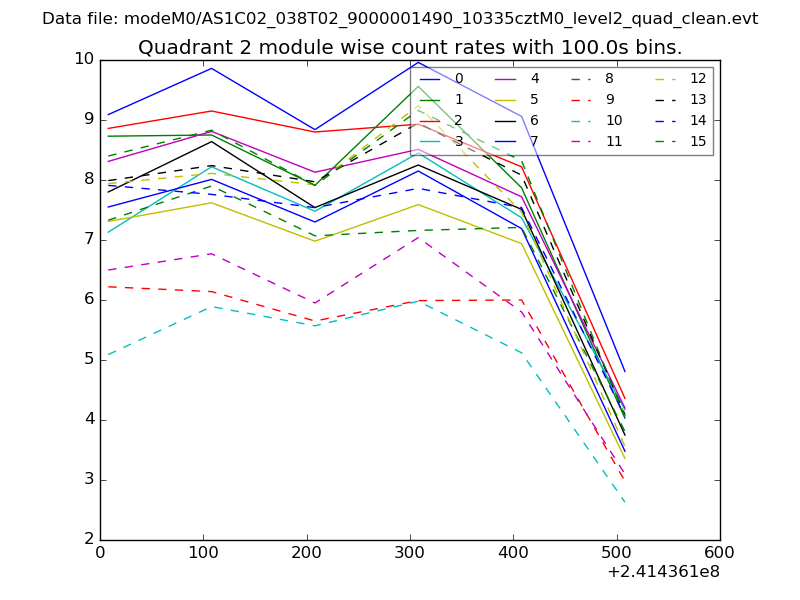 |
 |
| Module-wise count rates for Quadrant D Data is divided into 100 sec bins |
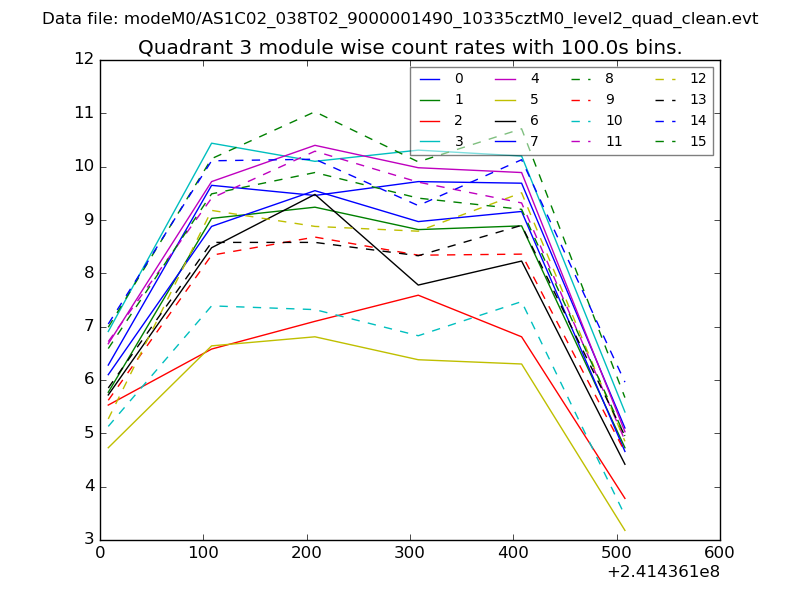 |
 |
| Parameter | Plot |
|---|---|
| CZT HV Monitor | 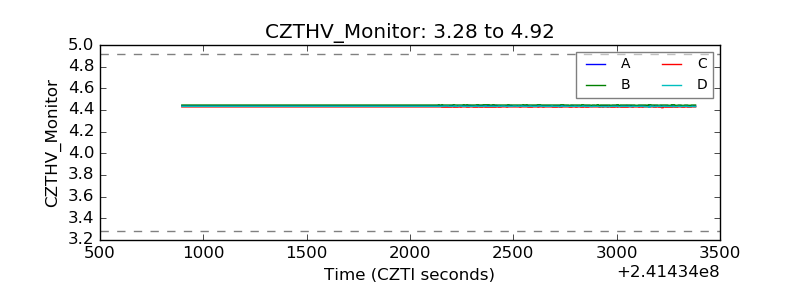 |
| D_VDD |  |
| Temperature 1 | 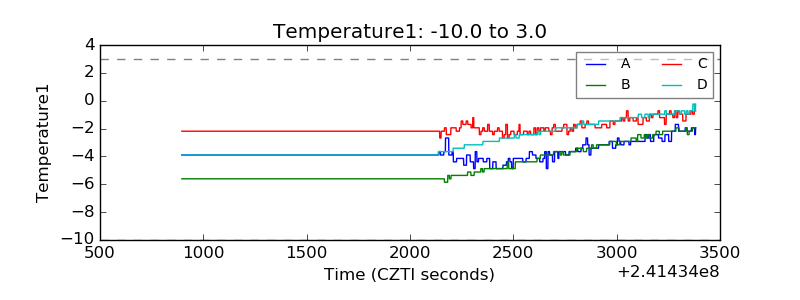 |
| Veto HV Monitor | 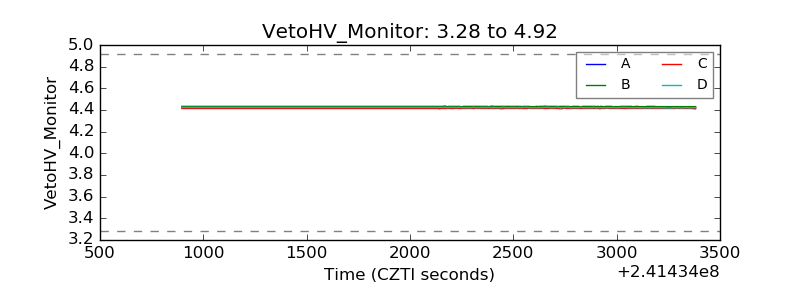 |
| Veto LLD | 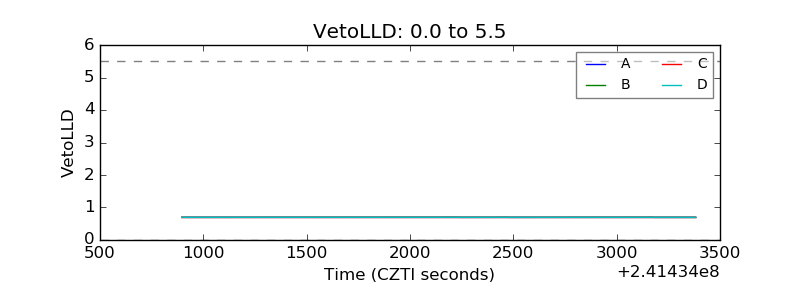 |
| Alpha Counter | 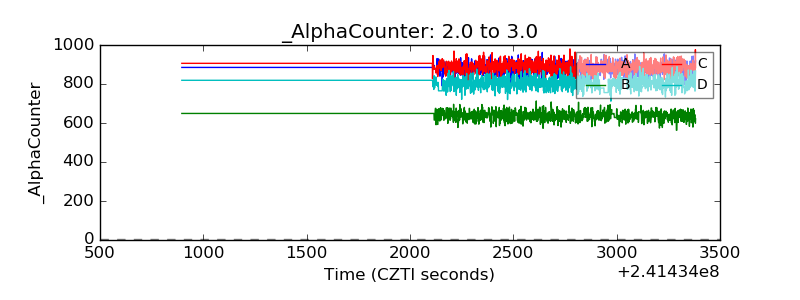 |
| _CPM_Rate | 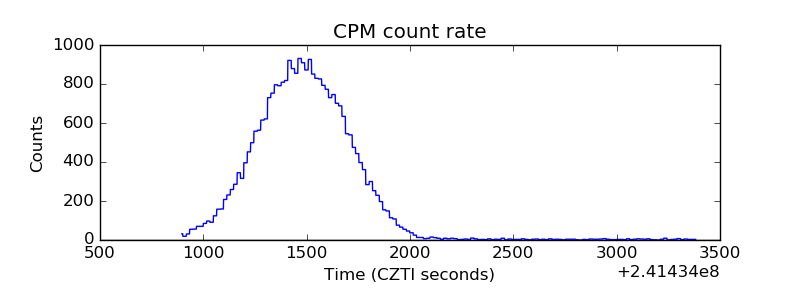 |
| CZT Counter | 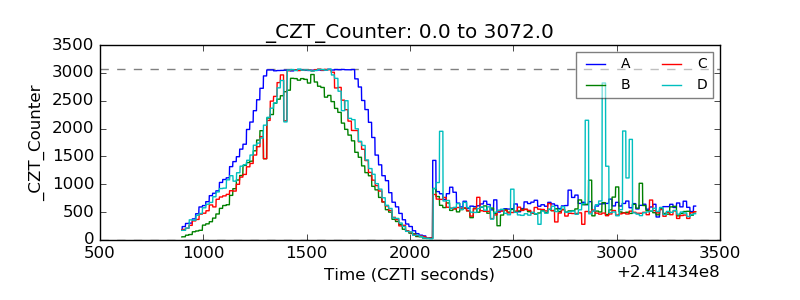 |
| +2.5 Volts monitor | 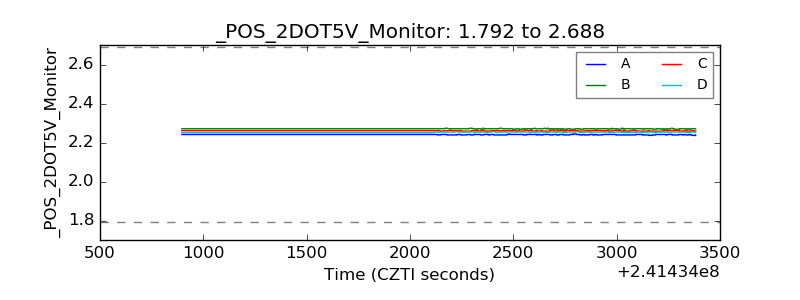 |
| +5 Volts monitor |  |
| _ROLL_ROT | 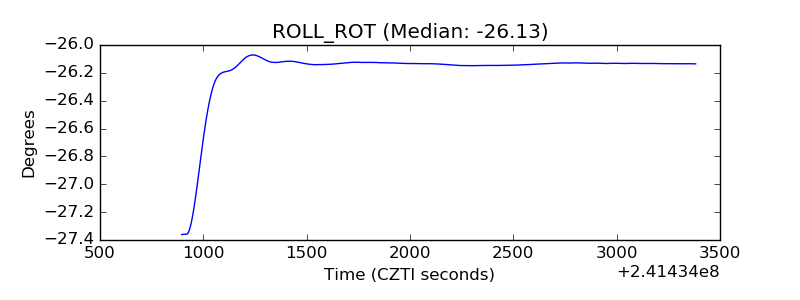 |
| _Roll_DEC | 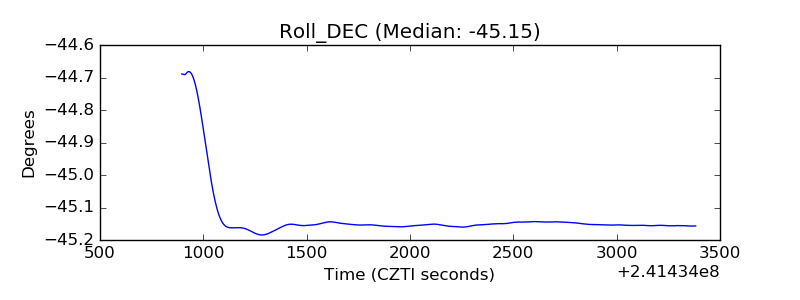 |
| _Roll_RA | 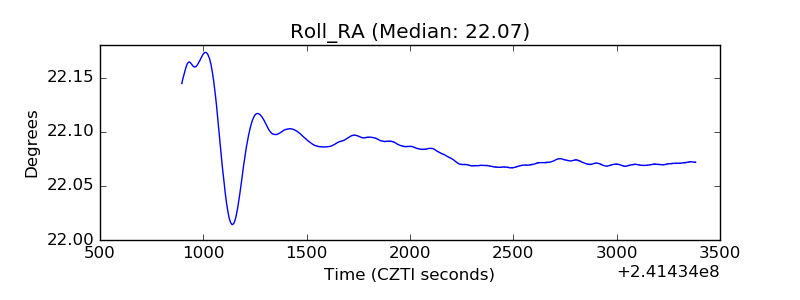 |
| Veto Counter | 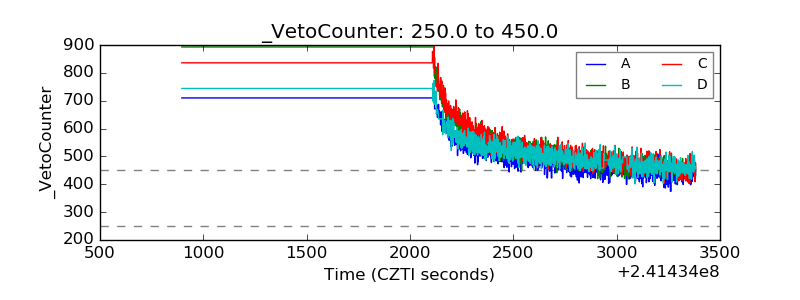 |