| Param | Original file | Final file |
|---|---|---|
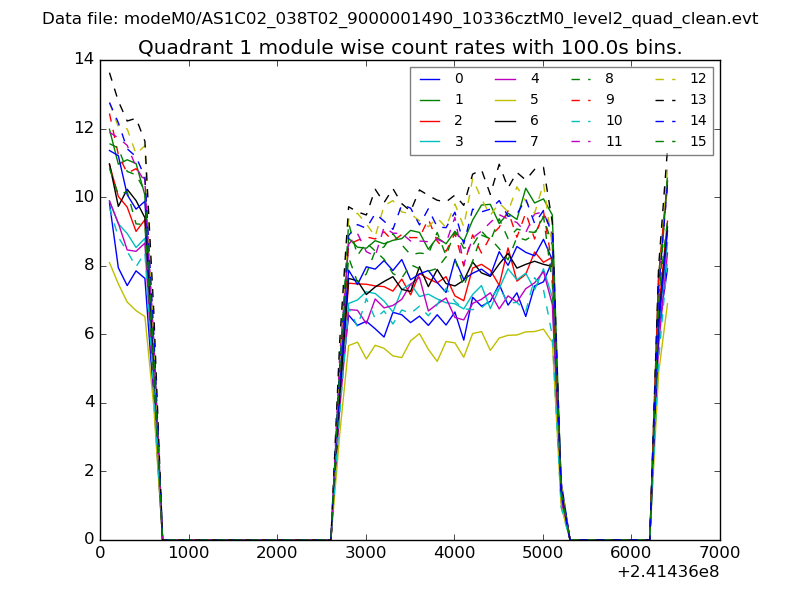
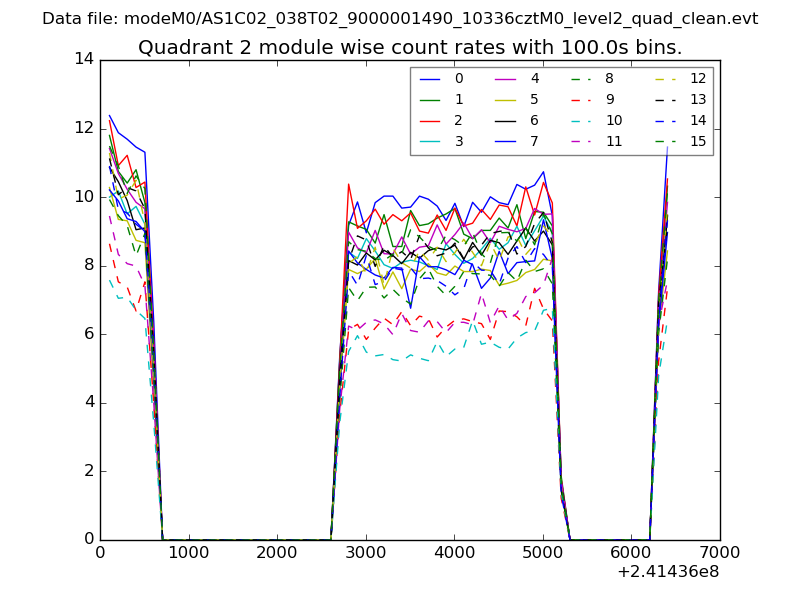
| Filename | modeM0/AS1C02_038T02_9000001490_10336cztM0_level2.evt | modeM0/AS1C02_038T02_9000001490_10336cztM0_level2_quad_clean.evt |
| Size (bytes) | 502,263,360 | 71,956,800 |
| Size | 479.0 MB | 68.6 MB |
| Events in quadrant A | 4,137,618 | 429,242 |
| Events in quadrant B | 3,638,473 | 436,273 |
| Events in quadrant C | 3,218,277 | 431,557 |
| Events in quadrant D | 3,761,344 | 414,093 |
| Mode M9 | |||
|---|---|---|---|
| Quadrant | BADHDUFLAG | Total packets | Discarded packets |
| A | 0 | 11 | 0 |
| B | 0 | 11 | 0 |
| C | 0 | 11 | 0 |
| D | 0 | 12 | 0 |
| Mode SS | |||
|---|---|---|---|
| Quadrant | BADHDUFLAG | Total packets | Discarded packets |
| A | 0 | 136 | 0 |
| B | 0 | 136 | 0 |
| C | 0 | 136 | 0 |
| D | 0 | 136 | 0 |
| Mode M0 | |||
|---|---|---|---|
| Quadrant | BADHDUFLAG | Total packets | Discarded packets |
| A | 0 | 16921 | 3 |
| B | 0 | 14940 | 2 |
| C | 0 | 13866 | 2 |
| D | 0 | 15242 | 2 |
| Quadrant | Total seconds | Saturated seconds | Saturation percentage |
|---|---|---|---|
| A | 6708 | 136 | 2.027430% |
| B | 6708 | 200 | 2.981515% |
| C | 6708 | 100 | 1.490757% |
| D | 6708 | 176 | 2.623733% |
Noise dominated data is calculated using 1-second bins in cleaned event files. If a bin has >2000 counts, and if more than 50% of those come from <1% of pixels, then it is considered to be noise-dominated and hence unusable.
| Quadrant | # 1 sec bins | Bins with >0 counts | Bins with >2000 counts | High rate bins dominated by noise | Noise dominated (total time) | Noise dominated (detector-on time) | Marked lightcurve |
|---|---|---|---|---|---|---|---|
| A | 7818 | 6708 | 0 | 0 | 0.00% | 0.00% | 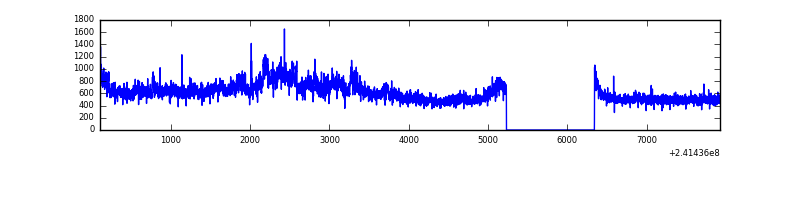 |
| B | 7818 | 6708 | 47 | 47 | 0.60% | 0.70% | 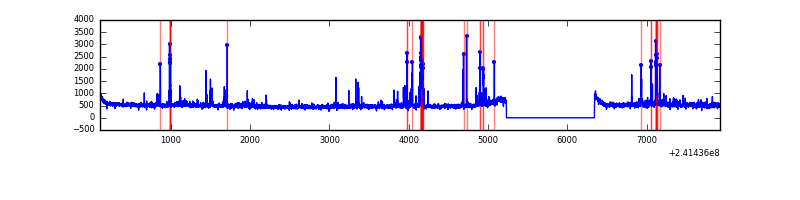 |
| C | 7818 | 6708 | 3 | 3 | 0.04% | 0.04% | 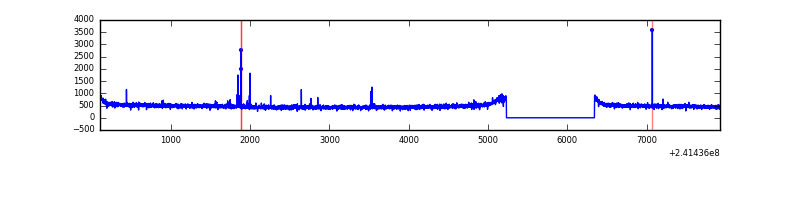 |
| D | 7818 | 6708 | 46 | 46 | 0.59% | 0.69% | 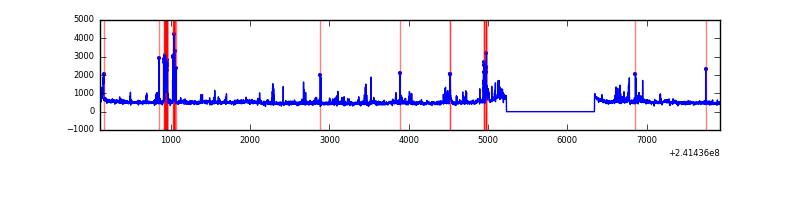 |
Top three noisy pixels from each quadrant. If the there are fewer than three noisy pixels in the level2.evt file, extra rows are filled as -1
| Pixel properties | Quadrant properties | ||||||
|---|---|---|---|---|---|---|---|
| Quadrant | DetID | PixID | Counts | Sigma | Mean | Median | Sigma |
| A | 8 | 15 | 649663 | 3827.77 | 838 | 819 | 169.5 |
| A | 13 | 251 | 246893 | 1451.68 | 838 | 819 | 169.5 |
| A | 0 | 226 | 7777 | 41.05 | 838 | 819 | 169.5 |
| B | 4 | 239 | 234197 | 1484.44 | 833 | 813 | 157.2 |
| B | 11 | 51 | 57041 | 357.64 | 833 | 813 | 157.2 |
| B | 0 | 214 | 35667 | 221.69 | 833 | 813 | 157.2 |
| C | 14 | 234 | 26140 | 134.97 | 818 | 821 | 187.6 |
| C | 13 | 61 | 6059 | 27.92 | 818 | 821 | 187.6 |
| C | 1 | 3 | 2656 | 9.78 | 818 | 821 | 187.6 |
| D | 2 | 33 | 189172 | 967.15 | 814 | 791 | 194.8 |
| D | 8 | 195 | 159295 | 813.76 | 814 | 791 | 194.8 |
| D | 2 | 14 | 116547 | 594.29 | 814 | 791 | 194.8 |
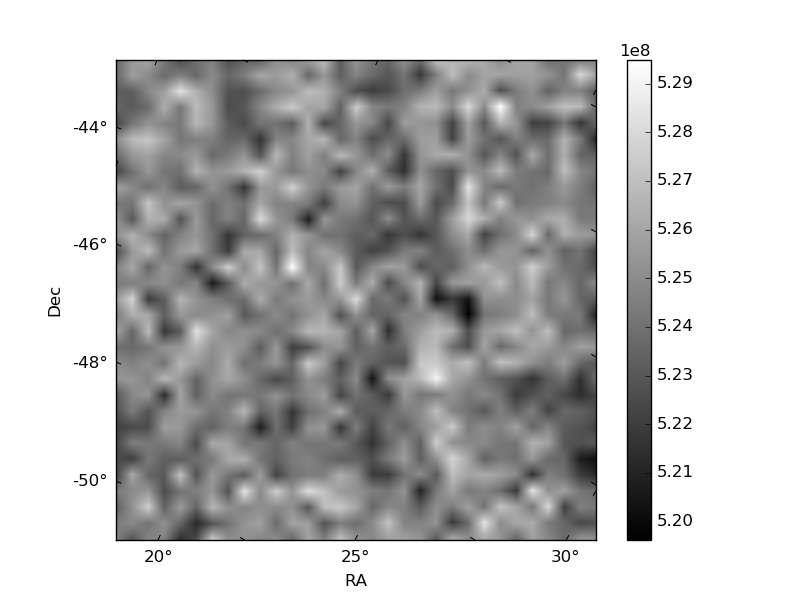
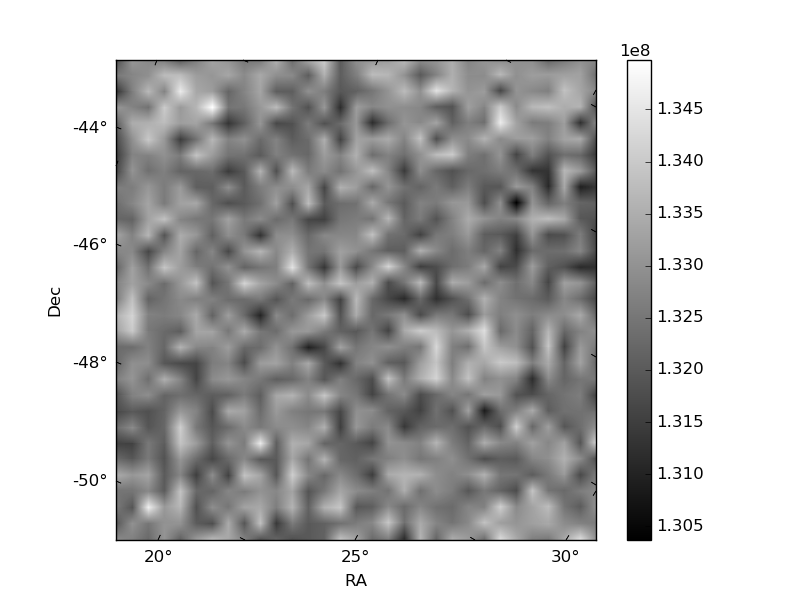
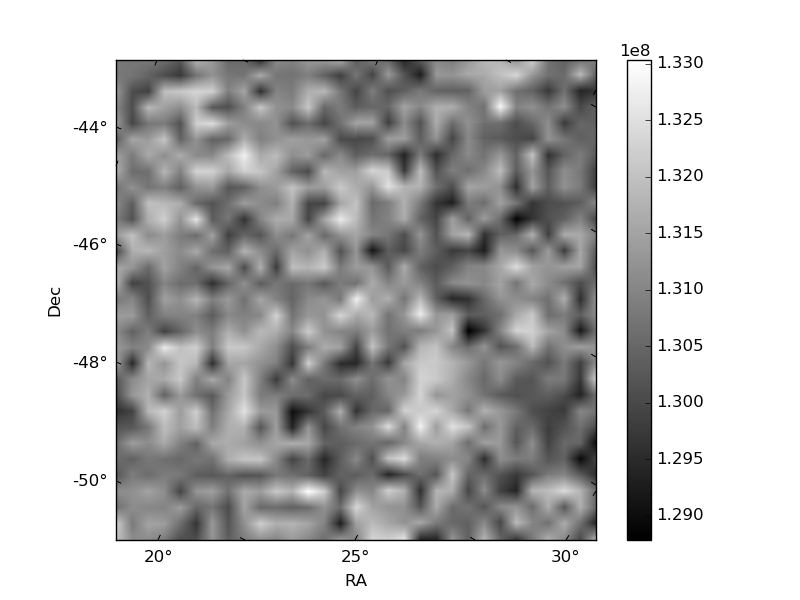
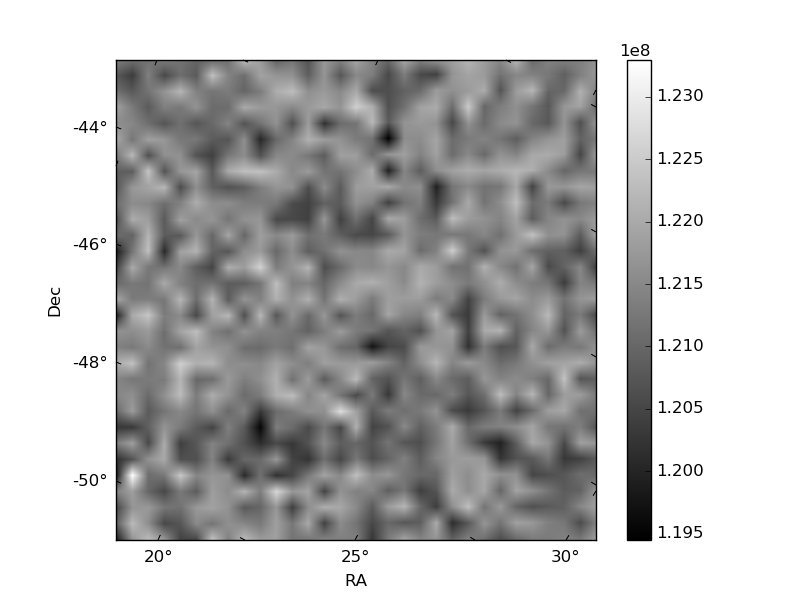
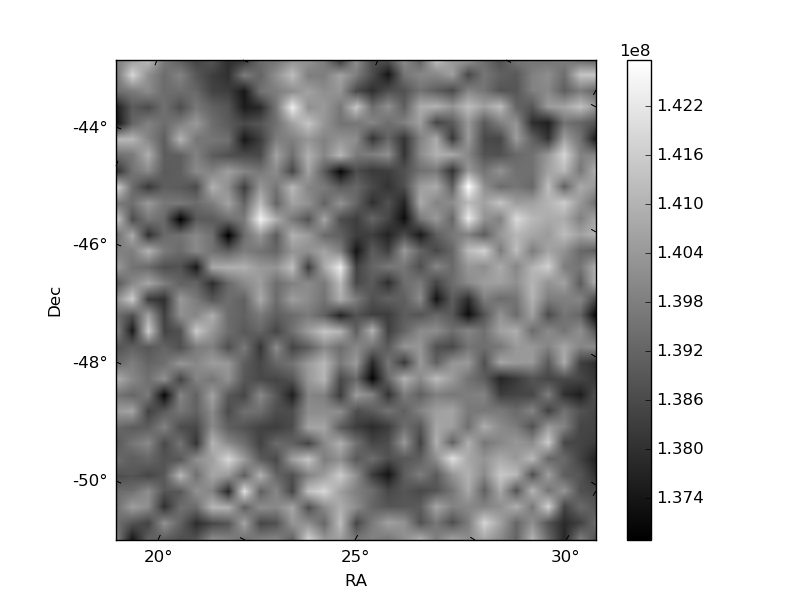
Histogram calculated using DETX and DETY for each event in the final _common_clean file
| Quadrant A | 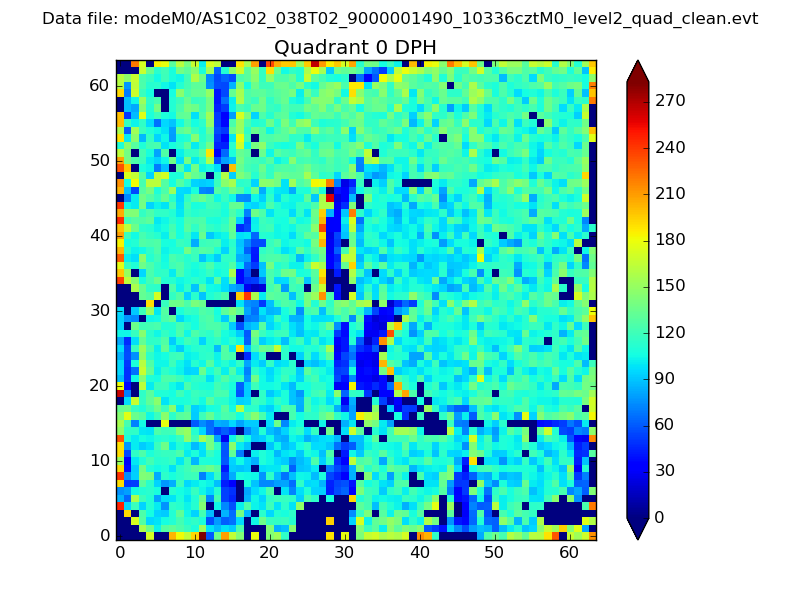 |
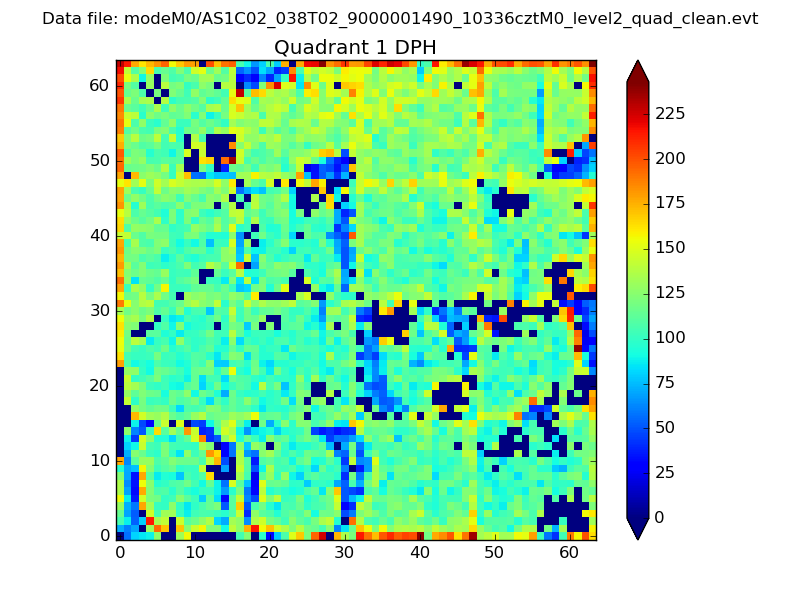 |
Quadrant B |
|---|---|---|---|
| Quadrant D | 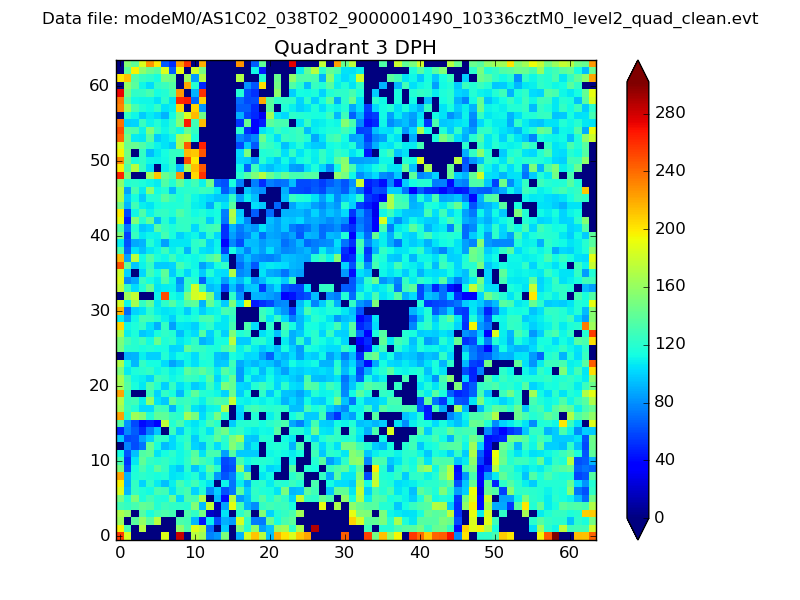 |
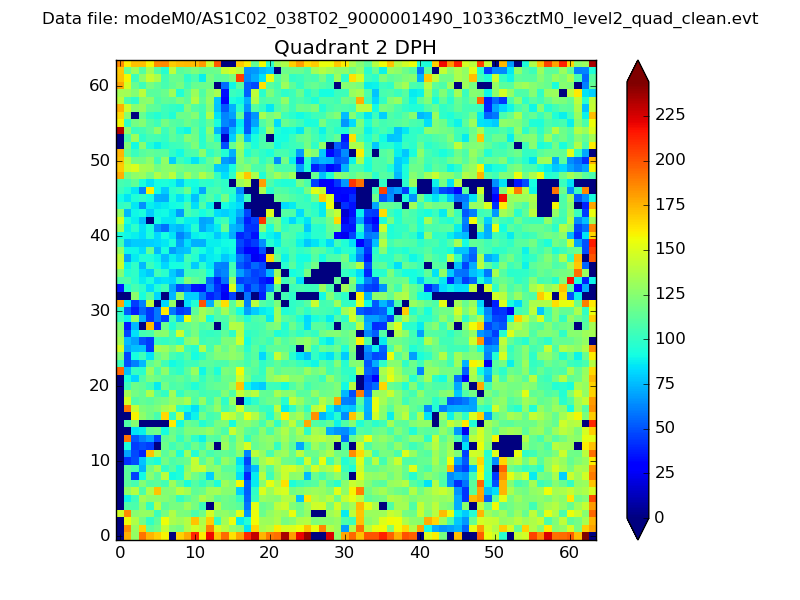 |
Quadrant C |
| Plot type | Count rate plots | Images |
|---|---|---|
| Comparison with Poisson distribution Blue bars denote a histogram of data divided into 1 sec bins. Red curve is a Poisson curve with rate = median count rate of data. |
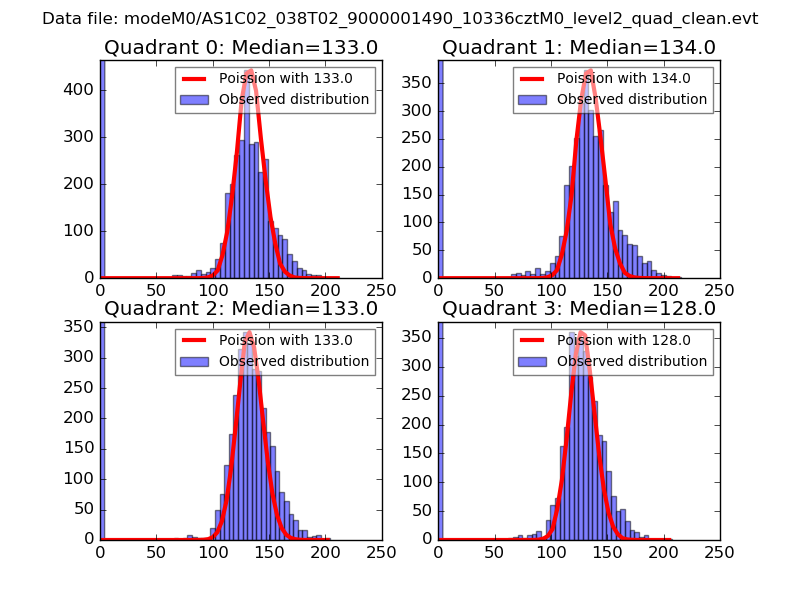 |
 |
| Quadrant-wise count rates Data is divided into 100 sec bins |
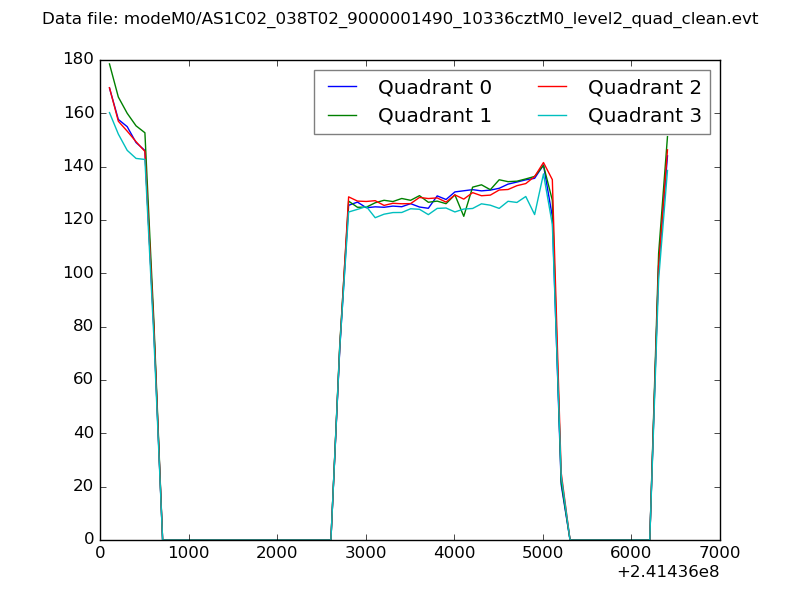 |
|
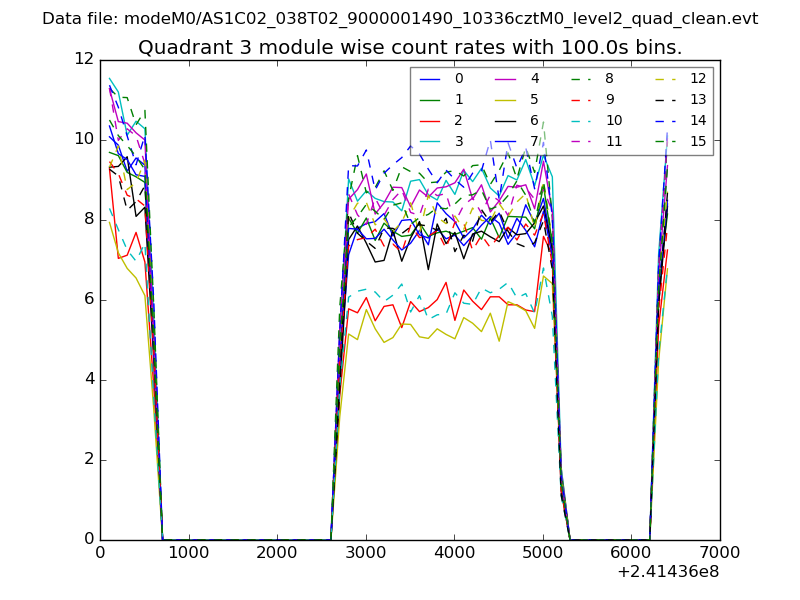
| Module-wise count rates for Quadrant A Data is divided into 100 sec bins |
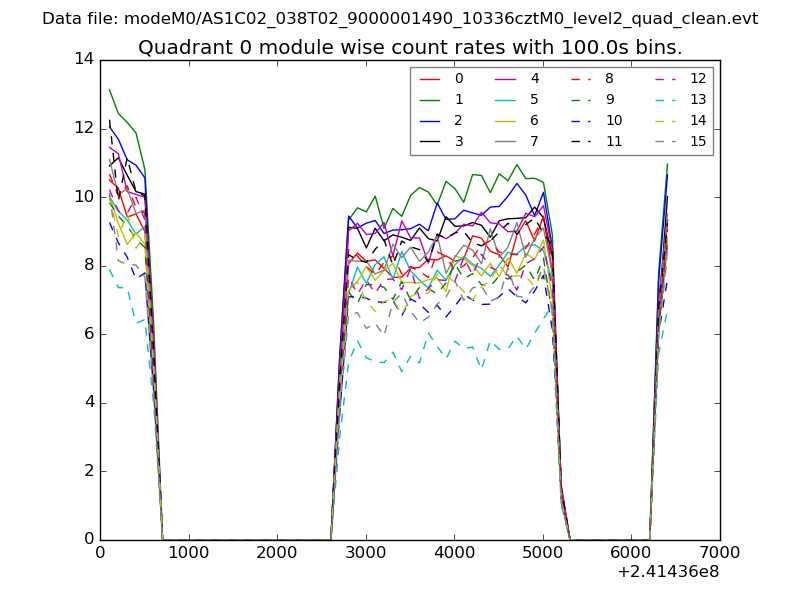 |
 |
| Module-wise count rates for Quadrant B Data is divided into 100 sec bins |
 |
 |
| Module-wise count rates for Quadrant C Data is divided into 100 sec bins |
 |
 |
| Module-wise count rates for Quadrant D Data is divided into 100 sec bins |
 |
 |
| Parameter | Plot |
|---|---|
| CZT HV Monitor | 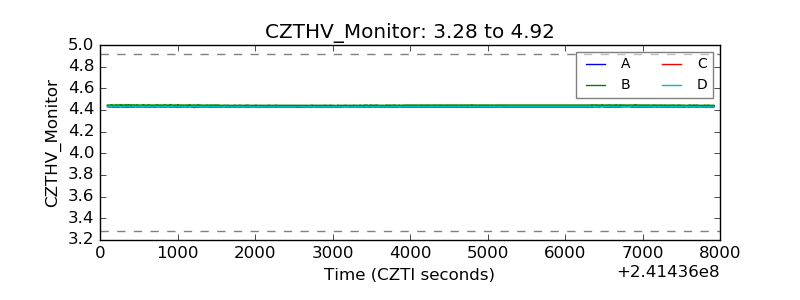 |
| D_VDD | 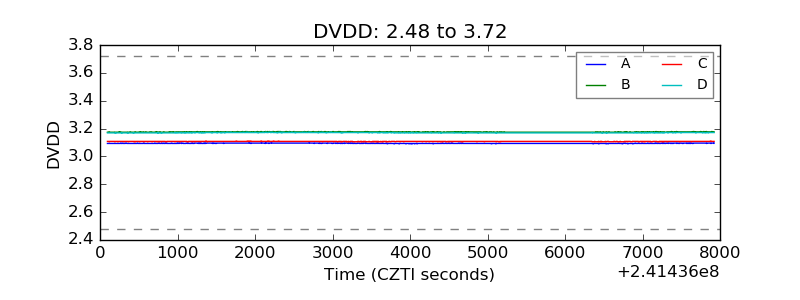 |
| Temperature 1 | 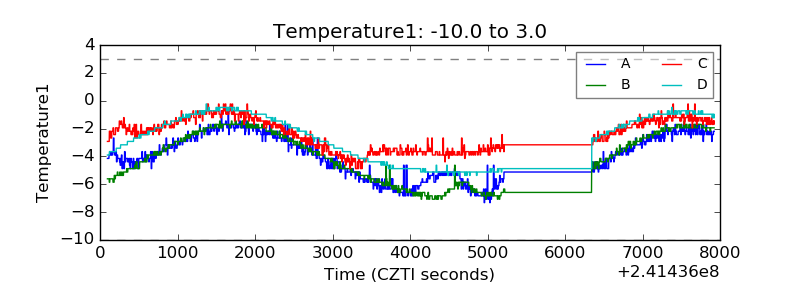 |
| Veto HV Monitor | 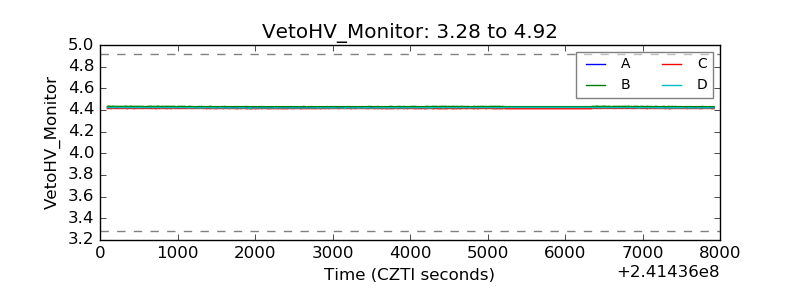 |
| Veto LLD |  |
| Alpha Counter | 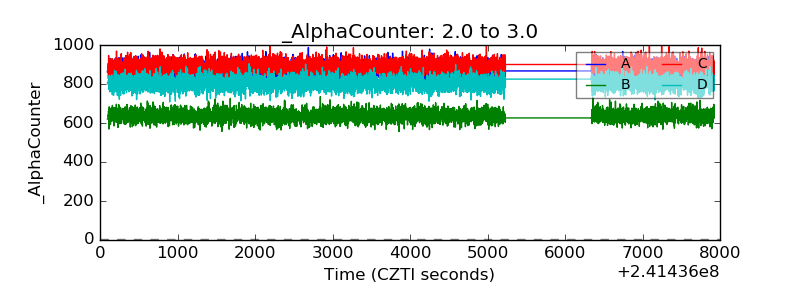 |
| _CPM_Rate |  |
| CZT Counter | 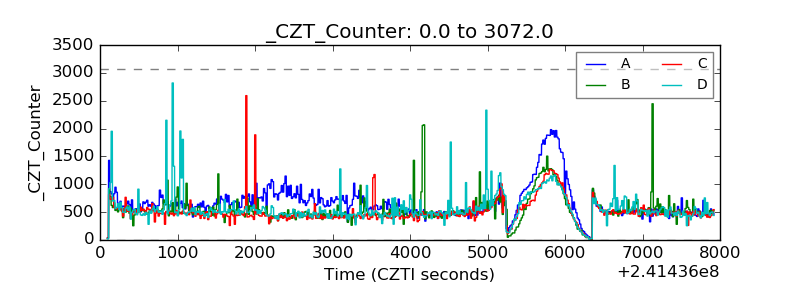 |
| +2.5 Volts monitor |  |
| +5 Volts monitor |  |
| _ROLL_ROT | 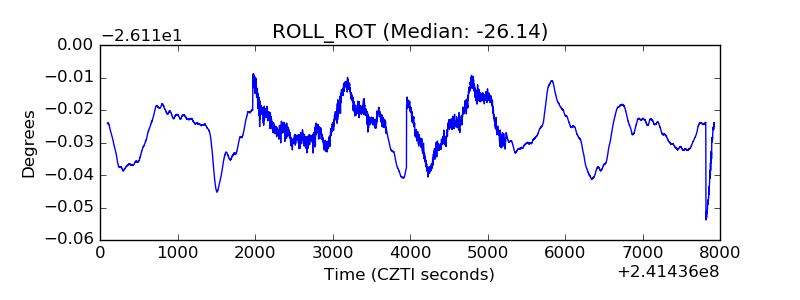 |
| _Roll_DEC | 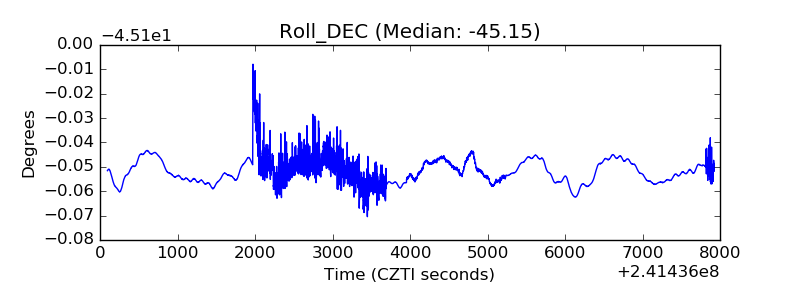 |
| _Roll_RA | 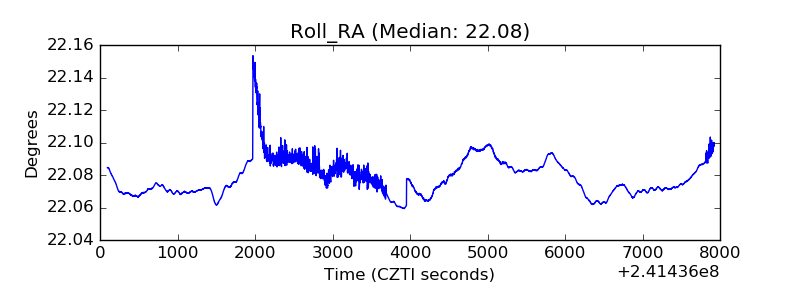 |
| Veto Counter | 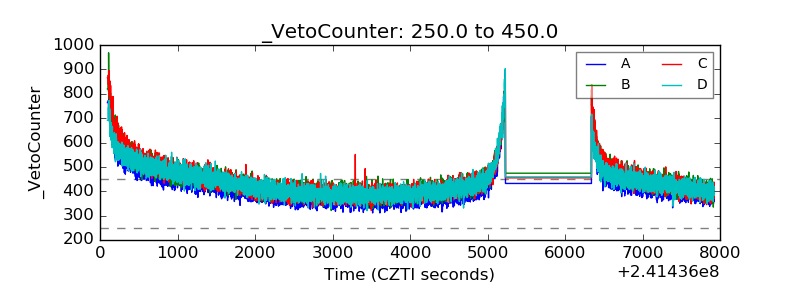 |