| Param | Original file | Final file |
|---|---|---|
| Filename | modeM0/AS1C02_038T02_9000001490_10338cztM0_level2.evt | modeM0/AS1C02_038T02_9000001490_10338cztM0_level2_quad_clean.evt |
| Size (bytes) | 537,768,000 | 79,807,680 |
| Size | 512.9 MB | 76.1 MB |
| Events in quadrant A | 4,195,057 | 474,818 |
| Events in quadrant B | 3,960,201 | 480,110 |
| Events in quadrant C | 3,456,856 | 477,862 |
| Events in quadrant D | 4,162,004 | 458,746 |
| Mode M9 | |||
|---|---|---|---|
| Quadrant | BADHDUFLAG | Total packets | Discarded packets |
| A | 0 | 7 | 0 |
| B | 0 | 7 | 0 |
| C | 0 | 7 | 0 |
| D | 0 | 8 | 0 |
| Mode SS | |||
|---|---|---|---|
| Quadrant | BADHDUFLAG | Total packets | Discarded packets |
| A | 0 | 152 | 0 |
| B | 0 | 152 | 0 |
| C | 0 | 152 | 0 |
| D | 0 | 152 | 0 |
| Mode M0 | |||
|---|---|---|---|
| Quadrant | BADHDUFLAG | Total packets | Discarded packets |
| A | 0 | 17256 | 3 |
| B | 0 | 16755 | 2 |
| C | 0 | 15589 | 2 |
| D | 0 | 17423 | 2 |
| Quadrant | Total seconds | Saturated seconds | Saturation percentage |
|---|---|---|---|
| A | 7549 | 158 | 2.092992% |
| B | 7549 | 230 | 3.046761% |
| C | 7549 | 66 | 0.874288% |
| D | 7549 | 185 | 2.450656% |
Noise dominated data is calculated using 1-second bins in cleaned event files. If a bin has >2000 counts, and if more than 50% of those come from <1% of pixels, then it is considered to be noise-dominated and hence unusable.
| Quadrant | # 1 sec bins | Bins with >0 counts | Bins with >2000 counts | High rate bins dominated by noise | Noise dominated (total time) | Noise dominated (detector-on time) | Marked lightcurve |
|---|---|---|---|---|---|---|---|
| A | 7909 | 7549 | 1 | 1 | 0.01% | 0.01% | 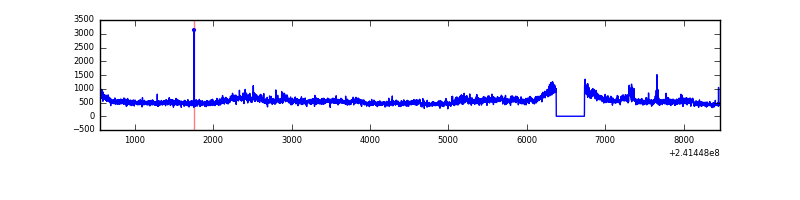 |
| B | 7909 | 7549 | 37 | 37 | 0.47% | 0.49% | 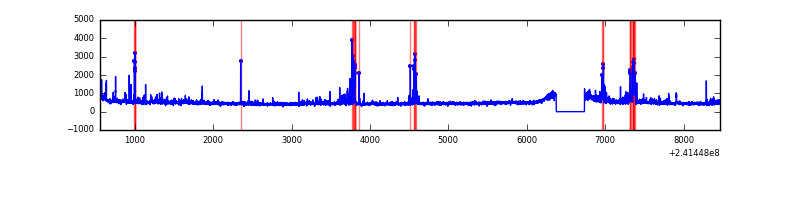 |
| C | 7909 | 7550 | 0 | 0 | 0.00% | 0.00% | 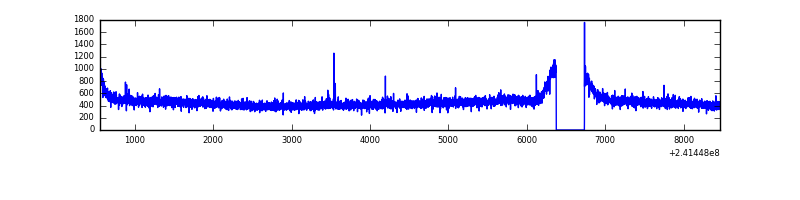 |
| D | 7909 | 7550 | 64 | 64 | 0.81% | 0.85% | 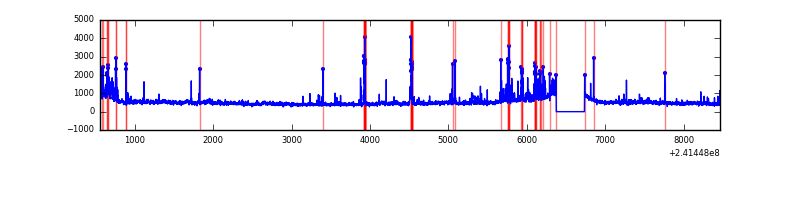 |
Top three noisy pixels from each quadrant. If the there are fewer than three noisy pixels in the level2.evt file, extra rows are filled as -1
| Pixel properties | Quadrant properties | ||||||
|---|---|---|---|---|---|---|---|
| Quadrant | DetID | PixID | Counts | Sigma | Mean | Median | Sigma |
| A | 8 | 15 | 584160 | 3182.39 | 904 | 882 | 183.3 |
| A | 13 | 251 | 102825 | 556.2 | 904 | 882 | 183.3 |
| A | 3 | 1 | 10198 | 50.83 | 904 | 882 | 183.3 |
| B | 4 | 239 | 227175 | 1318.82 | 901 | 879 | 171.6 |
| B | 11 | 51 | 100334 | 579.61 | 901 | 879 | 171.6 |
| B | 0 | 219 | 67091 | 385.87 | 901 | 879 | 171.6 |
| C | 14 | 234 | 7760 | 33.52 | 884 | 886 | 205.1 |
| C | 13 | 61 | 6581 | 27.77 | 884 | 886 | 205.1 |
| C | 8 | 222 | 2465 | 7.7 | 884 | 886 | 205.1 |
| D | 2 | 33 | 267827 | 1262.84 | 879 | 854 | 211.4 |
| D | 8 | 195 | 258827 | 1220.27 | 879 | 854 | 211.4 |
| D | 2 | 14 | 124470 | 584.73 | 879 | 854 | 211.4 |
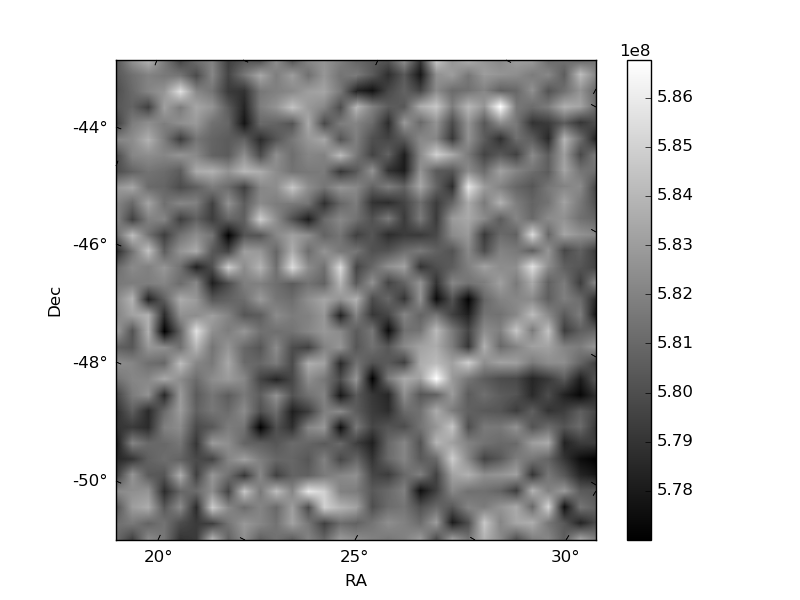
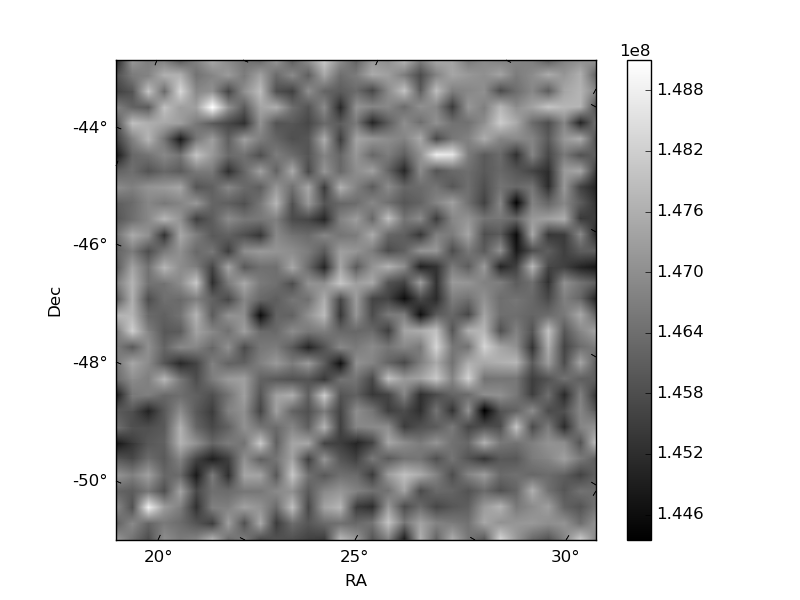
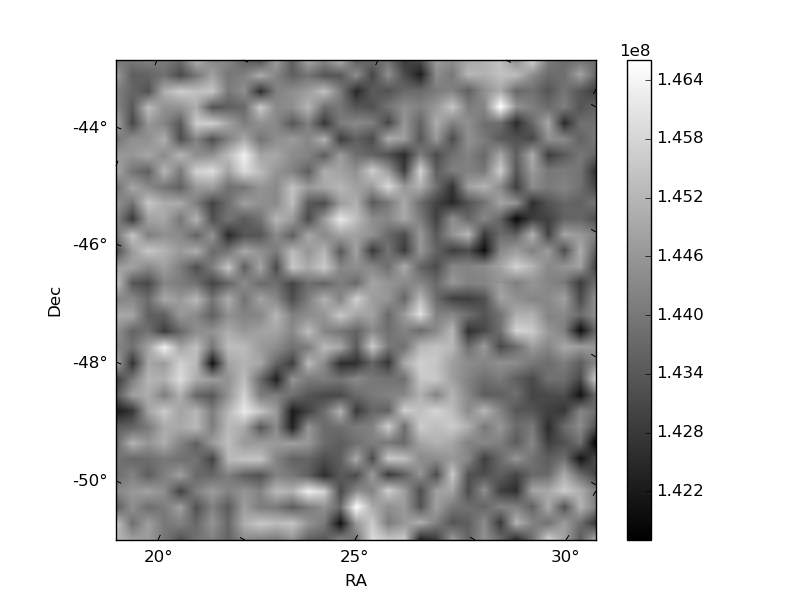
Histogram calculated using DETX and DETY for each event in the final _common_clean file
| Quadrant A | 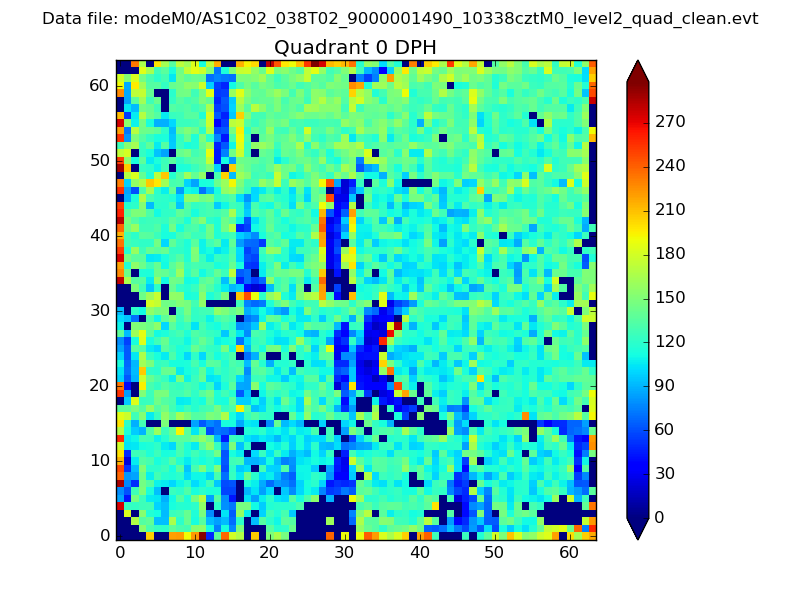 |
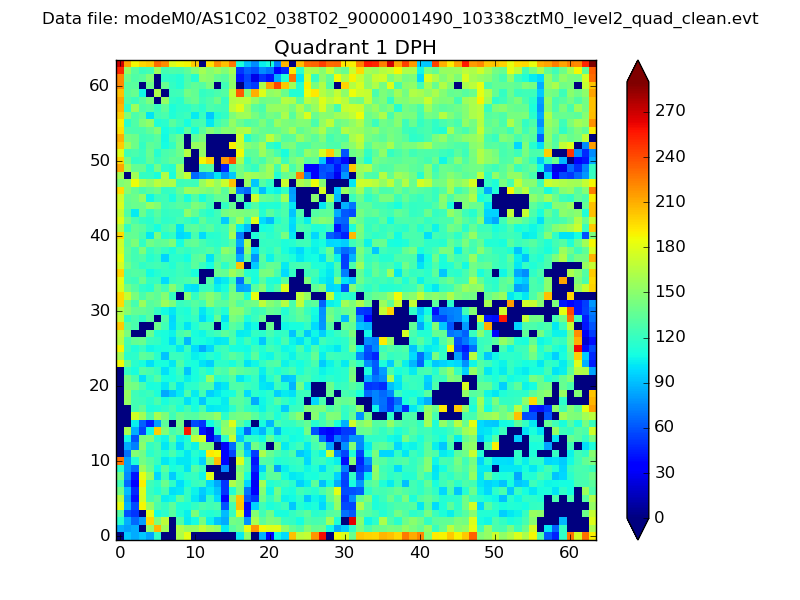 |
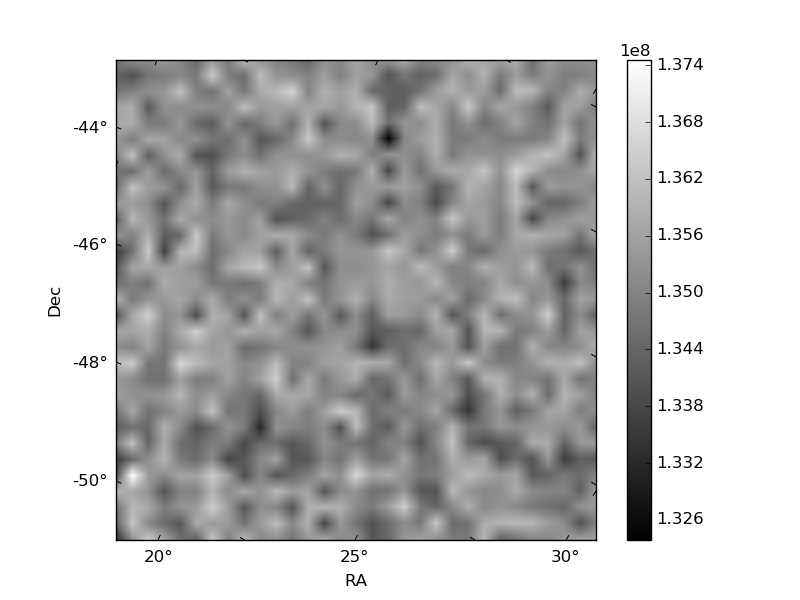
Quadrant B |
|---|---|---|---|
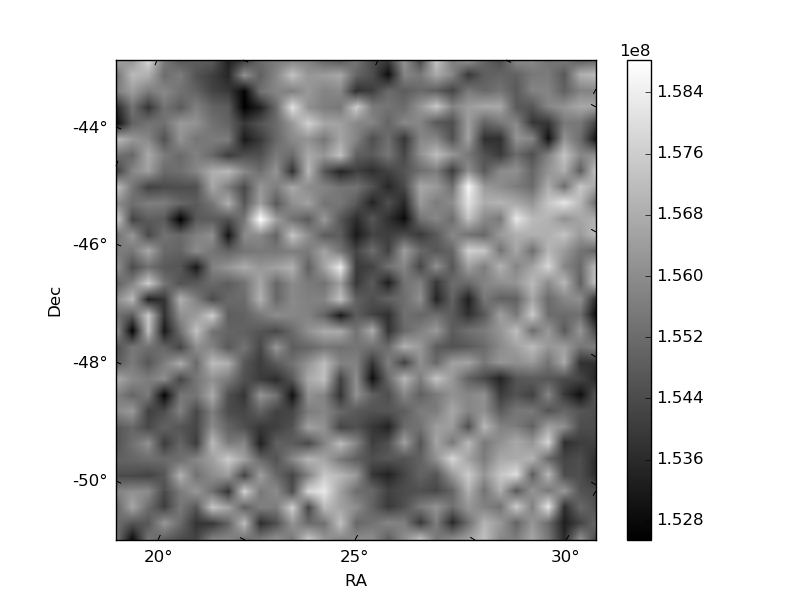
| Quadrant D | 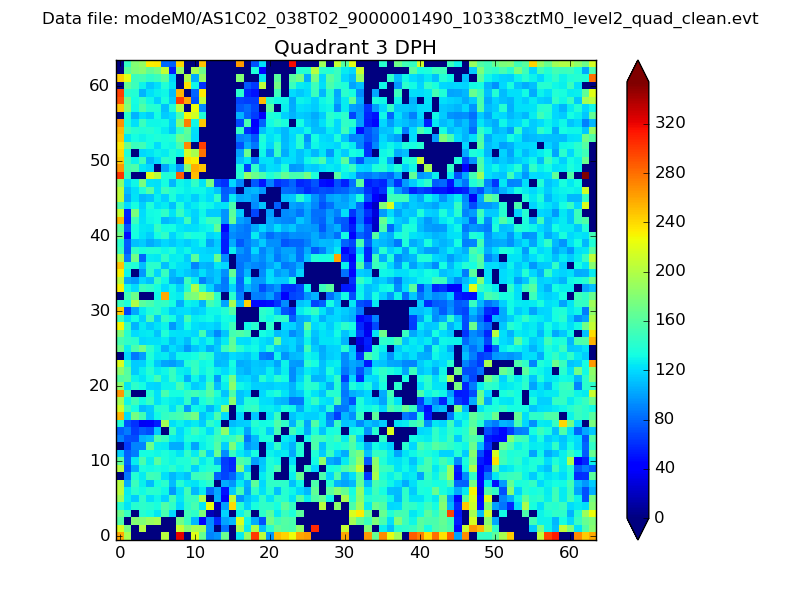 |
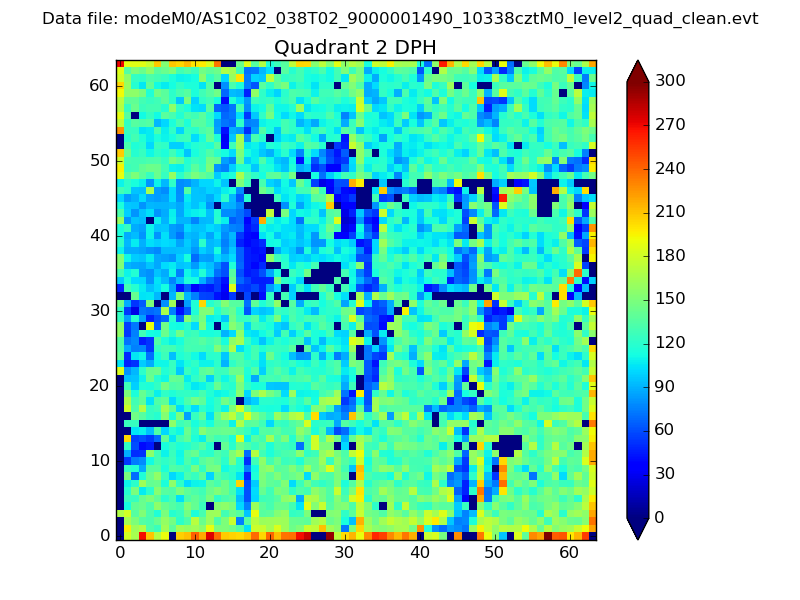 |
Quadrant C |
| Plot type | Count rate plots | Images |
|---|---|---|
| Comparison with Poisson distribution Blue bars denote a histogram of data divided into 1 sec bins. Red curve is a Poisson curve with rate = median count rate of data. |
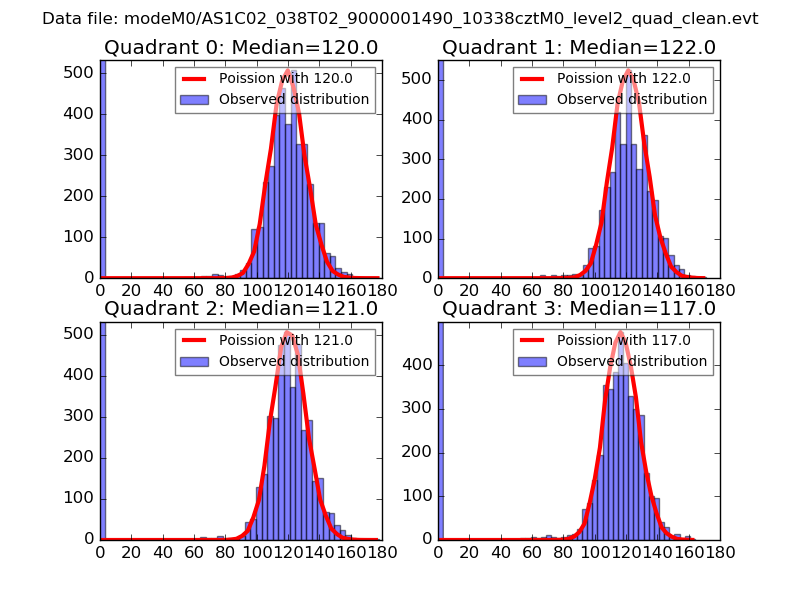 |
 |
| Quadrant-wise count rates Data is divided into 100 sec bins |
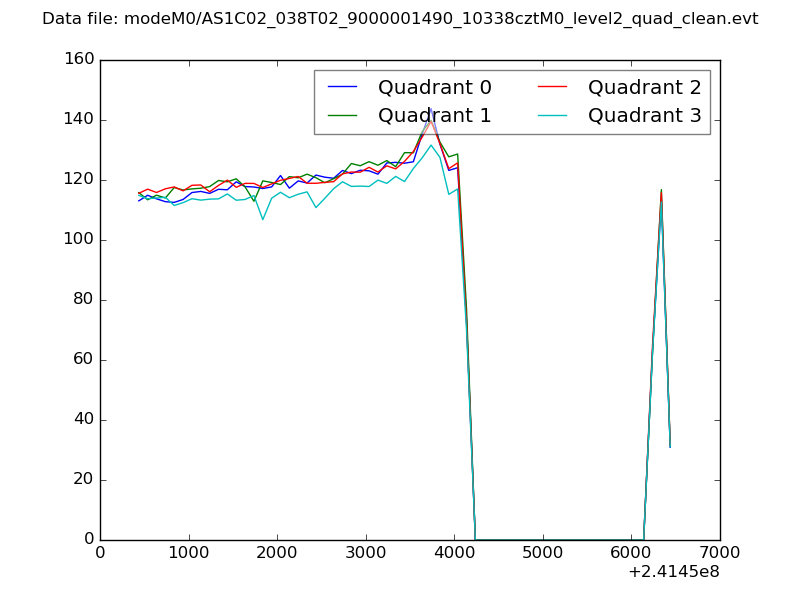 |
|
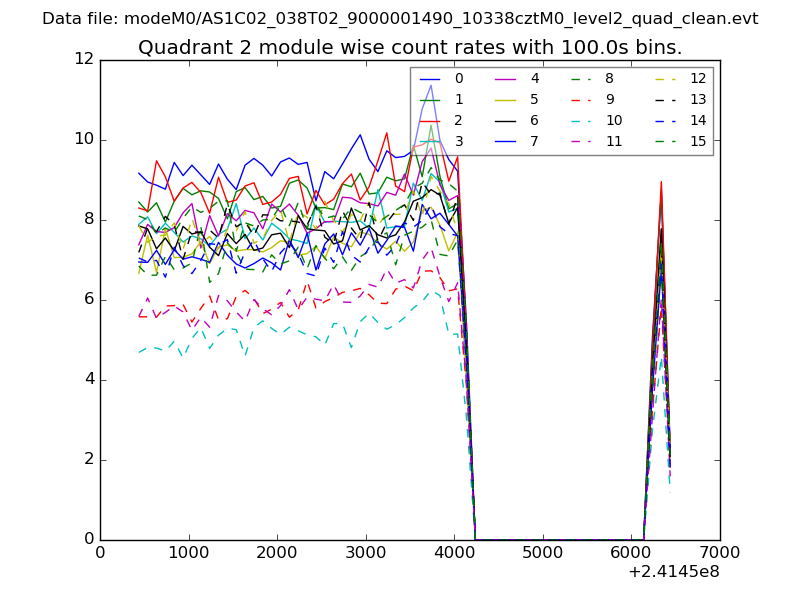
| Module-wise count rates for Quadrant A Data is divided into 100 sec bins |
 |
 |
| Module-wise count rates for Quadrant B Data is divided into 100 sec bins |
 |
 |
| Module-wise count rates for Quadrant C Data is divided into 100 sec bins |
 |
 |
| Module-wise count rates for Quadrant D Data is divided into 100 sec bins |
 |
 |
| Parameter | Plot |
|---|---|
| CZT HV Monitor | 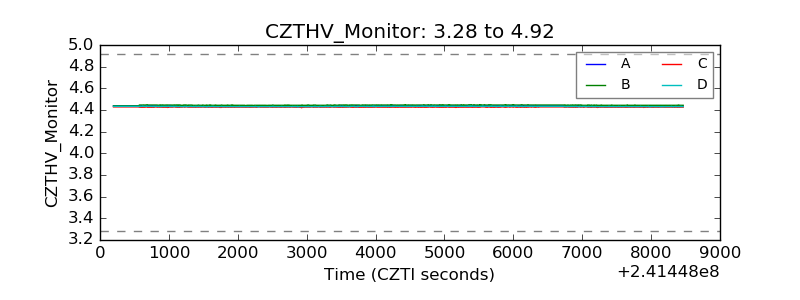 |
| D_VDD |  |
| Temperature 1 | 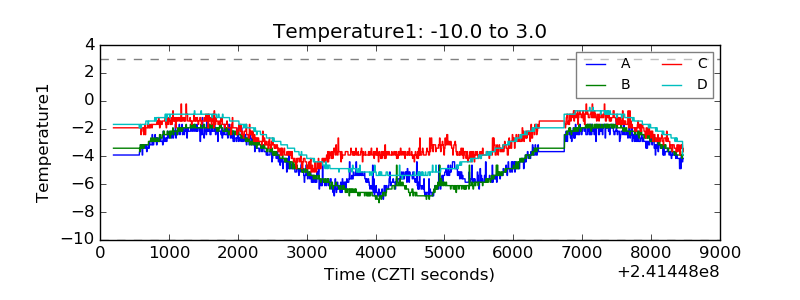 |
| Veto HV Monitor | 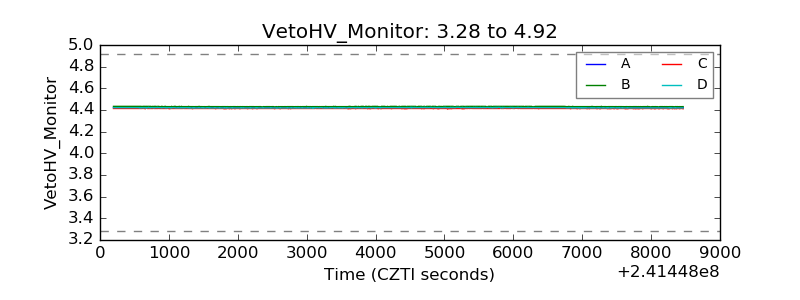 |
| Veto LLD |  |
| Alpha Counter | 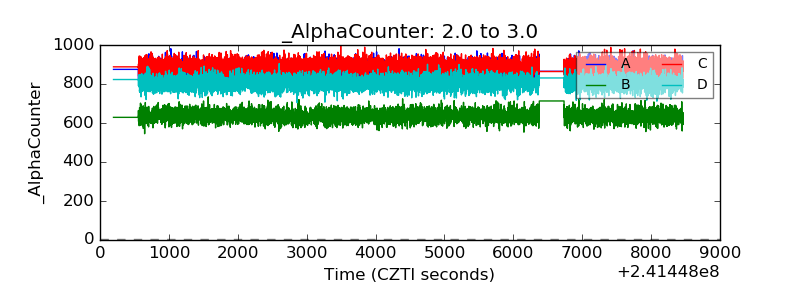 |
| _CPM_Rate | 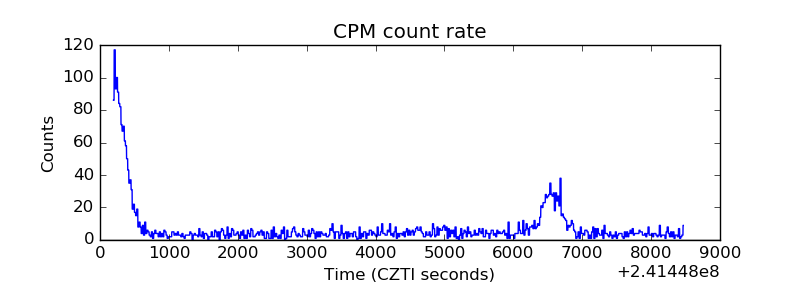 |
| CZT Counter | 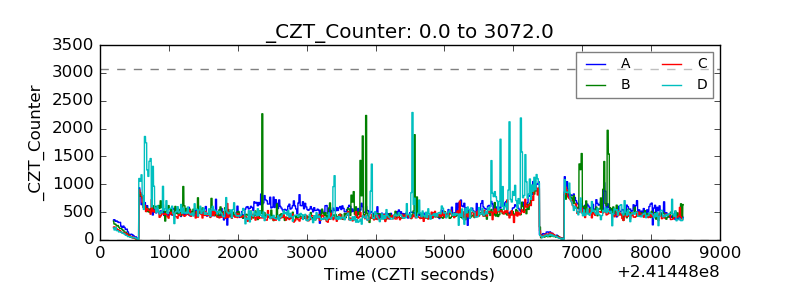 |
| +2.5 Volts monitor |  |
| +5 Volts monitor |  |
| _ROLL_ROT | 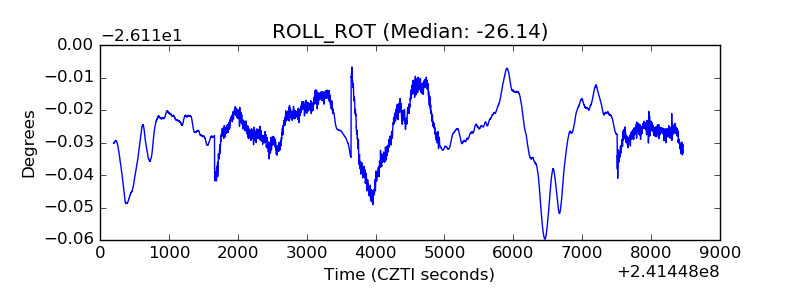 |
| _Roll_DEC | 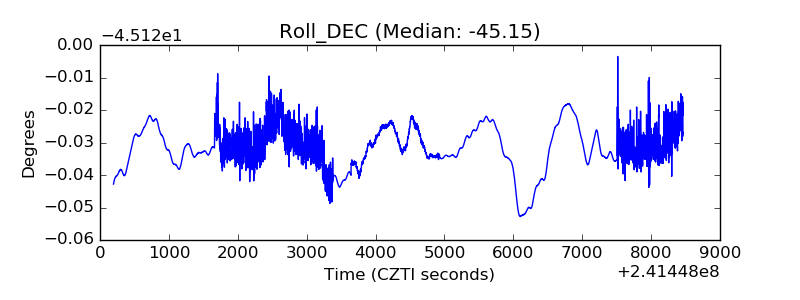 |
| _Roll_RA | 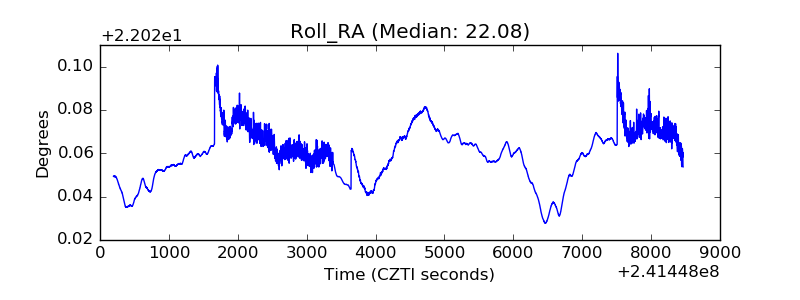 |
| Veto Counter | 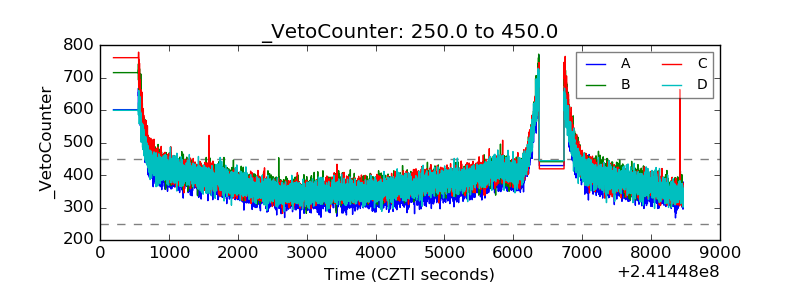 |