| Param | Original file | Final file |
|---|---|---|
| Filename | modeM0/AS1C02_038T02_9000001490_10339cztM0_level2.evt | modeM0/AS1C02_038T02_9000001490_10339cztM0_level2_quad_clean.evt |
| Size (bytes) | 500,215,680 | 82,183,680 |
| Size | 477.0 MB | 78.4 MB |
| Events in quadrant A | 3,943,188 | 497,092 |
| Events in quadrant B | 3,828,481 | 499,482 |
| Events in quadrant C | 3,273,179 | 499,360 |
| Events in quadrant D | 3,606,192 | 482,412 |
| Mode M9 | |||
|---|---|---|---|
| Quadrant | BADHDUFLAG | Total packets | Discarded packets |
| A | 0 | 2 | 0 |
| B | 0 | 2 | 0 |
| C | 0 | 2 | 0 |
| D | 0 | 2 | 0 |
| Mode SS | |||
|---|---|---|---|
| Quadrant | BADHDUFLAG | Total packets | Discarded packets |
| A | 0 | 148 | 0 |
| B | 0 | 148 | 0 |
| C | 0 | 148 | 0 |
| D | 0 | 148 | 0 |
| Mode M0 | |||
|---|---|---|---|
| Quadrant | BADHDUFLAG | Total packets | Discarded packets |
| A | 0 | 16750 | 2 |
| B | 0 | 16172 | 1 |
| C | 0 | 14990 | 4 |
| D | 0 | 15752 | 3 |
| Quadrant | Total seconds | Saturated seconds | Saturation percentage |
|---|---|---|---|
| A | 7333 | 151 | 2.059185% |
| B | 7333 | 207 | 2.822856% |
| C | 7332 | 48 | 0.654664% |
| D | 7332 | 55 | 0.750136% |
Noise dominated data is calculated using 1-second bins in cleaned event files. If a bin has >2000 counts, and if more than 50% of those come from <1% of pixels, then it is considered to be noise-dominated and hence unusable.
| Quadrant | # 1 sec bins | Bins with >0 counts | Bins with >2000 counts | High rate bins dominated by noise | Noise dominated (total time) | Noise dominated (detector-on time) | Marked lightcurve |
|---|---|---|---|---|---|---|---|
| A | 7518 | 7334 | 1 | 1 | 0.01% | 0.01% | 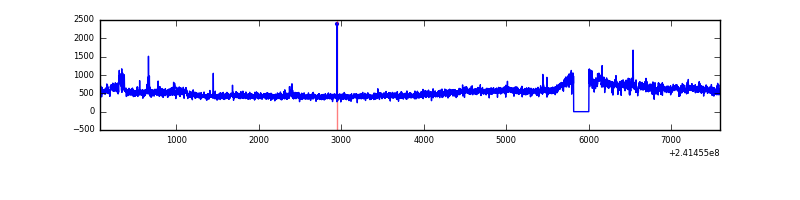 |
| B | 7518 | 7333 | 51 | 51 | 0.68% | 0.70% | 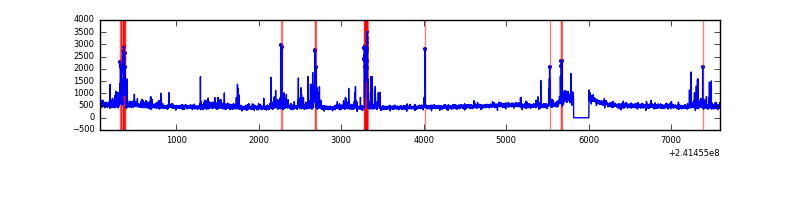 |
| C | 7518 | 7334 | 0 | 0 | 0.00% | 0.00% | 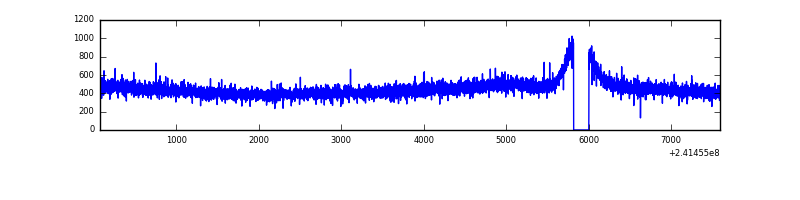 |
| D | 7518 | 7334 | 14 | 14 | 0.19% | 0.19% | 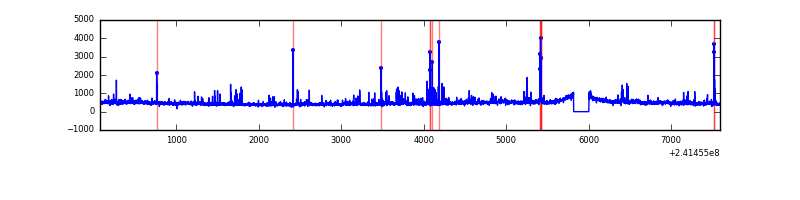 |
Top three noisy pixels from each quadrant. If the there are fewer than three noisy pixels in the level2.evt file, extra rows are filled as -1
| Pixel properties | Quadrant properties | ||||||
|---|---|---|---|---|---|---|---|
| Quadrant | DetID | PixID | Counts | Sigma | Mean | Median | Sigma |
| A | 8 | 15 | 588859 | 3305.62 | 861 | 842 | 177.9 |
| A | 13 | 251 | 17806 | 95.37 | 861 | 842 | 177.9 |
| A | 15 | 174 | 15710 | 83.58 | 861 | 842 | 177.9 |
| B | 4 | 239 | 265601 | 1606.33 | 862 | 840 | 164.8 |
| B | 11 | 51 | 83182 | 499.58 | 862 | 840 | 164.8 |
| B | 0 | 219 | 66625 | 399.12 | 862 | 840 | 164.8 |
| C | 13 | 61 | 6280 | 28.08 | 838 | 842 | 193.7 |
| C | 14 | 234 | 3551 | 13.99 | 838 | 842 | 193.7 |
| C | 3 | 202 | 2070 | 6.34 | 838 | 842 | 193.7 |
| D | 8 | 195 | 143549 | 706.41 | 835 | 809 | 202.1 |
| D | 1 | 20 | 141657 | 697.05 | 835 | 809 | 202.1 |
| D | 2 | 14 | 45891 | 223.11 | 835 | 809 | 202.1 |
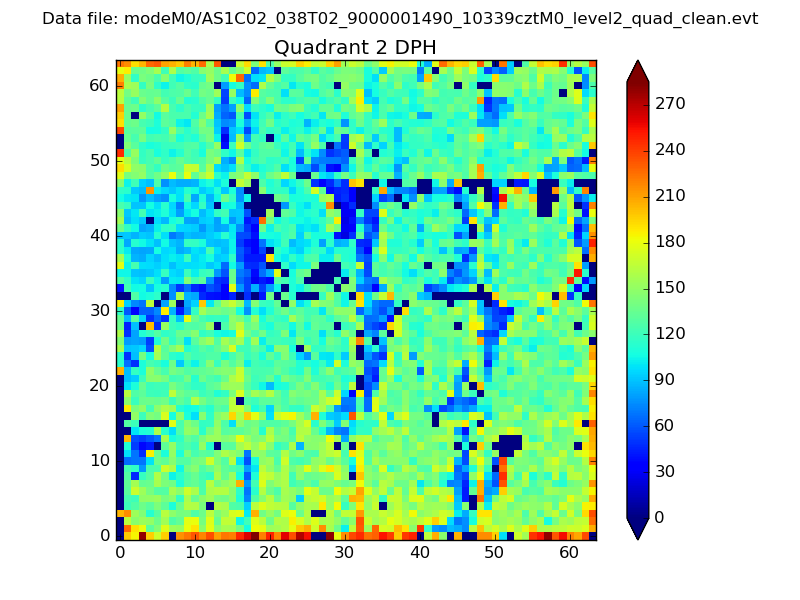
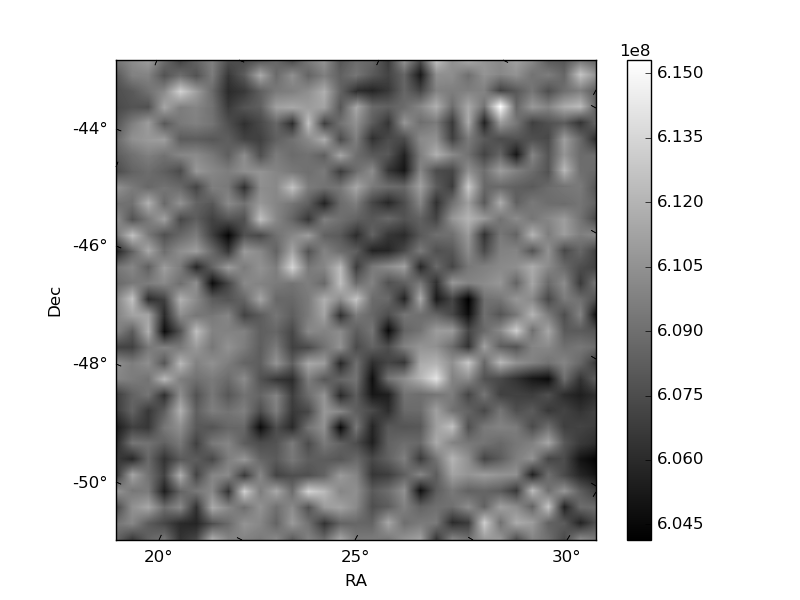
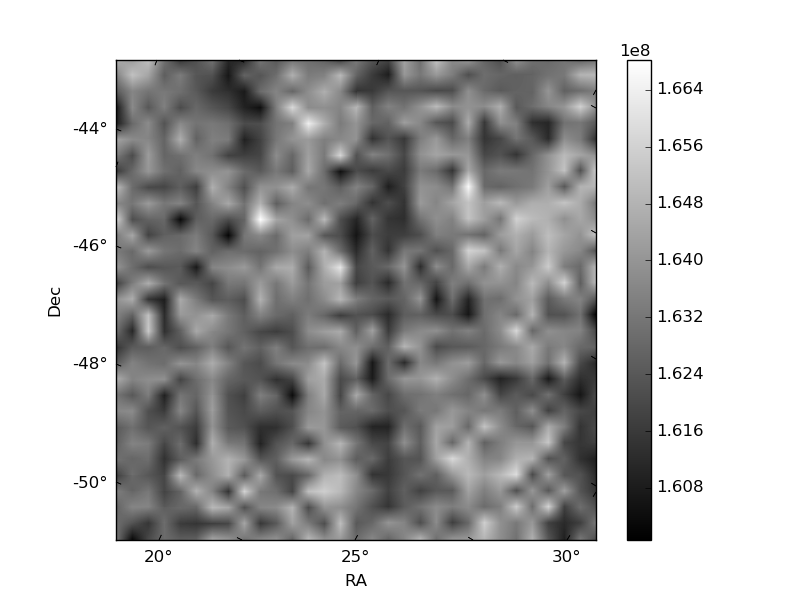
Histogram calculated using DETX and DETY for each event in the final _common_clean file
| Quadrant A | 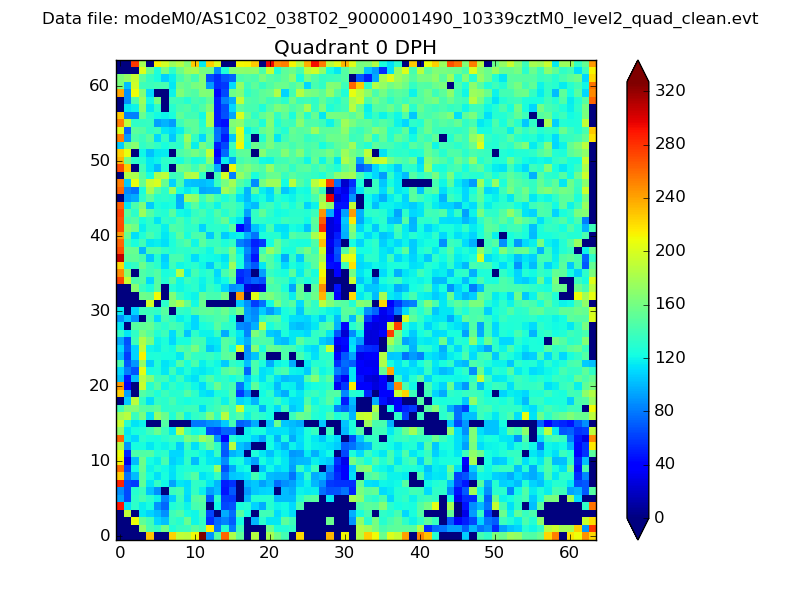 |
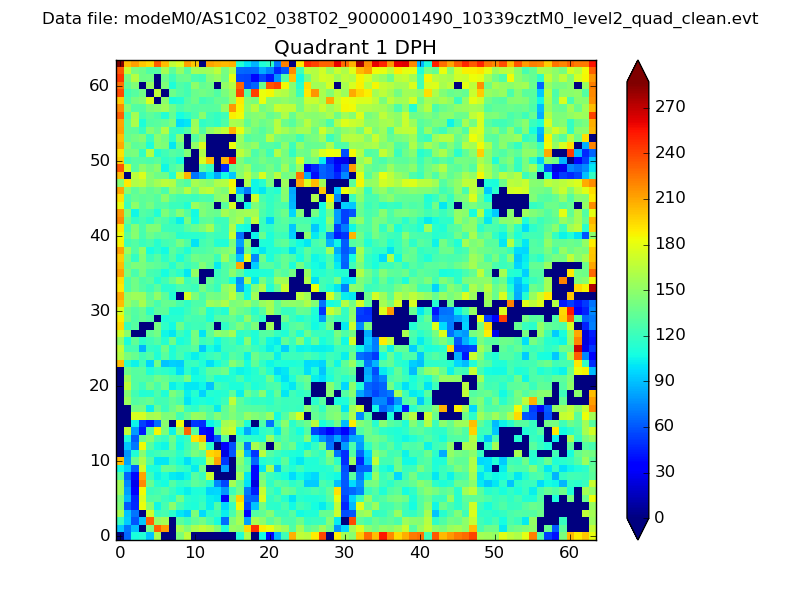 |
Quadrant B |
|---|---|---|---|
| Quadrant D | 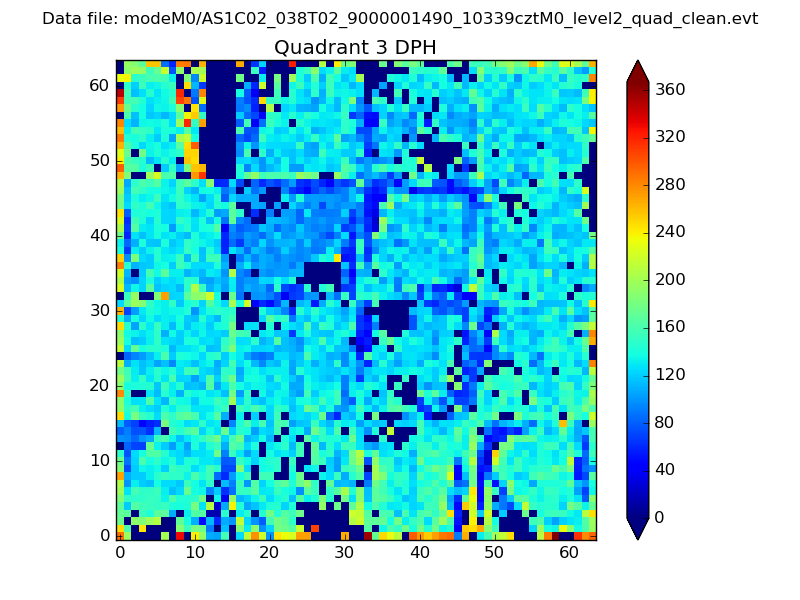 |
 |
Quadrant C |
| Plot type | Count rate plots | Images |
|---|---|---|
| Comparison with Poisson distribution Blue bars denote a histogram of data divided into 1 sec bins. Red curve is a Poisson curve with rate = median count rate of data. |
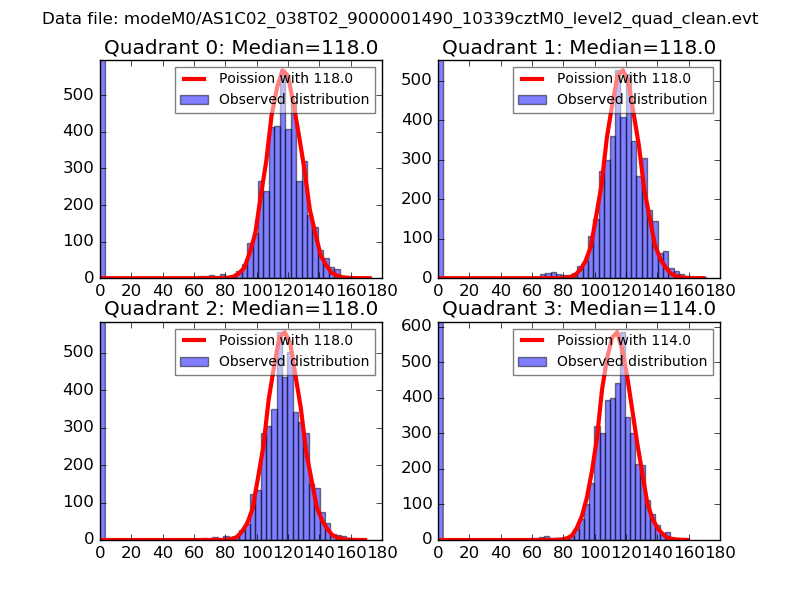 |
 |
| Quadrant-wise count rates Data is divided into 100 sec bins |
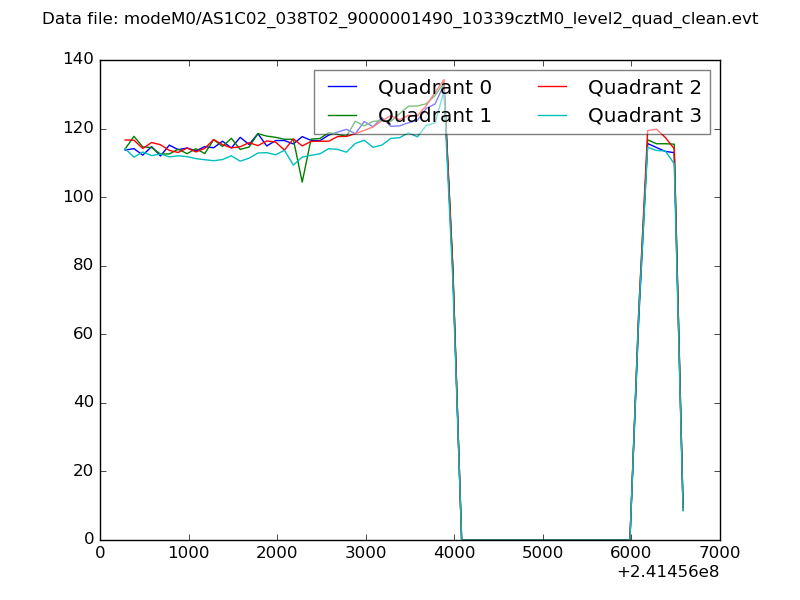 |
|
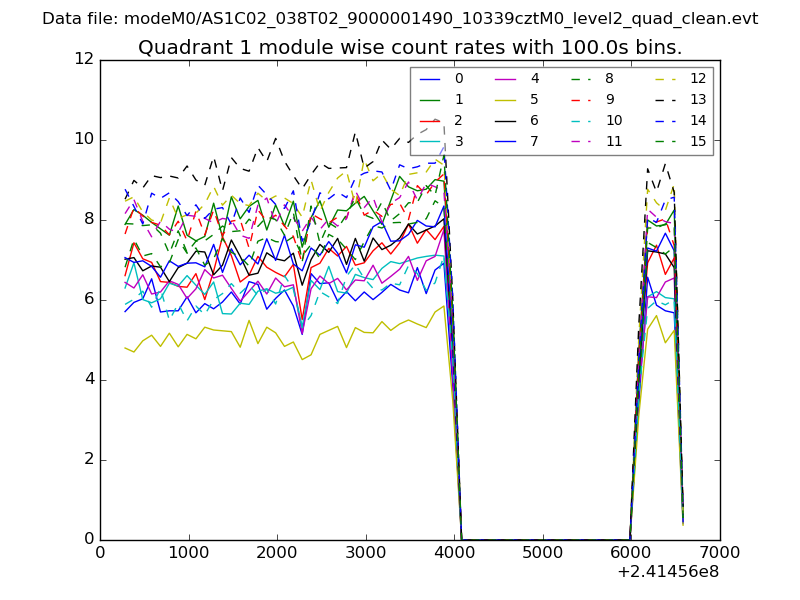
| Module-wise count rates for Quadrant A Data is divided into 100 sec bins |
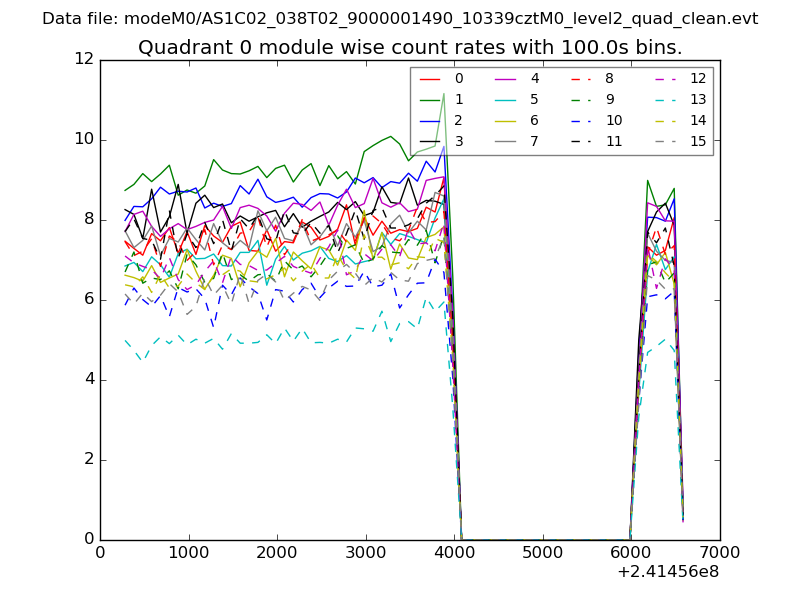 |
 |
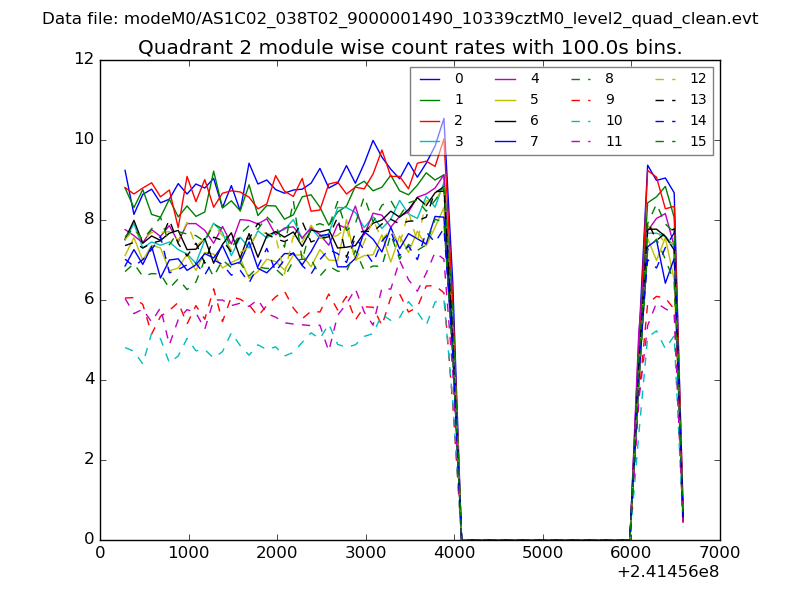
| Module-wise count rates for Quadrant B Data is divided into 100 sec bins |
 |
 |
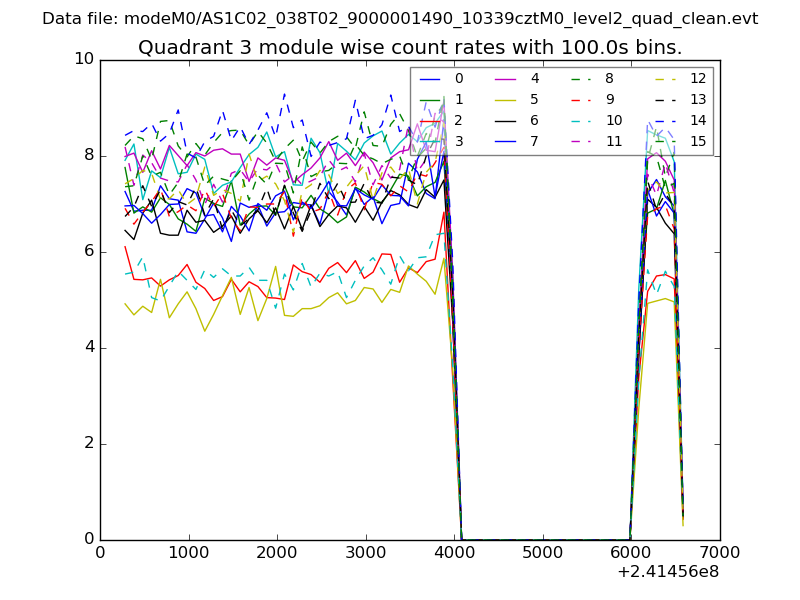
| Module-wise count rates for Quadrant C Data is divided into 100 sec bins |
 |
 |
| Module-wise count rates for Quadrant D Data is divided into 100 sec bins |
 |
 |
| Parameter | Plot |
|---|---|
| CZT HV Monitor | 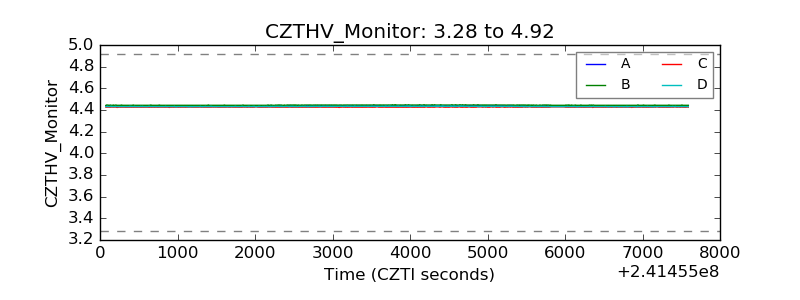 |
| D_VDD | 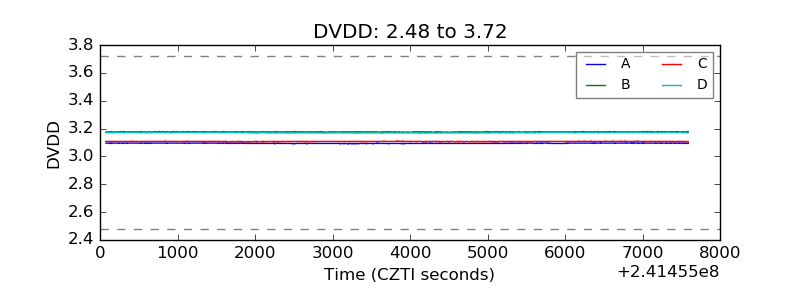 |
| Temperature 1 | 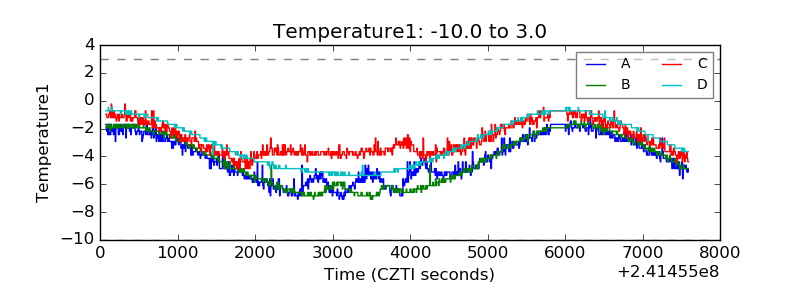 |
| Veto HV Monitor | 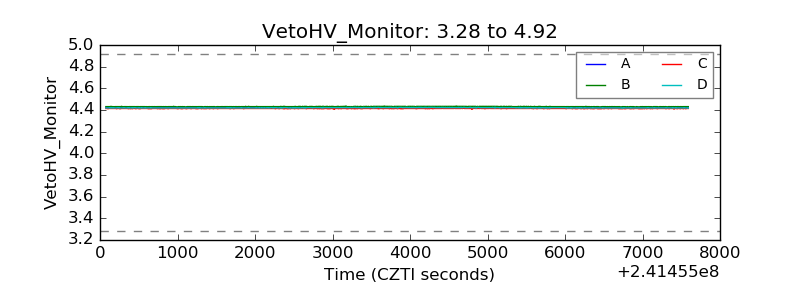 |
| Veto LLD | 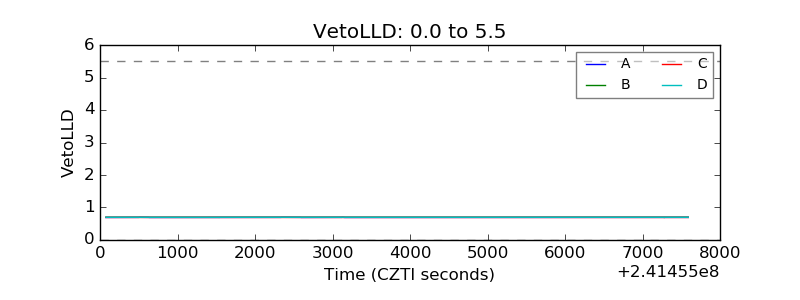 |
| Alpha Counter | 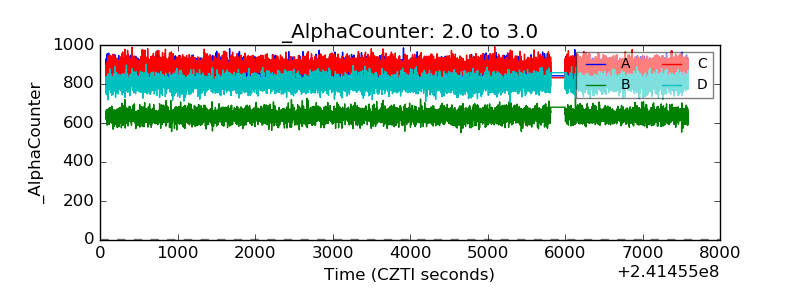 |
| _CPM_Rate | 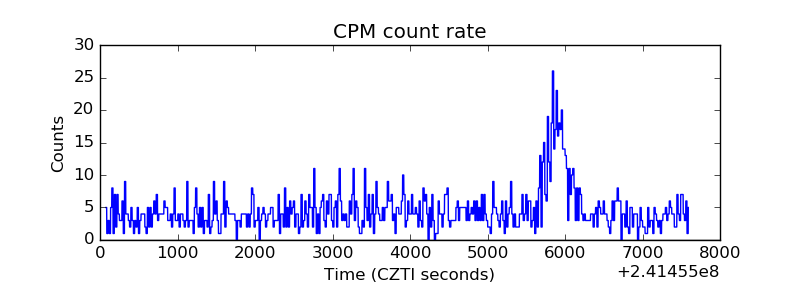 |
| CZT Counter | 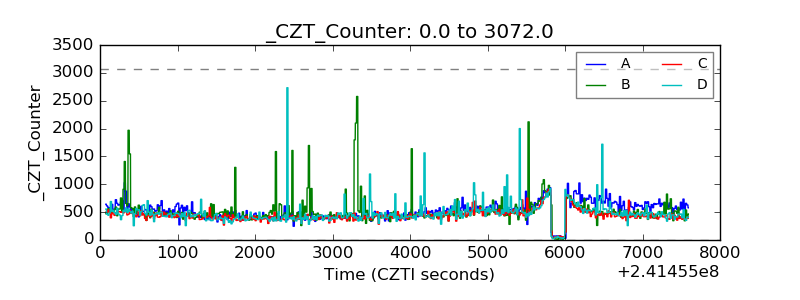 |
| +2.5 Volts monitor |  |
| +5 Volts monitor |  |
| _ROLL_ROT | 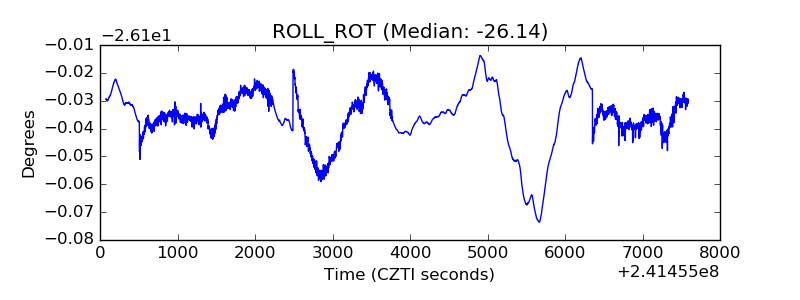 |
| _Roll_DEC | 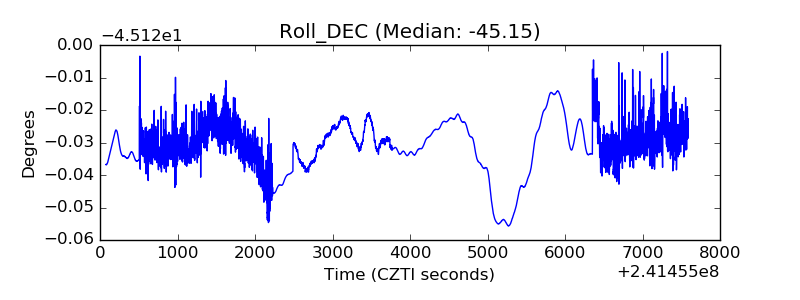 |
| _Roll_RA | 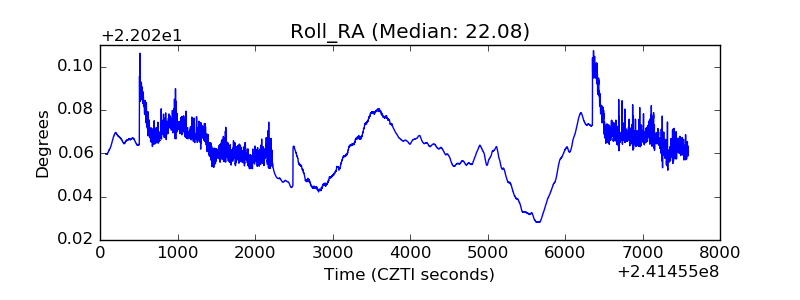 |
| Veto Counter |  |