| Param | Original file | Final file |
|---|---|---|
| Filename | modeM0/AS1C02_038T02_9000001490_10340cztM0_level2.evt | modeM0/AS1C02_038T02_9000001490_10340cztM0_level2_quad_clean.evt |
| Size (bytes) | 459,498,240 | 77,031,360 |
| Size | 438.2 MB | 73.5 MB |
| Events in quadrant A | 3,444,137 | 446,842 |
| Events in quadrant B | 3,153,856 | 452,038 |
| Events in quadrant C | 2,967,552 | 455,624 |
| Events in quadrant D | 3,890,162 | 507,815 |
| Mode M9 | |||
|---|---|---|---|
| Quadrant | BADHDUFLAG | Total packets | Discarded packets |
| A | 0 | 10 | 5 |
| B | 0 | 10 | 5 |
| C | 0 | 10 | 5 |
| D | 0 | 9 | 4 |
| Mode SS | |||
|---|---|---|---|
| Quadrant | BADHDUFLAG | Total packets | Discarded packets |
| A | 0 | 330 | 178 |
| B | 0 | 330 | 173 |
| C | 0 | 330 | 184 |
| D | 0 | 317 | 164 |
| Mode M0 | |||
|---|---|---|---|
| Quadrant | BADHDUFLAG | Total packets | Discarded packets |
| A | 0 | 37313 | 23051 |
| B | 0 | 35322 | 21701 |
| C | 0 | 33246 | 19704 |
| D | 0 | 35120 | 18665 |
| Quadrant | Total seconds | Saturated seconds | Saturation percentage |
|---|---|---|---|
| A | 6181 | 76 | 1.229575% |
| B | 6449 | 83 | 1.287021% |
| C | 6650 | 26 | 0.390977% |
| D | 7638 | 35 | 0.458235% |
Noise dominated data is calculated using 1-second bins in cleaned event files. If a bin has >2000 counts, and if more than 50% of those come from <1% of pixels, then it is considered to be noise-dominated and hence unusable.
| Quadrant | # 1 sec bins | Bins with >0 counts | Bins with >2000 counts | High rate bins dominated by noise | Noise dominated (total time) | Noise dominated (detector-on time) | Marked lightcurve |
|---|---|---|---|---|---|---|---|
| A | 8668 | 7421 | 0 | 0 | 0.00% | 0.00% | 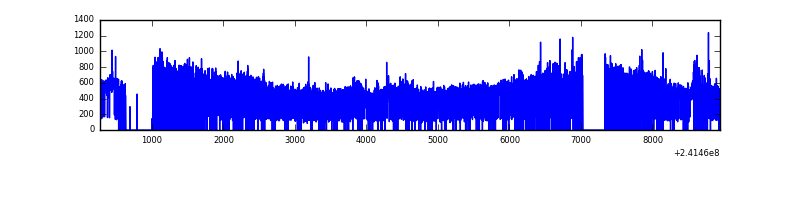 |
| B | 8670 | 7620 | 1 | 1 | 0.01% | 0.01% |  |
| C | 8670 | 7764 | 0 | 0 | 0.00% | 0.00% | 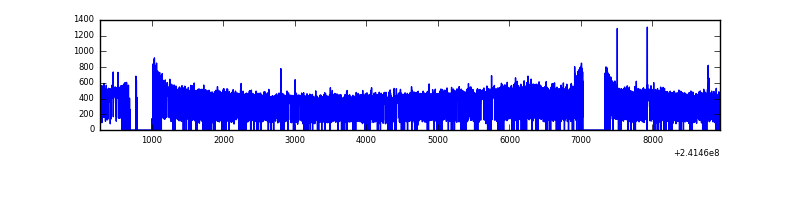 |
| D | 8670 | 7945 | 4 | 4 | 0.05% | 0.05% | 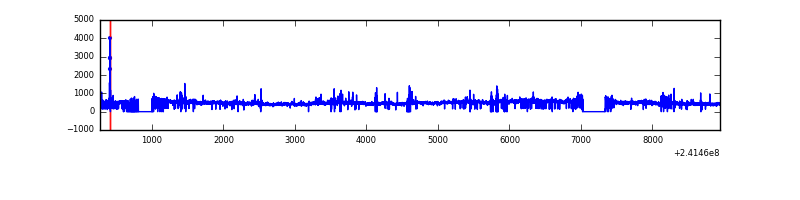 |
Top three noisy pixels from each quadrant. If the there are fewer than three noisy pixels in the level2.evt file, extra rows are filled as -1
| Pixel properties | Quadrant properties | ||||||
|---|---|---|---|---|---|---|---|
| Quadrant | DetID | PixID | Counts | Sigma | Mean | Median | Sigma |
| A | 8 | 15 | 626979 | 4212.6 | 716 | 699 | 148.7 |
| A | 8 | 5 | 22655 | 147.68 | 716 | 699 | 148.7 |
| A | 13 | 251 | 21847 | 142.25 | 716 | 699 | 148.7 |
| B | 0 | 219 | 82674 | 561.45 | 756 | 736 | 145.9 |
| B | 4 | 239 | 66516 | 450.73 | 756 | 736 | 145.9 |
| B | 11 | 51 | 21941 | 145.3 | 756 | 736 | 145.9 |
| C | 14 | 234 | 8981 | 46.49 | 759 | 760 | 176.8 |
| C | 13 | 61 | 5609 | 27.42 | 759 | 760 | 176.8 |
| C | 3 | 202 | 1933 | 6.63 | 759 | 760 | 176.8 |
| D | 8 | 195 | 354241 | 1674.65 | 869 | 844 | 211.0 |
| D | 1 | 20 | 66345 | 310.39 | 869 | 844 | 211.0 |
| D | 2 | 33 | 58454 | 273.0 | 869 | 844 | 211.0 |
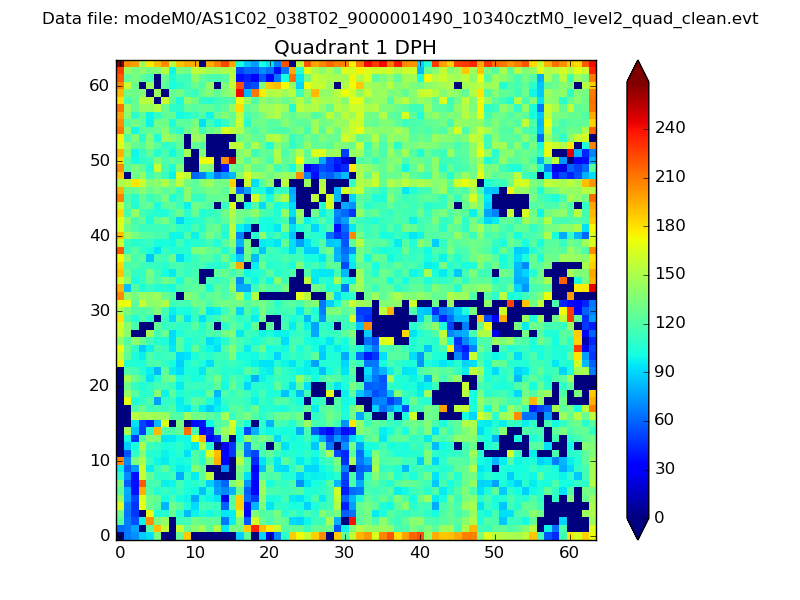
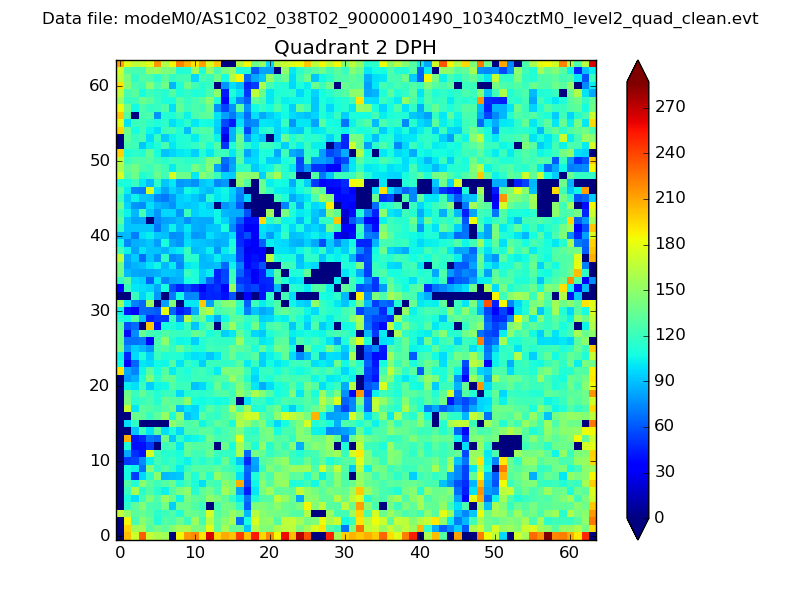
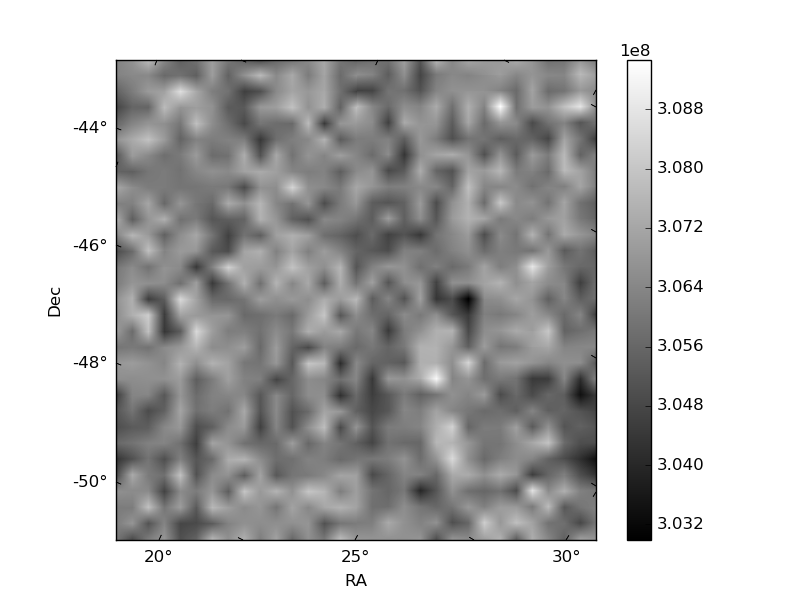
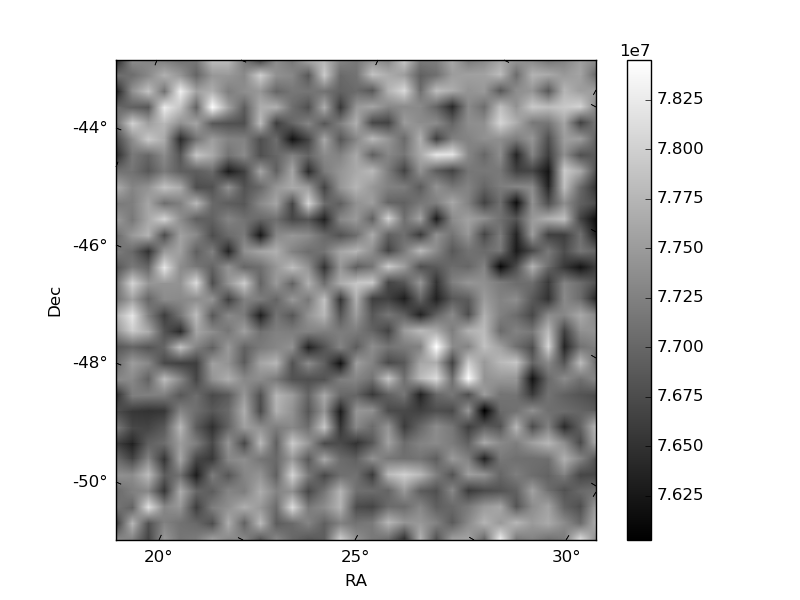
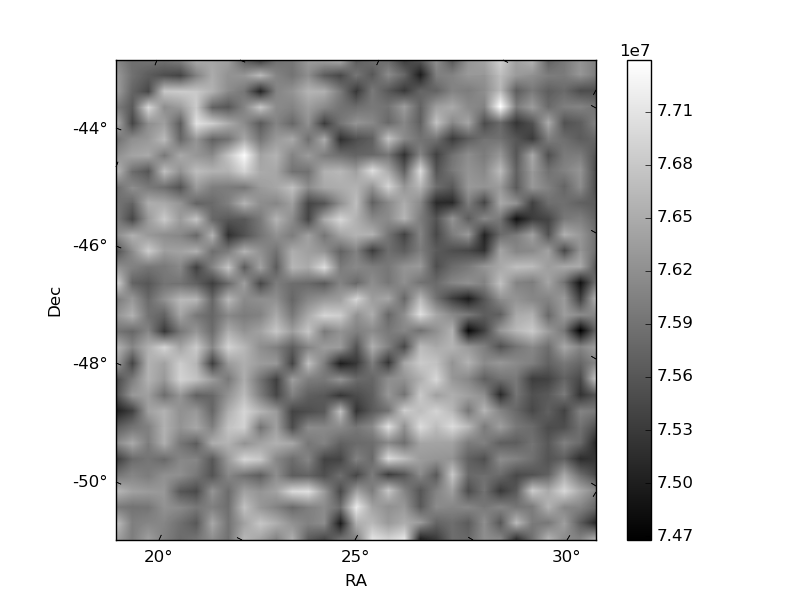
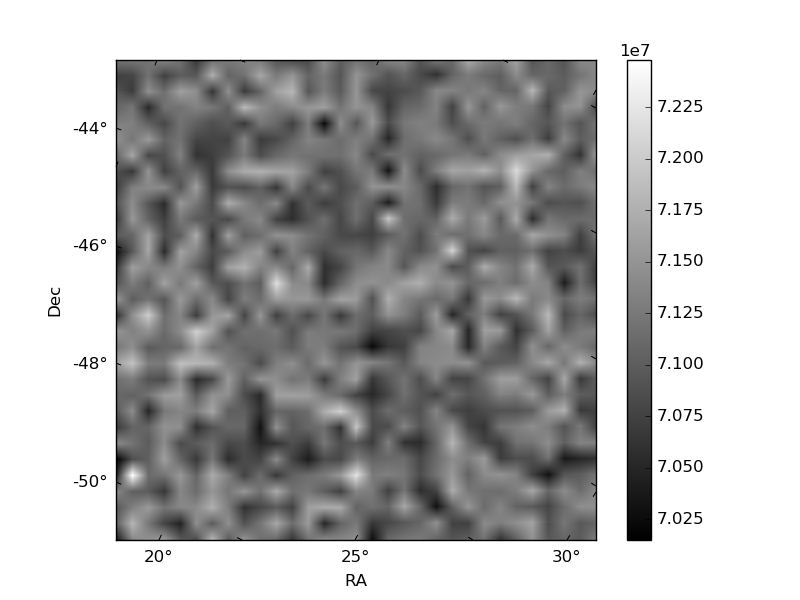
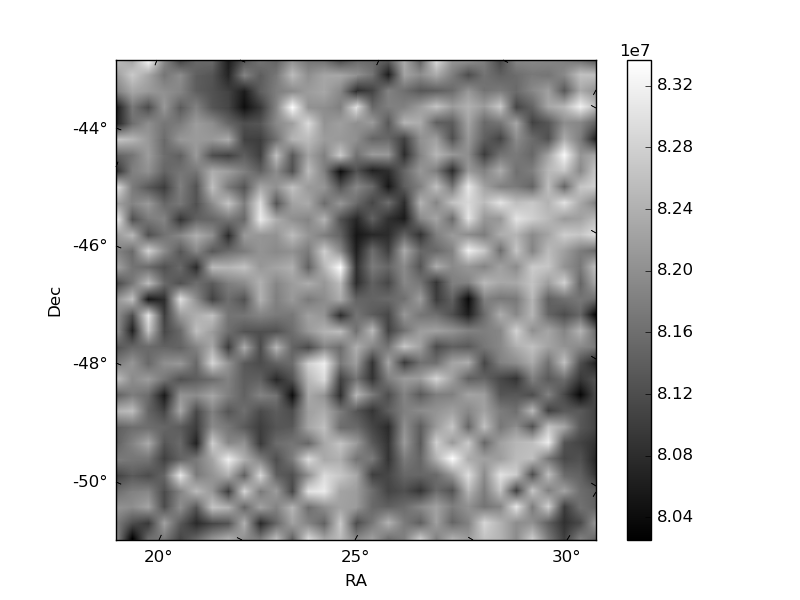
Histogram calculated using DETX and DETY for each event in the final _common_clean file
| Quadrant A | 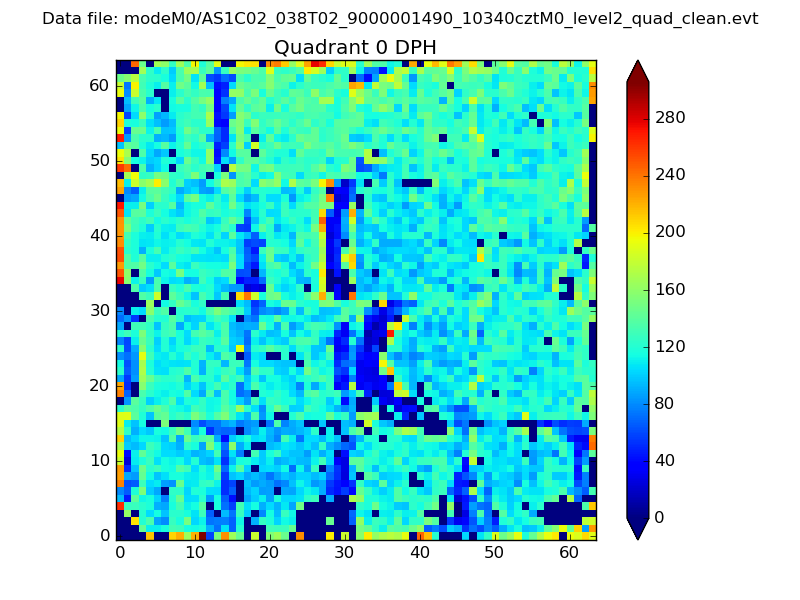 |
 |
Quadrant B |
|---|---|---|---|
| Quadrant D | 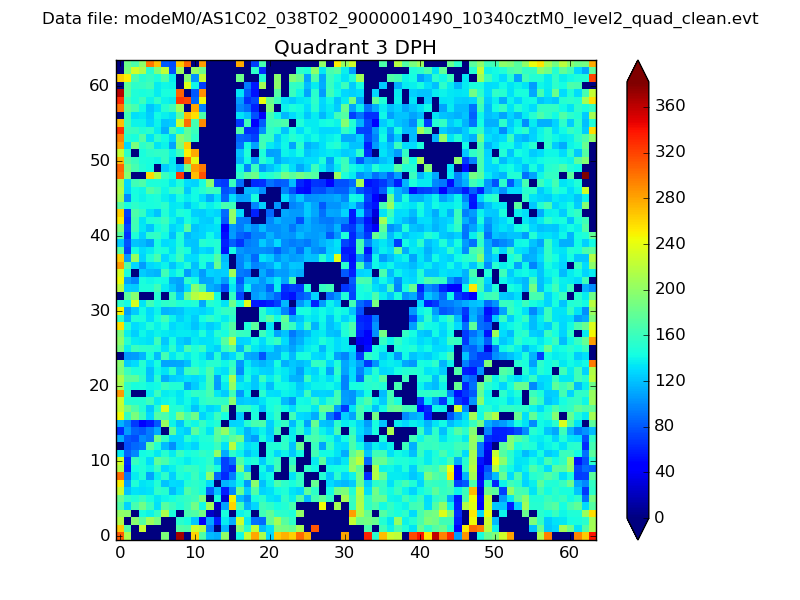 |
 |
Quadrant C |
| Plot type | Count rate plots | Images |
|---|---|---|
| Comparison with Poisson distribution Blue bars denote a histogram of data divided into 1 sec bins. Red curve is a Poisson curve with rate = median count rate of data. |
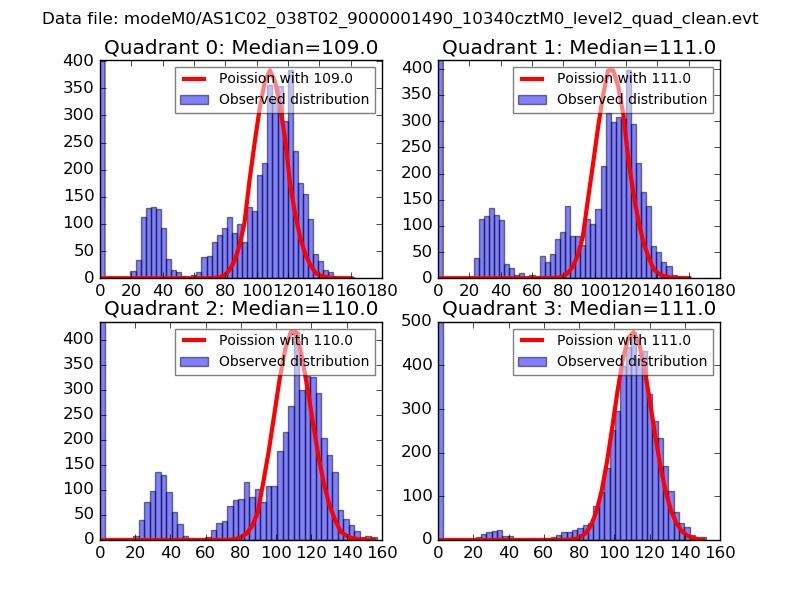 |
 |
| Quadrant-wise count rates Data is divided into 100 sec bins |
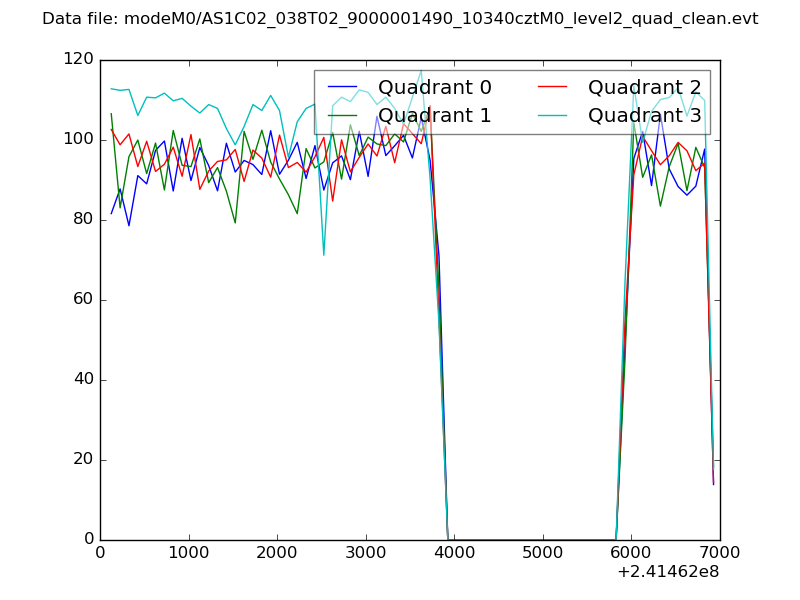 |
|
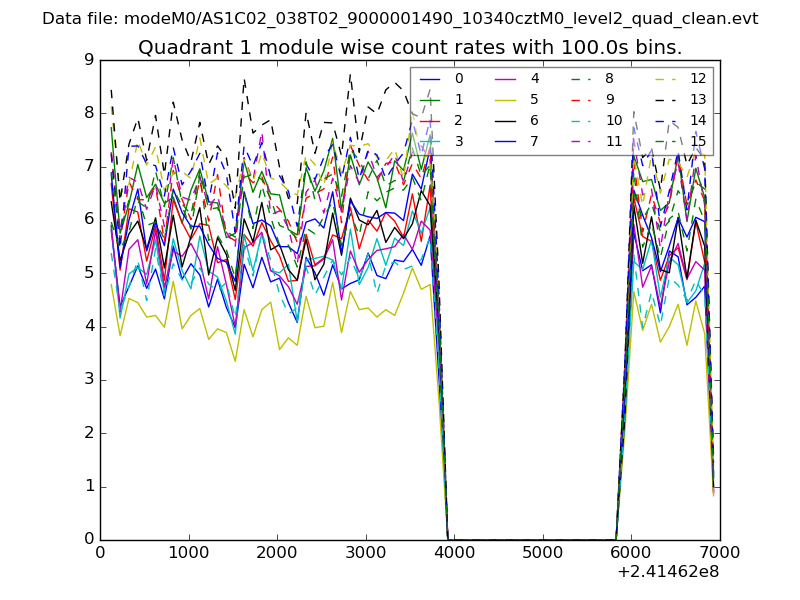
| Module-wise count rates for Quadrant A Data is divided into 100 sec bins |
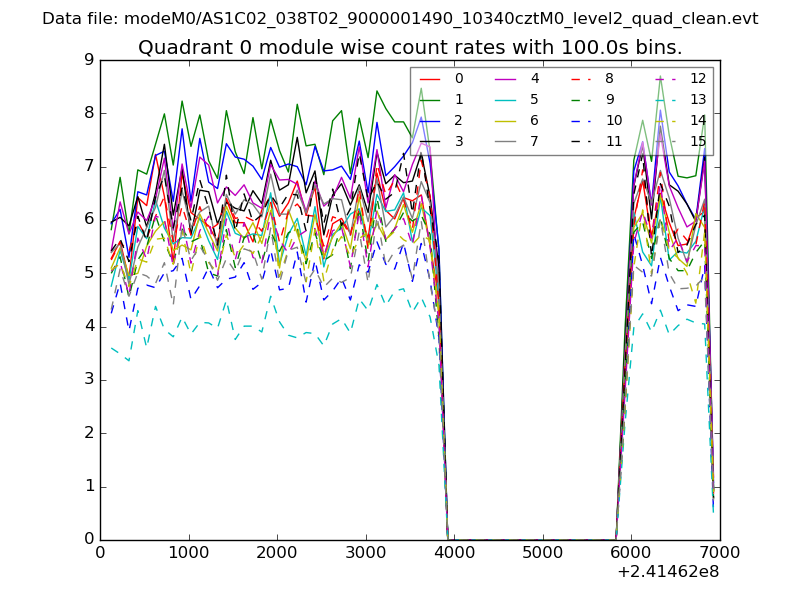 |
 |
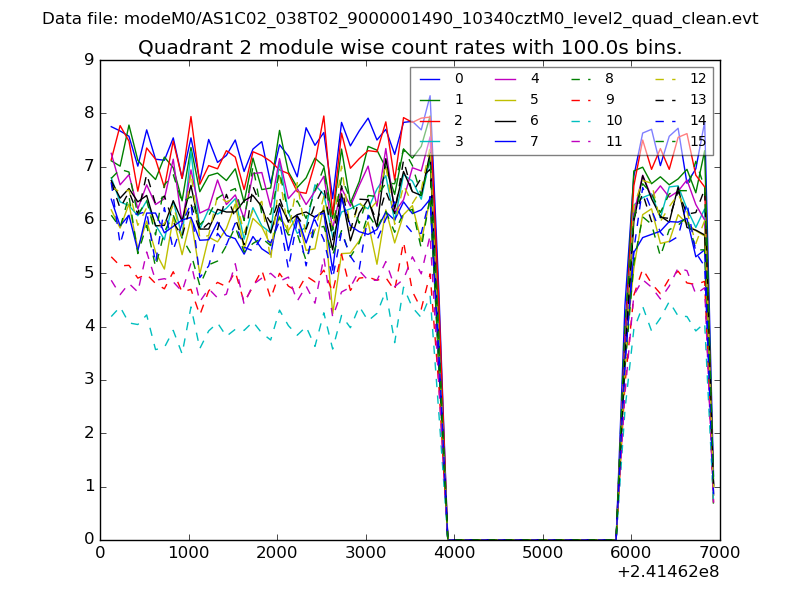
| Module-wise count rates for Quadrant B Data is divided into 100 sec bins |
 |
 |
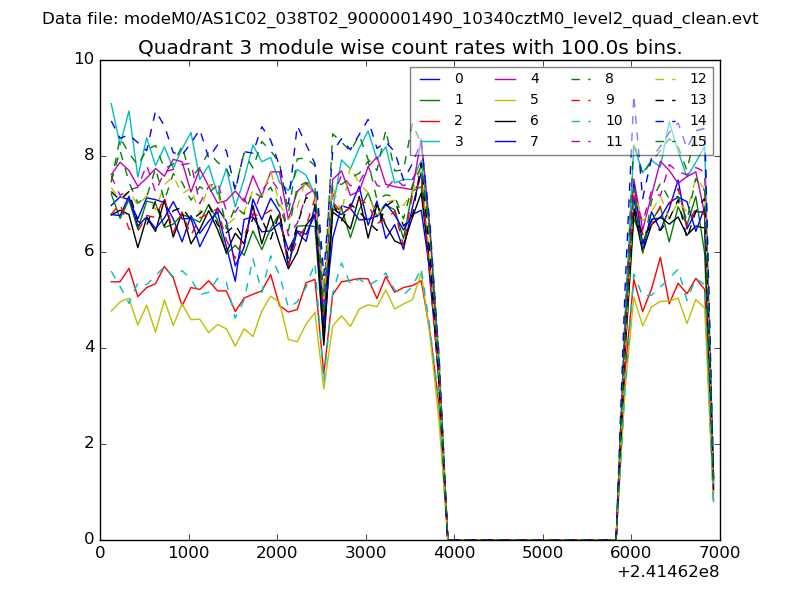
| Module-wise count rates for Quadrant C Data is divided into 100 sec bins |
 |
 |
| Module-wise count rates for Quadrant D Data is divided into 100 sec bins |
 |
 |
| Parameter | Plot |
|---|---|
| CZT HV Monitor | 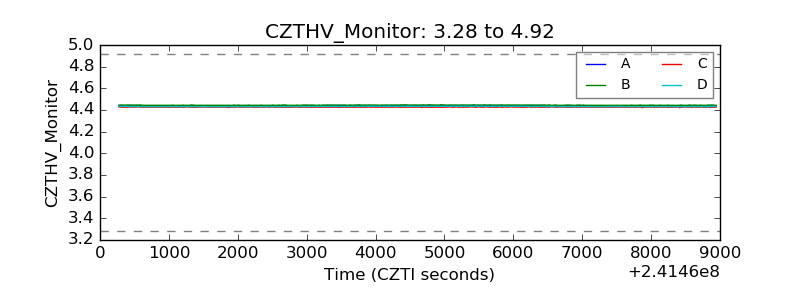 |
| D_VDD | 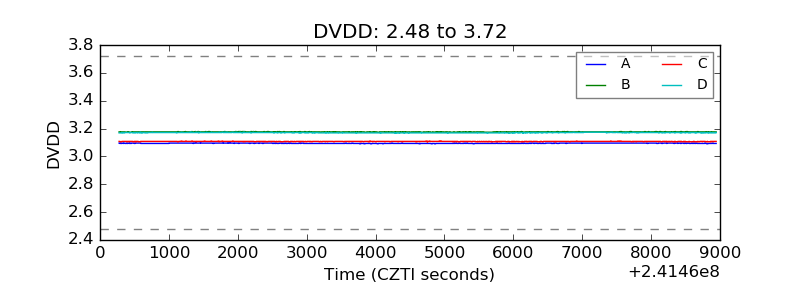 |
| Temperature 1 | 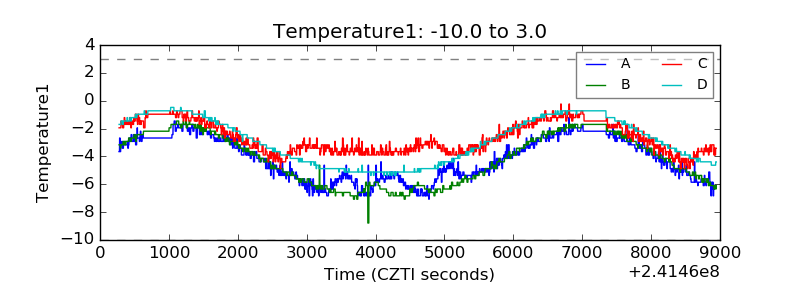 |
| Veto HV Monitor | 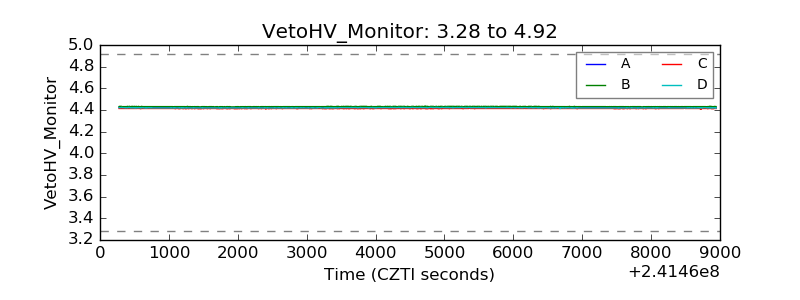 |
| Veto LLD |  |
| Alpha Counter | 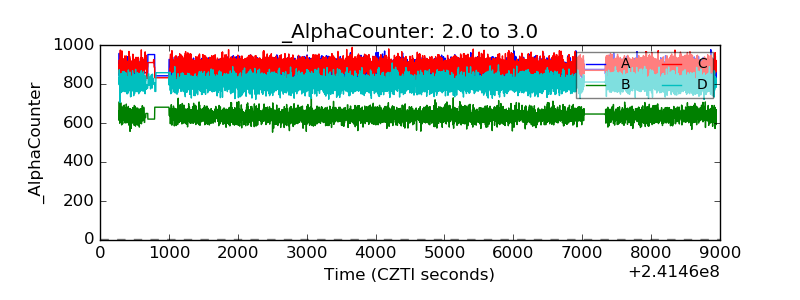 |
| _CPM_Rate | 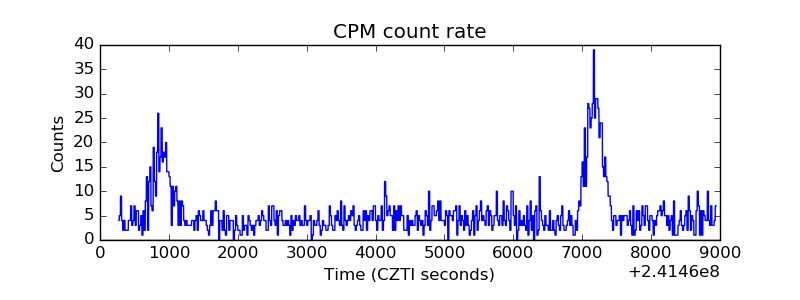 |
| CZT Counter | 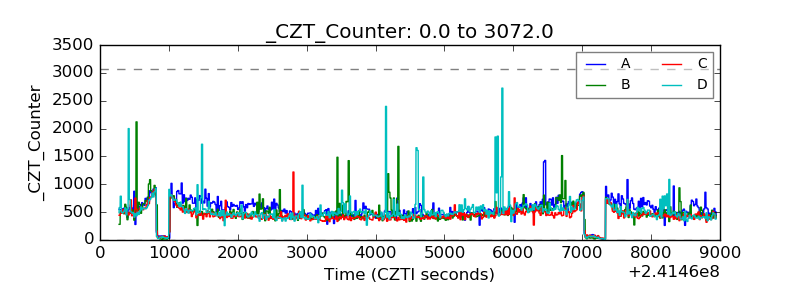 |
| +2.5 Volts monitor |  |
| +5 Volts monitor |  |
| _ROLL_ROT | 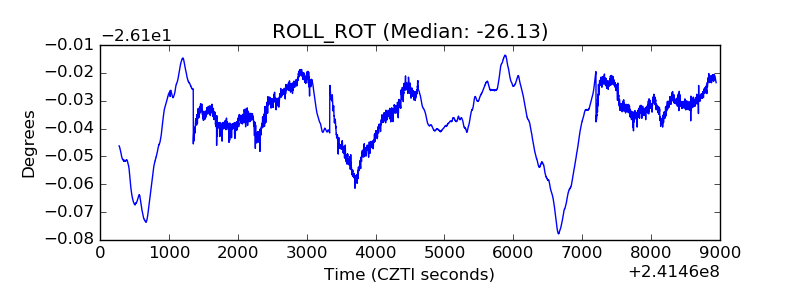 |
| _Roll_DEC | 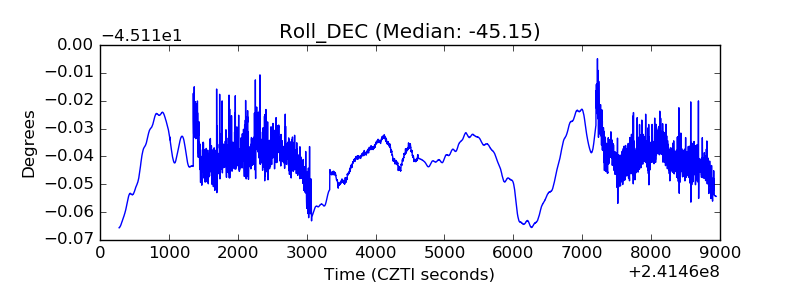 |
| _Roll_RA | 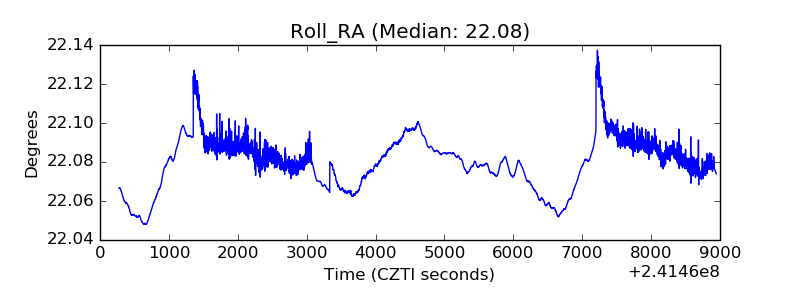 |
| Veto Counter | 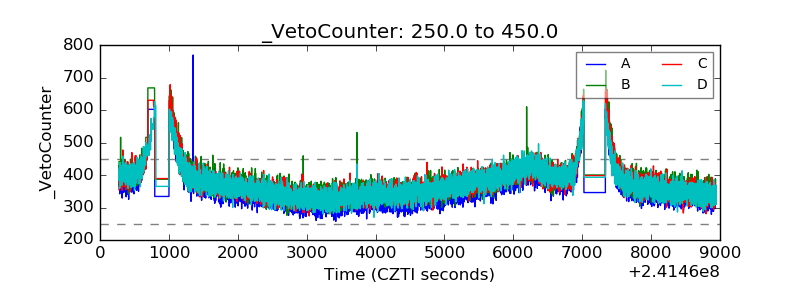 |