| Param | Original file | Final file |
|---|---|---|
| Filename | modeM0/AS1C02_038T02_9000001490_10344cztM0_level2.evt | modeM0/AS1C02_038T02_9000001490_10344cztM0_level2_quad_clean.evt |
| Size (bytes) | 1,634,172,480 | 293,653,440 |
| Size | 1.5 GB | 280.0 MB |
| Events in quadrant A | 11,150,067 | 1,829,078 |
| Events in quadrant B | 12,444,921 | 1,848,773 |
| Events in quadrant C | 10,446,022 | 1,840,676 |
| Events in quadrant D | 13,854,943 | 1,751,144 |
| Mode M9 | |||
|---|---|---|---|
| Quadrant | BADHDUFLAG | Total packets | Discarded packets |
| A | 0 | 32 | 0 |
| B | 0 | 32 | 0 |
| C | 0 | 32 | 0 |
| D | 0 | 32 | 0 |
| Mode SS | |||
|---|---|---|---|
| Quadrant | BADHDUFLAG | Total packets | Discarded packets |
| A | 0 | 478 | 0 |
| B | 0 | 478 | 0 |
| C | 0 | 478 | 0 |
| D | 0 | 478 | 0 |
| Mode M0 | |||
|---|---|---|---|
| Quadrant | BADHDUFLAG | Total packets | Discarded packets |
| A | 0 | 49054 | 5 |
| B | 0 | 53155 | 4 |
| C | 0 | 47742 | 4 |
| D | 0 | 56782 | 4 |
| Quadrant | Total seconds | Saturated seconds | Saturation percentage |
|---|---|---|---|
| A | 23616 | 80 | 0.338753% |
| B | 23616 | 371 | 1.570969% |
| C | 23616 | 48 | 0.203252% |
| D | 23616 | 447 | 1.892785% |
Noise dominated data is calculated using 1-second bins in cleaned event files. If a bin has >2000 counts, and if more than 50% of those come from <1% of pixels, then it is considered to be noise-dominated and hence unusable.
| Quadrant | # 1 sec bins | Bins with >0 counts | Bins with >2000 counts | High rate bins dominated by noise | Noise dominated (total time) | Noise dominated (detector-on time) | Marked lightcurve |
|---|---|---|---|---|---|---|---|
| A | 26741 | 23620 | 1 | 1 | 0.00% | 0.00% | 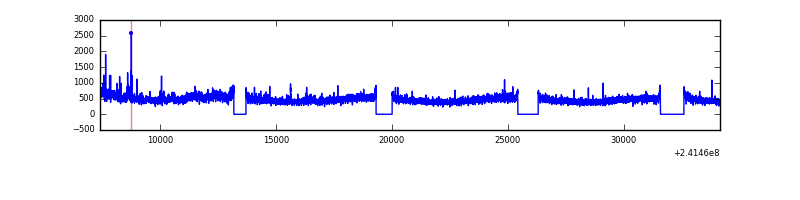 |
| B | 26741 | 23619 | 198 | 198 | 0.74% | 0.84% | 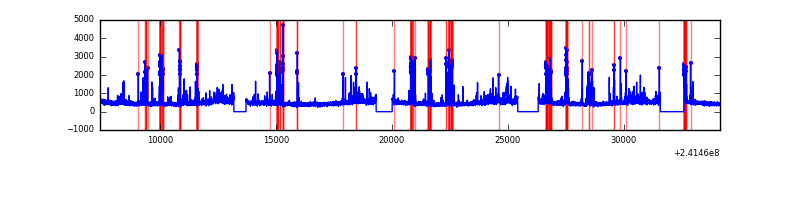 |
| C | 26741 | 23620 | 3 | 3 | 0.01% | 0.01% | 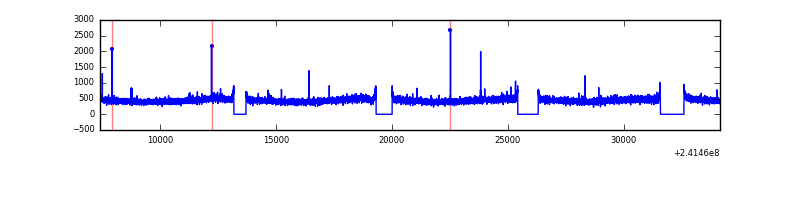 |
| D | 26741 | 23620 | 370 | 370 | 1.38% | 1.57% | 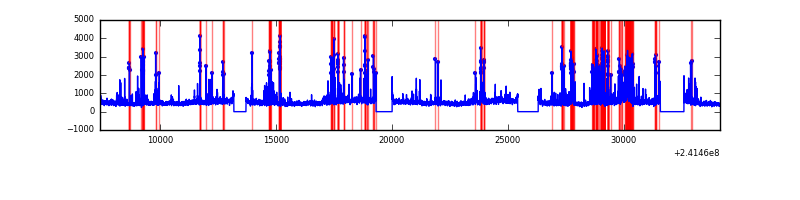 |
Top three noisy pixels from each quadrant. If the there are fewer than three noisy pixels in the level2.evt file, extra rows are filled as -1
| Pixel properties | Quadrant properties | ||||||
|---|---|---|---|---|---|---|---|
| Quadrant | DetID | PixID | Counts | Sigma | Mean | Median | Sigma |
| A | 8 | 15 | 427222 | 773.67 | 2712 | 2650 | 548.8 |
| A | 13 | 251 | 217275 | 391.1 | 2712 | 2650 | 548.8 |
| A | 8 | 5 | 66326 | 116.03 | 2712 | 2650 | 548.8 |
| B | 4 | 239 | 1275682 | 2475.85 | 2717 | 2645 | 514.2 |
| B | 11 | 51 | 218904 | 420.59 | 2717 | 2645 | 514.2 |
| B | 0 | 219 | 178402 | 341.82 | 2717 | 2645 | 514.2 |
| C | 14 | 234 | 29592 | 43.99 | 2664 | 2672 | 612.0 |
| C | 13 | 61 | 19994 | 28.3 | 2664 | 2672 | 612.0 |
| C | 8 | 128 | 14560 | 19.42 | 2664 | 2672 | 612.0 |
| D | 2 | 33 | 1480115 | 2357.95 | 2623 | 2548 | 626.6 |
| D | 8 | 195 | 1391243 | 2216.13 | 2623 | 2548 | 626.6 |
| D | 13 | 104 | 229335 | 361.91 | 2623 | 2548 | 626.6 |
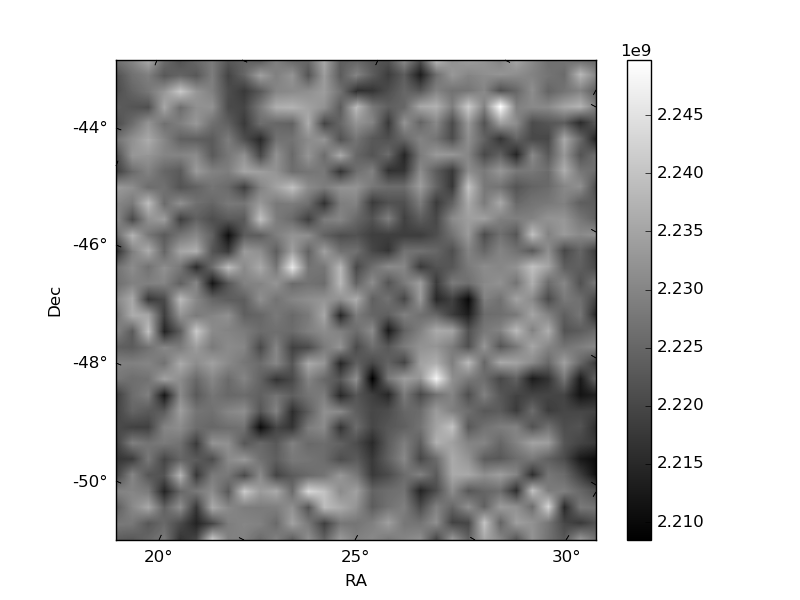
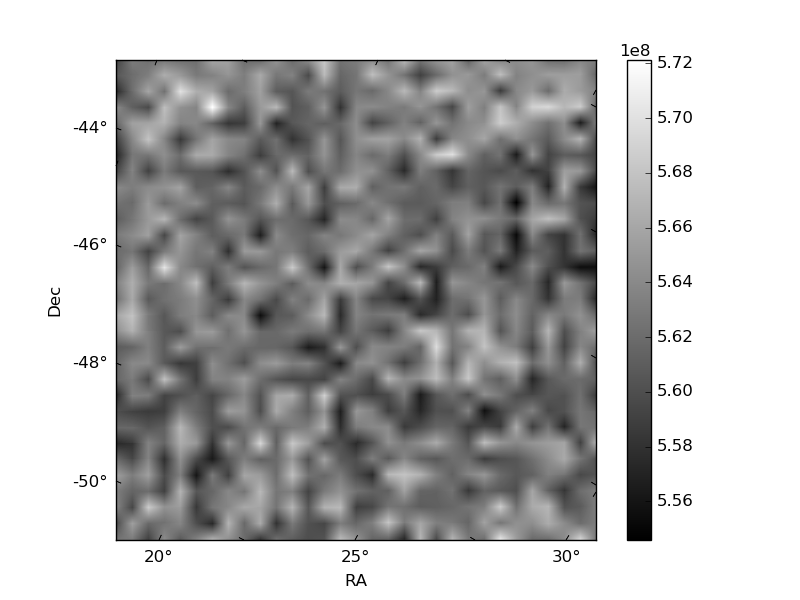
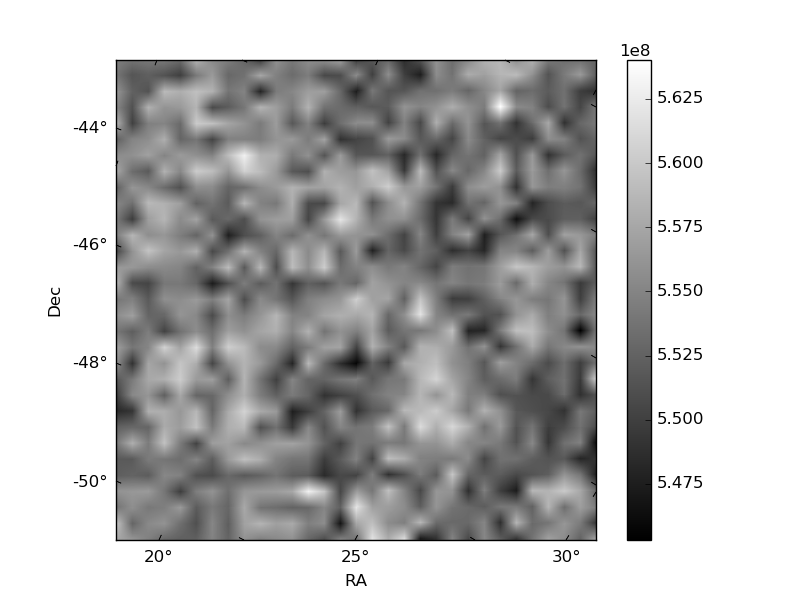
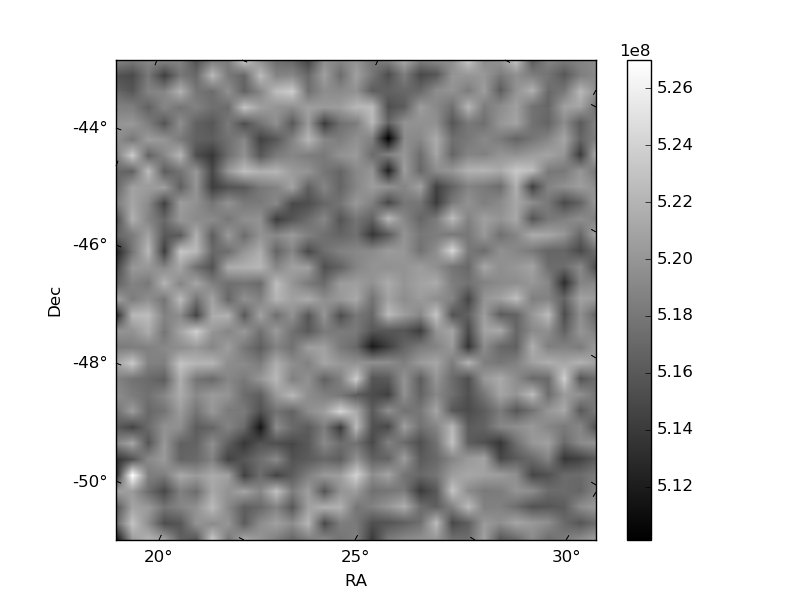
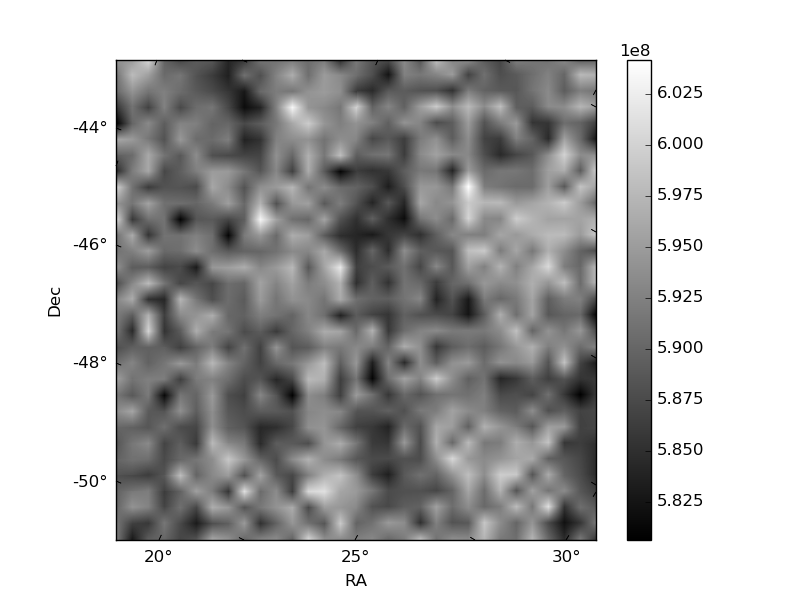
Histogram calculated using DETX and DETY for each event in the final _common_clean file
| Quadrant A | 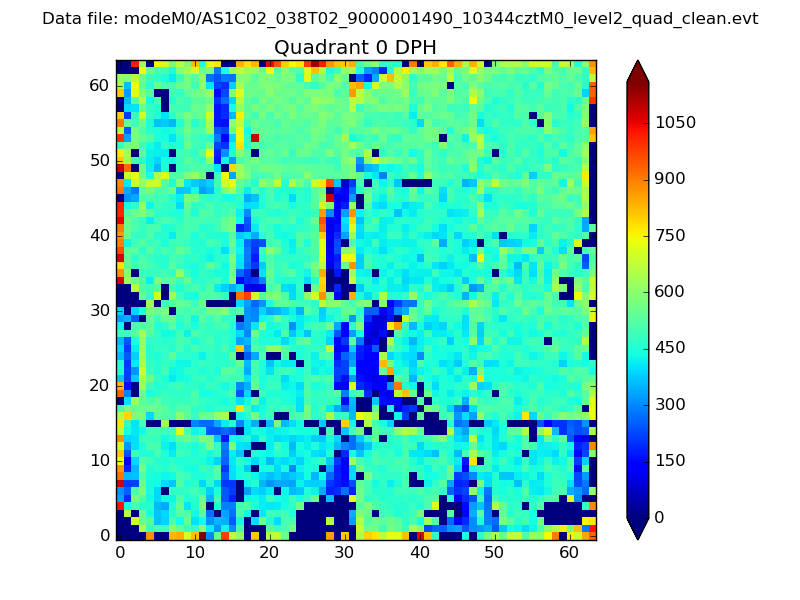 |
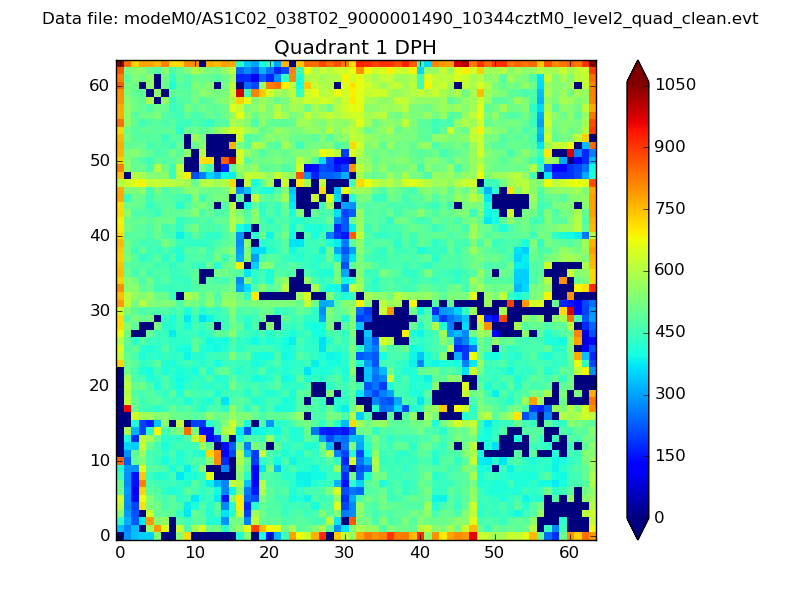 |
Quadrant B |
|---|---|---|---|
| Quadrant D | 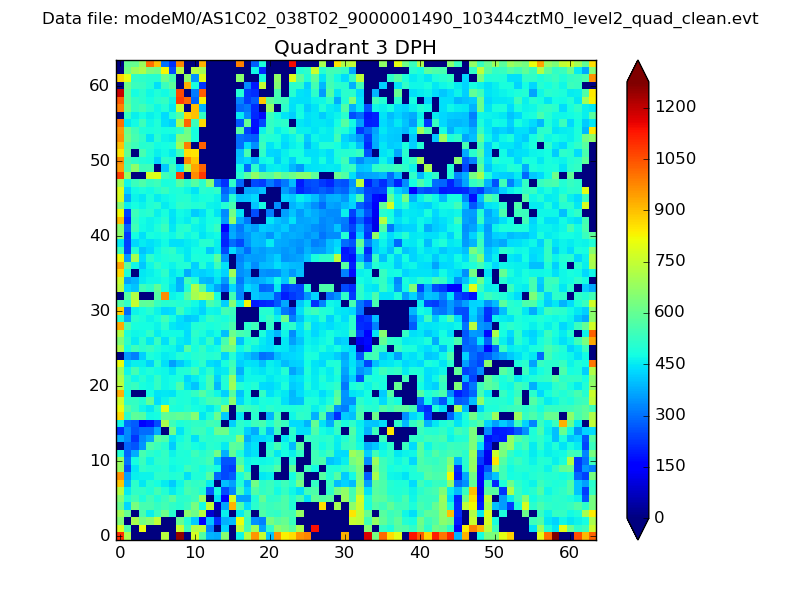 |
 |
Quadrant C |
| Plot type | Count rate plots | Images |
|---|---|---|
| Comparison with Poisson distribution Blue bars denote a histogram of data divided into 1 sec bins. Red curve is a Poisson curve with rate = median count rate of data. |
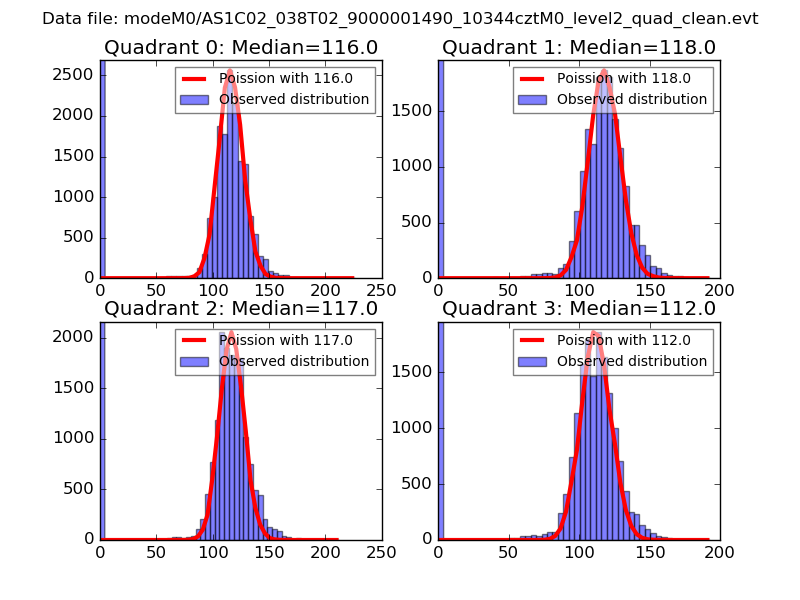 |
 |
| Quadrant-wise count rates Data is divided into 100 sec bins |
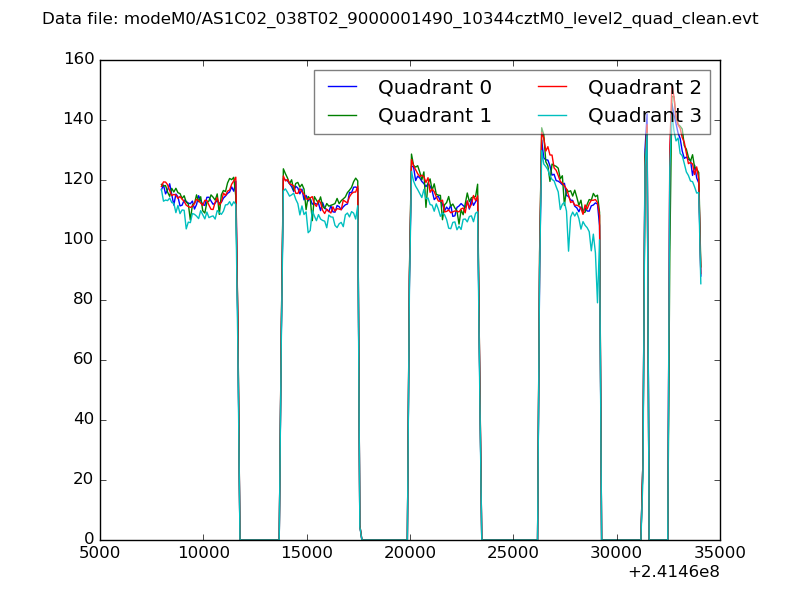 |
|
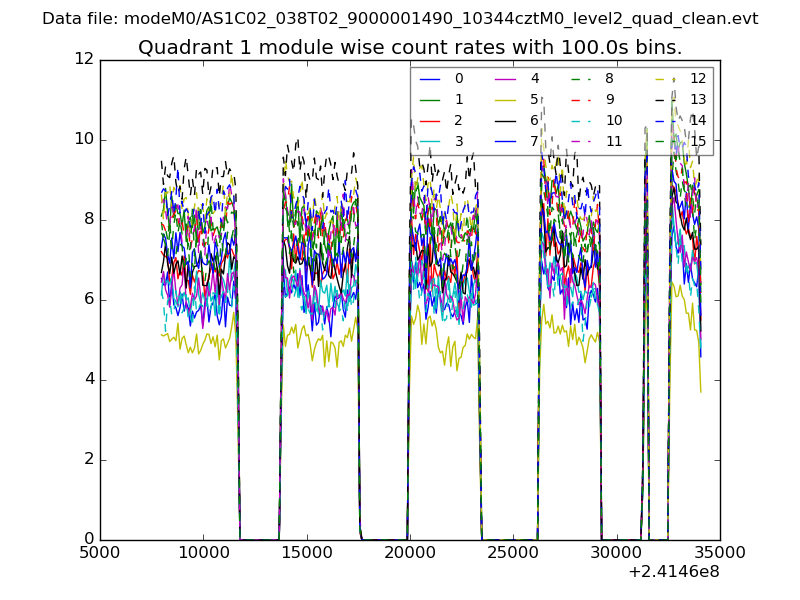
| Module-wise count rates for Quadrant A Data is divided into 100 sec bins |
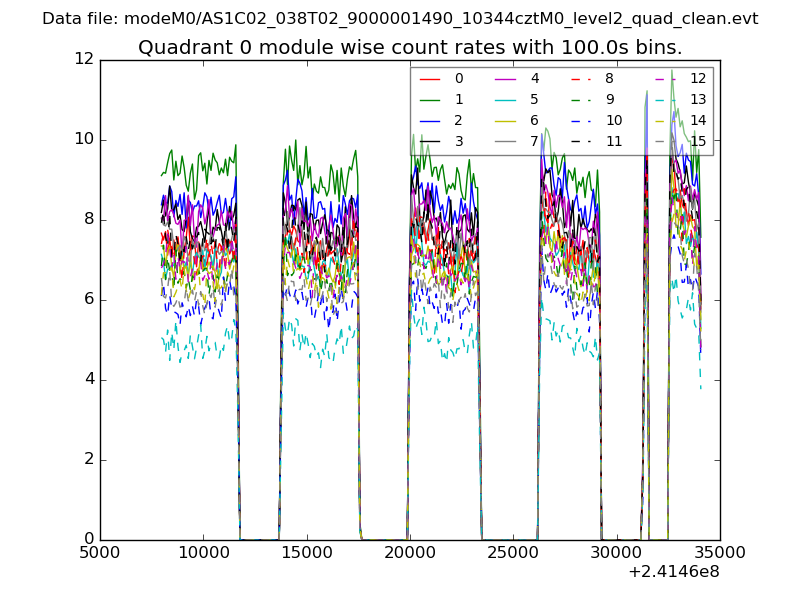 |
 |
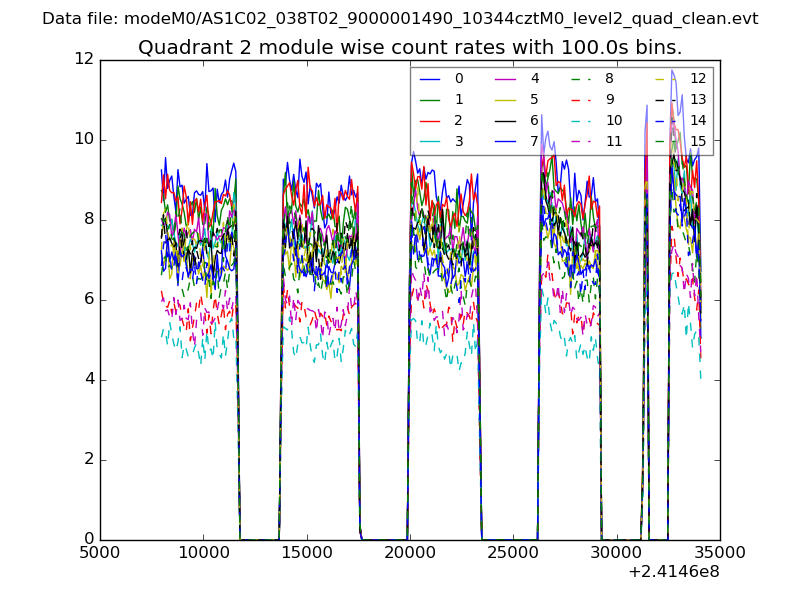
| Module-wise count rates for Quadrant B Data is divided into 100 sec bins |
 |
 |
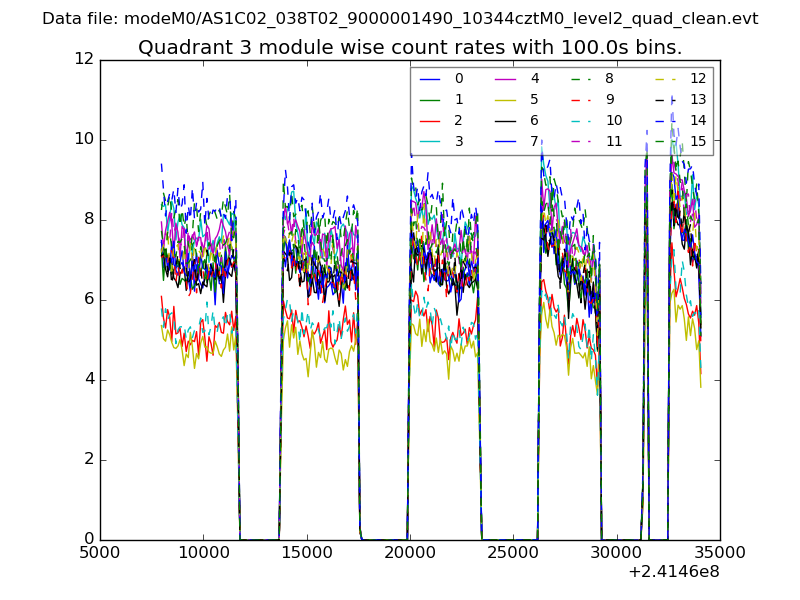
| Module-wise count rates for Quadrant C Data is divided into 100 sec bins |
 |
 |
| Module-wise count rates for Quadrant D Data is divided into 100 sec bins |
 |
 |
| Parameter | Plot |
|---|---|
| CZT HV Monitor | 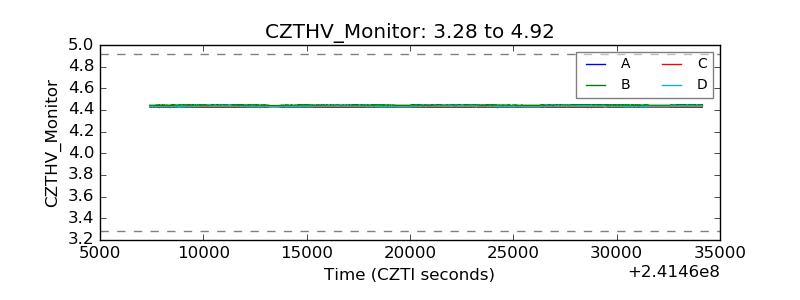 |
| D_VDD | 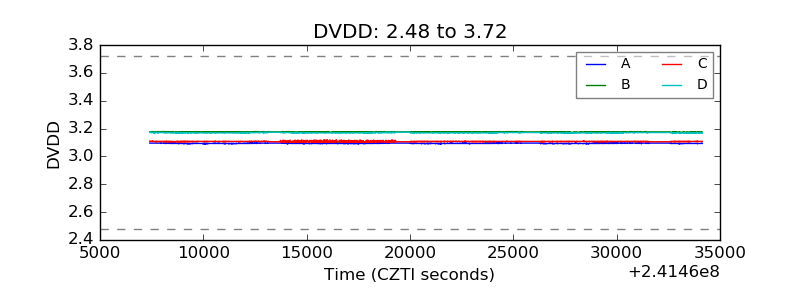 |
| Temperature 1 | 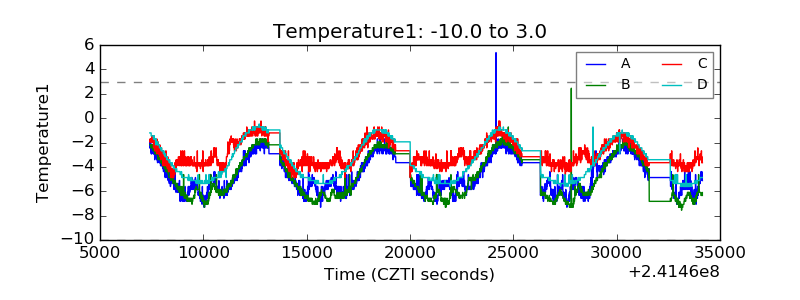 |
| Veto HV Monitor | 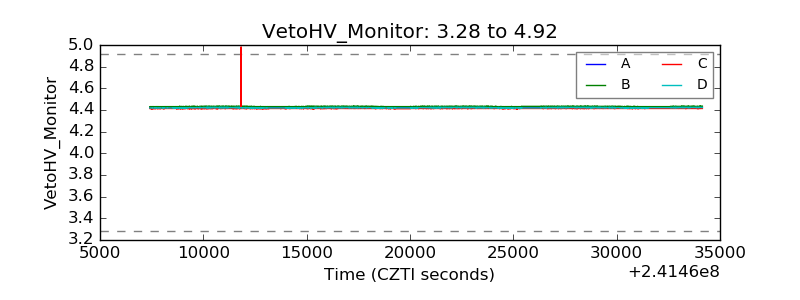 |
| Veto LLD |  |
| Alpha Counter | 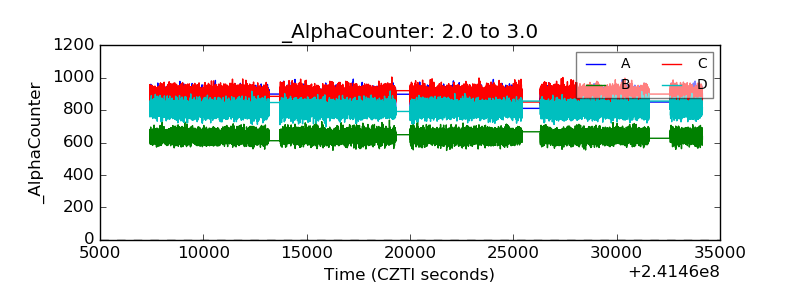 |
| _CPM_Rate | 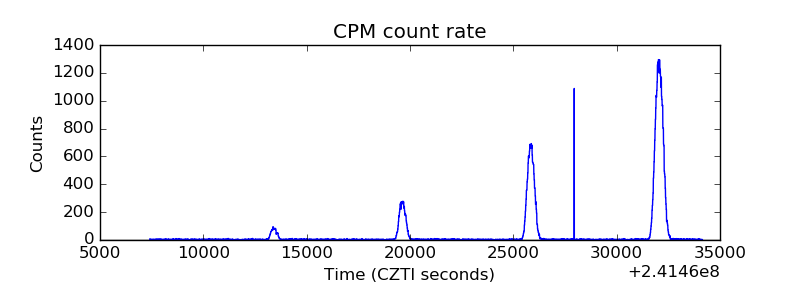 |
| CZT Counter | 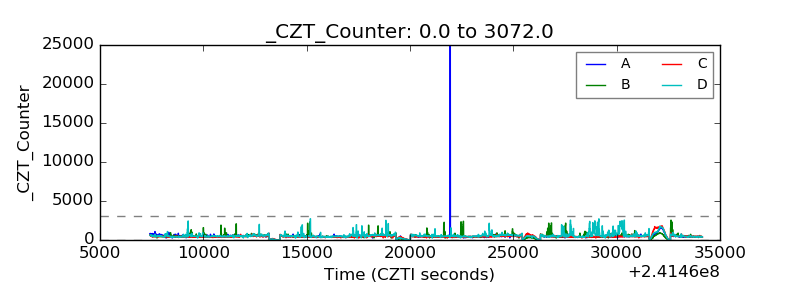 |
| +2.5 Volts monitor |  |
| +5 Volts monitor |  |
| _ROLL_ROT | 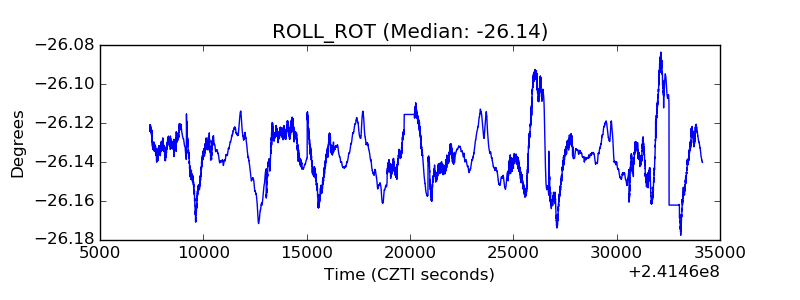 |
| _Roll_DEC | 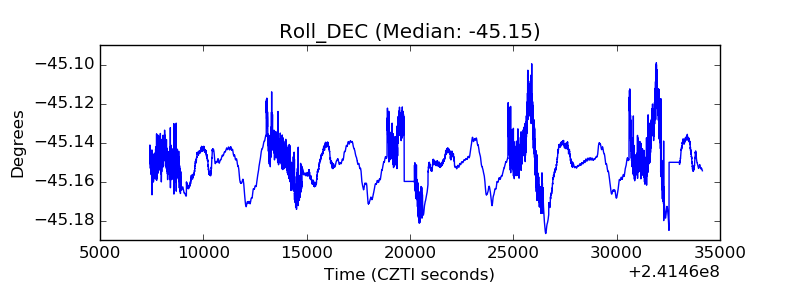 |
| _Roll_RA | 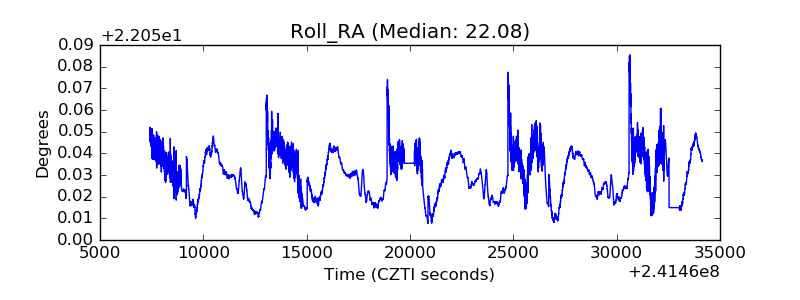 |
| Veto Counter | 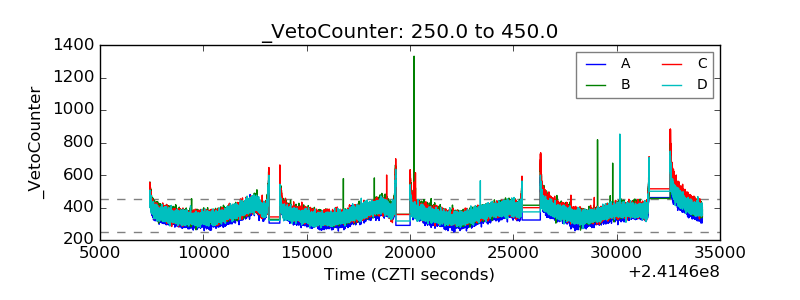 |