| Param | Original file | Final file |
|---|---|---|
| Filename | modeM0/AS1C02_038T02_9000001490_10347cztM0_level2.evt | modeM0/AS1C02_038T02_9000001490_10347cztM0_level2_quad_clean.evt |
| Size (bytes) | 330,361,920 | 73,368,000 |
| Size | 315.1 MB | 70.0 MB |
| Events in quadrant A | 2,358,558 | 449,085 |
| Events in quadrant B | 2,259,206 | 443,144 |
| Events in quadrant C | 2,314,910 | 454,702 |
| Events in quadrant D | 2,726,254 | 520,164 |
| Mode M9 | |||
|---|---|---|---|
| Quadrant | BADHDUFLAG | Total packets | Discarded packets |
| A | 0 | 20 | 7 |
| B | 0 | 25 | 12 |
| C | 0 | 25 | 12 |
| D | 0 | 21 | 7 |
| Mode SS | |||
|---|---|---|---|
| Quadrant | BADHDUFLAG | Total packets | Discarded packets |
| A | 0 | 254 | 135 |
| B | 0 | 254 | 138 |
| C | 0 | 254 | 137 |
| D | 0 | 246 | 126 |
| Mode M0 | |||
|---|---|---|---|
| Quadrant | BADHDUFLAG | Total packets | Discarded packets |
| A | 0 | 24522 | 14606 |
| B | 0 | 26422 | 16996 |
| C | 0 | 25839 | 16013 |
| D | 0 | 26655 | 15316 |
| Quadrant | Total seconds | Saturated seconds | Saturation percentage |
|---|---|---|---|
| A | 4935 | 3 | 0.060790% |
| B | 4688 | 4 | 0.085324% |
| C | 4886 | 4 | 0.081867% |
| D | 5599 | 6 | 0.107162% |
Noise dominated data is calculated using 1-second bins in cleaned event files. If a bin has >2000 counts, and if more than 50% of those come from <1% of pixels, then it is considered to be noise-dominated and hence unusable.
| Quadrant | # 1 sec bins | Bins with >0 counts | Bins with >2000 counts | High rate bins dominated by noise | Noise dominated (total time) | Noise dominated (detector-on time) | Marked lightcurve |
|---|---|---|---|---|---|---|---|
| A | 7474 | 5854 | 0 | 0 | 0.00% | 0.00% | 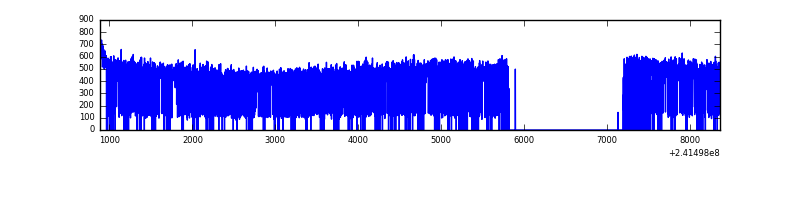 |
| B | 7474 | 5641 | 0 | 0 | 0.00% | 0.00% | 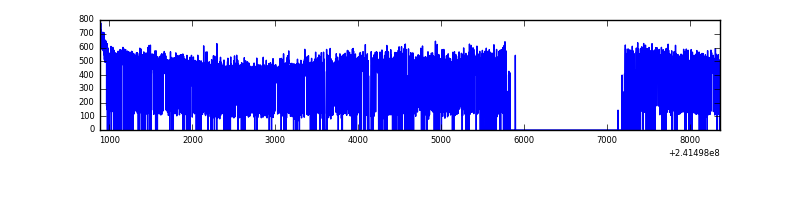 |
| C | 7474 | 5817 | 0 | 0 | 0.00% | 0.00% | 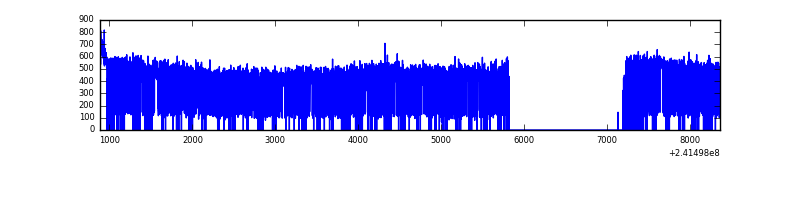 |
| D | 7474 | 5842 | 0 | 0 | 0.00% | 0.00% | 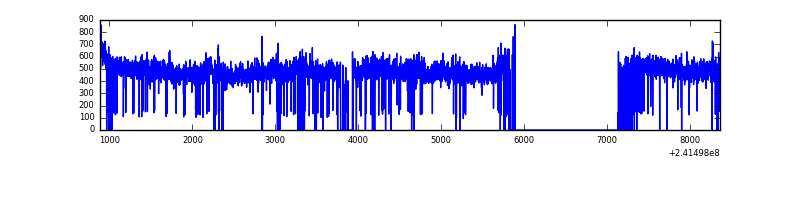 |
Top three noisy pixels from each quadrant. If the there are fewer than three noisy pixels in the level2.evt file, extra rows are filled as -1
| Pixel properties | Quadrant properties | ||||||
|---|---|---|---|---|---|---|---|
| Quadrant | DetID | PixID | Counts | Sigma | Mean | Median | Sigma |
| A | 13 | 251 | 34729 | 281.81 | 600 | 588 | 121.1 |
| A | 8 | 15 | 14099 | 111.52 | 600 | 588 | 121.1 |
| A | 0 | 226 | 5410 | 39.8 | 600 | 588 | 121.1 |
| B | 11 | 51 | 12888 | 115.02 | 569 | 556 | 107.2 |
| B | 0 | 219 | 12034 | 107.05 | 569 | 556 | 107.2 |
| B | 12 | 111 | 11581 | 102.83 | 569 | 556 | 107.2 |
| C | 4 | 175 | 7150 | 48.1 | 591 | 595 | 136.3 |
| C | 13 | 61 | 4245 | 26.78 | 591 | 595 | 136.3 |
| C | 14 | 234 | 3017 | 17.77 | 591 | 595 | 136.3 |
| D | 8 | 195 | 113138 | 635.9 | 667 | 656 | 176.9 |
| D | 1 | 52 | 21362 | 117.06 | 667 | 656 | 176.9 |
| D | 2 | 234 | 19926 | 108.94 | 667 | 656 | 176.9 |
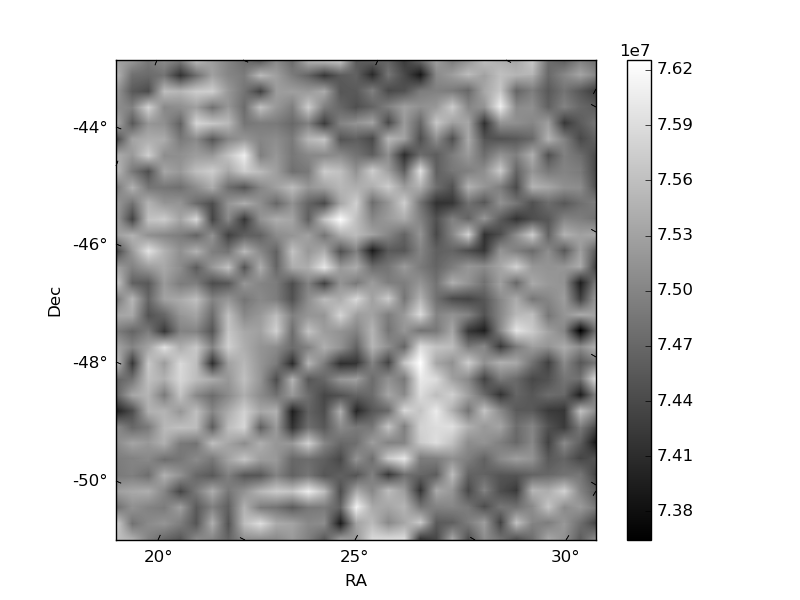
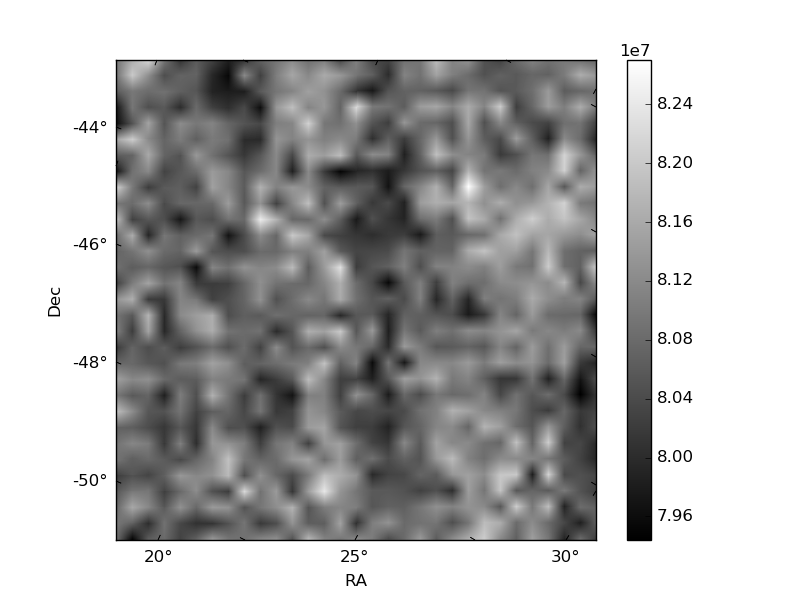
Histogram calculated using DETX and DETY for each event in the final _common_clean file
| Quadrant A |  |
 |
Quadrant B |
|---|---|---|---|
| Quadrant D |  |
 |
Quadrant C |
| Plot type | Count rate plots | Images |
|---|---|---|
| Comparison with Poisson distribution Blue bars denote a histogram of data divided into 1 sec bins. Red curve is a Poisson curve with rate = median count rate of data. |
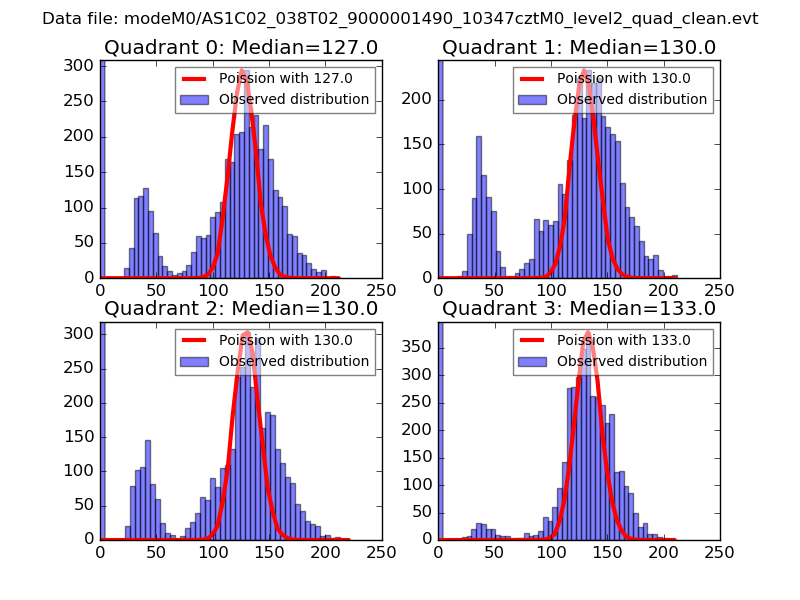 |
 |
| Quadrant-wise count rates Data is divided into 100 sec bins |
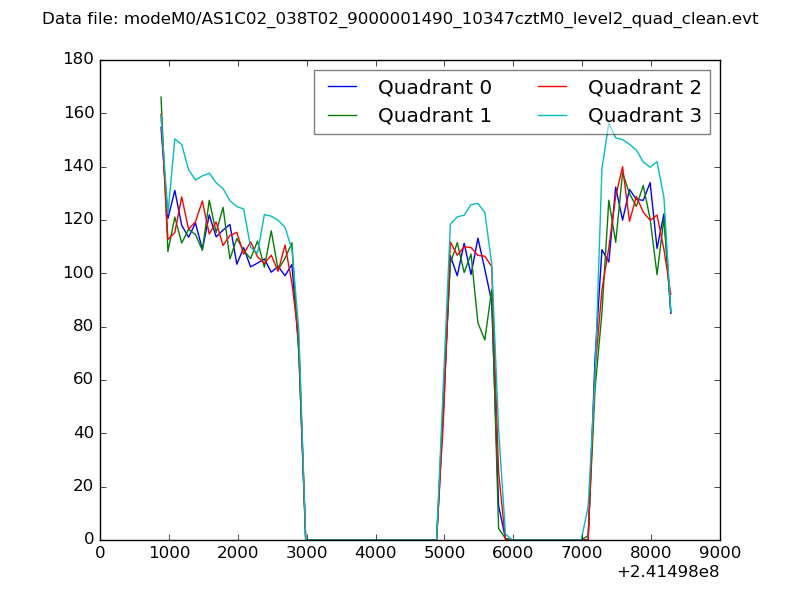 |
|
| Module-wise count rates for Quadrant A Data is divided into 100 sec bins |
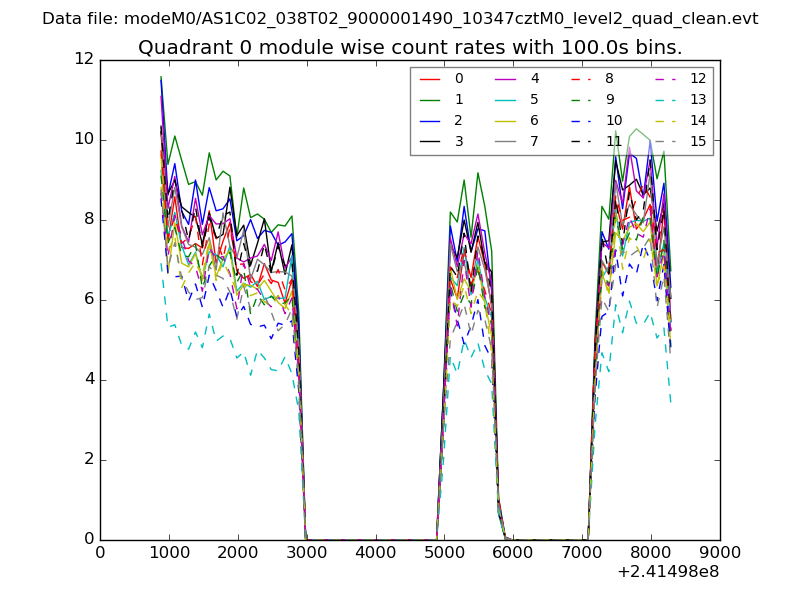 |
 |
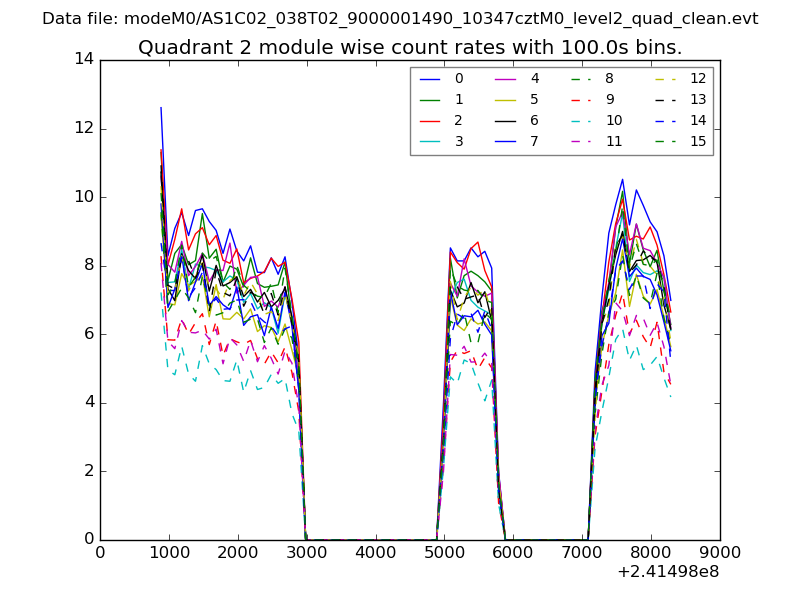
| Module-wise count rates for Quadrant B Data is divided into 100 sec bins |
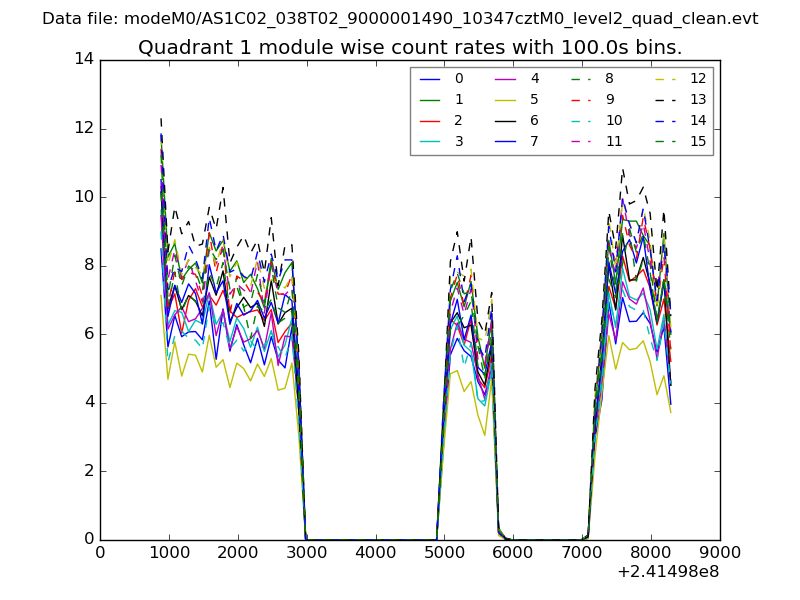 |
 |
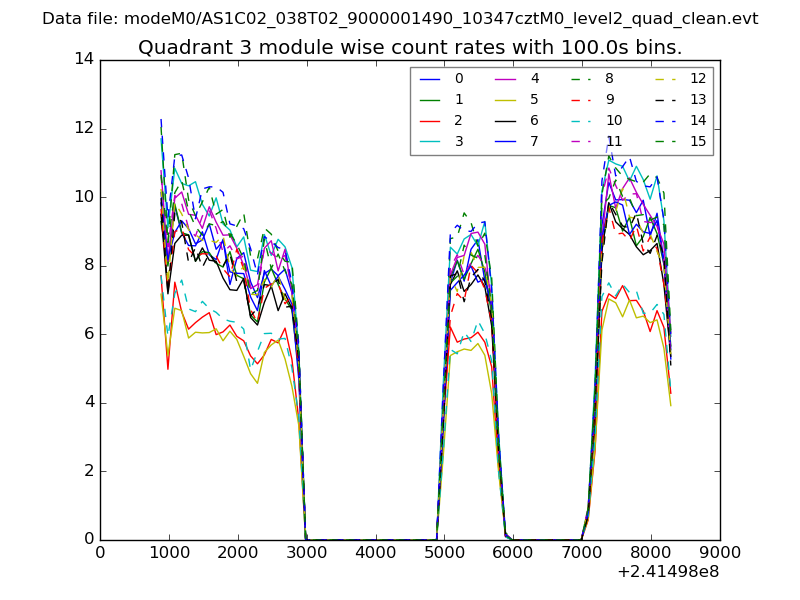
| Module-wise count rates for Quadrant C Data is divided into 100 sec bins |
 |
 |
| Module-wise count rates for Quadrant D Data is divided into 100 sec bins |
 |
 |
| Parameter | Plot |
|---|---|
| CZT HV Monitor | 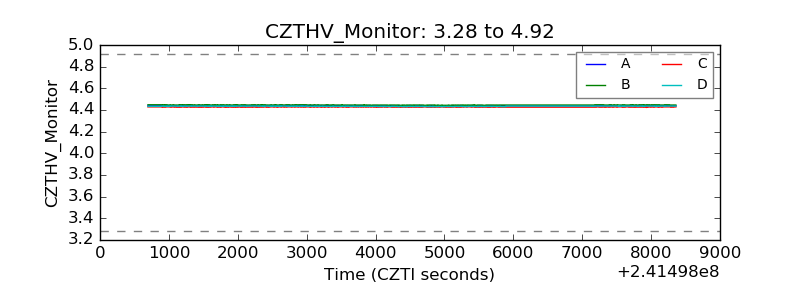 |
| D_VDD | 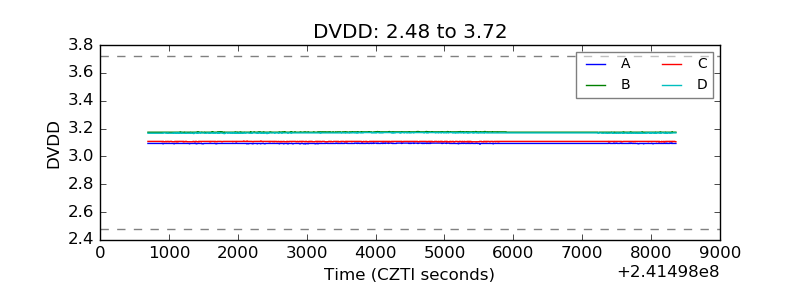 |
| Temperature 1 | 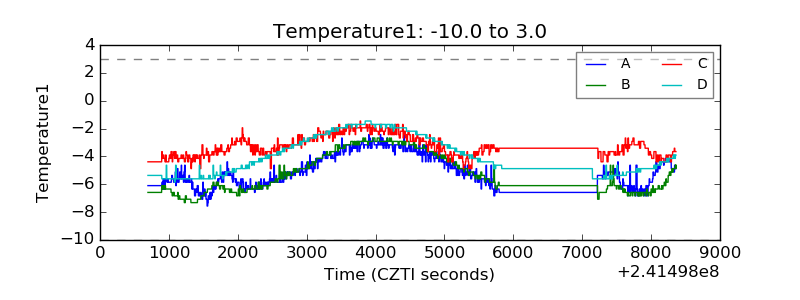 |
| Veto HV Monitor | 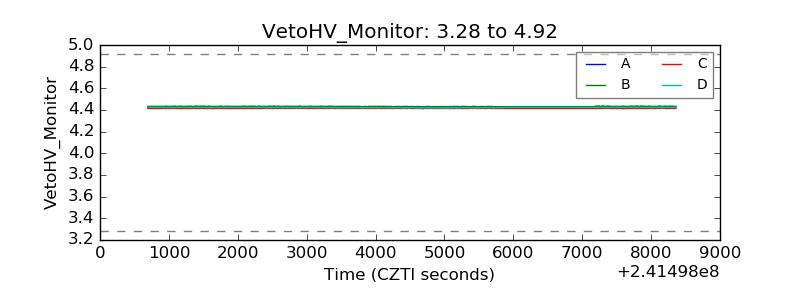 |
| Veto LLD | 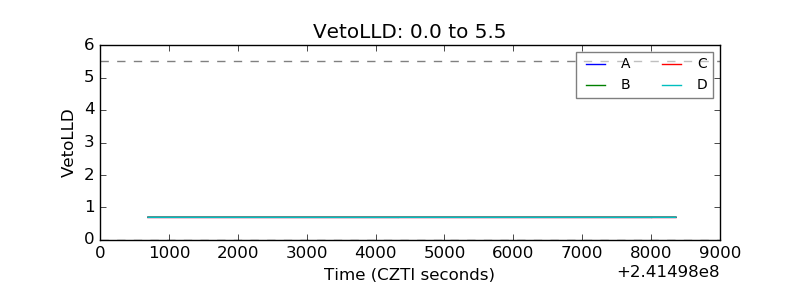 |
| Alpha Counter | 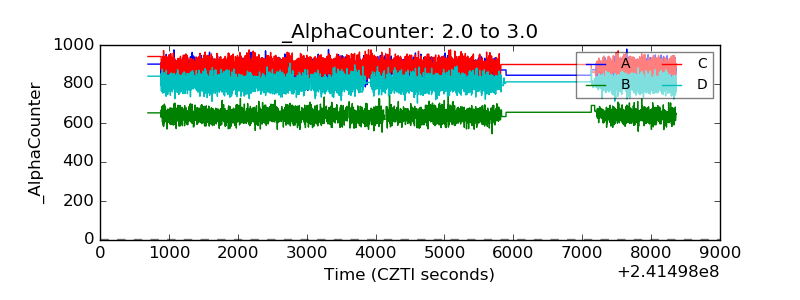 |
| _CPM_Rate | 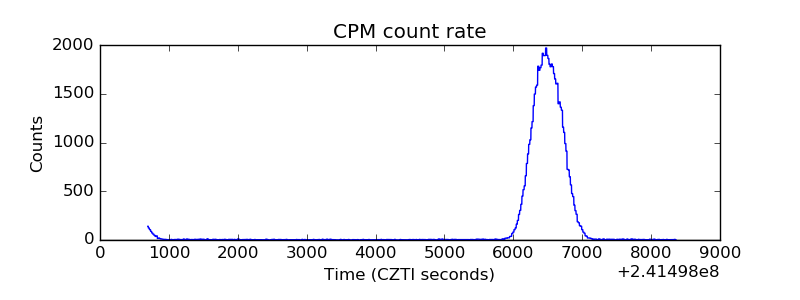 |
| CZT Counter |  |
| +2.5 Volts monitor |  |
| +5 Volts monitor |  |
| _ROLL_ROT | 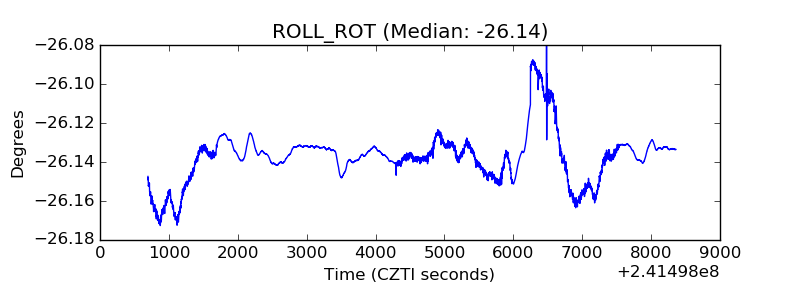 |
| _Roll_DEC | 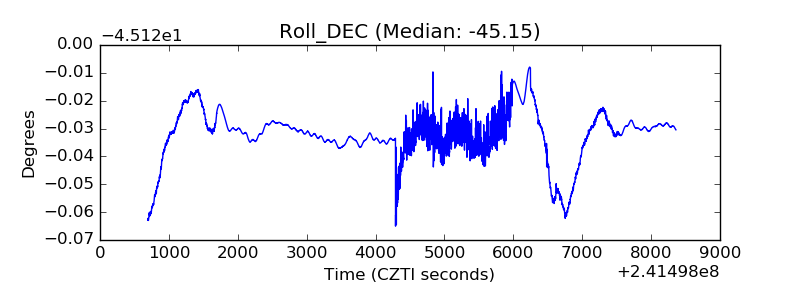 |
| _Roll_RA |  |
| Veto Counter | 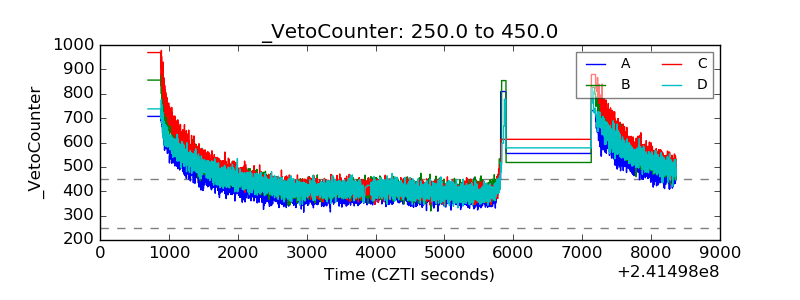 |