| Param | Original file | Final file |
|---|---|---|
| Filename | modeM0/AS1C02_038T02_9000001490_10348cztM0_level2.evt | modeM0/AS1C02_038T02_9000001490_10348cztM0_level2_quad_clean.evt |
| Size (bytes) | 346,253,760 | 72,630,720 |
| Size | 330.2 MB | 69.3 MB |
| Events in quadrant A | 2,420,585 | 448,409 |
| Events in quadrant B | 2,423,770 | 449,786 |
| Events in quadrant C | 2,374,602 | 453,537 |
| Events in quadrant D | 2,926,216 | 497,713 |
| Mode M9 | |||
|---|---|---|---|
| Quadrant | BADHDUFLAG | Total packets | Discarded packets |
| A | 0 | 22 | 10 |
| B | 0 | 24 | 12 |
| C | 0 | 24 | 12 |
| D | 0 | 20 | 8 |
| Mode SS | |||
|---|---|---|---|
| Quadrant | BADHDUFLAG | Total packets | Discarded packets |
| A | 0 | 243 | 134 |
| B | 0 | 244 | 132 |
| C | 0 | 244 | 133 |
| D | 0 | 235 | 124 |
| Mode M0 | |||
|---|---|---|---|
| Quadrant | BADHDUFLAG | Total packets | Discarded packets |
| A | 0 | 23859 | 13889 |
| B | 0 | 26064 | 16169 |
| C | 0 | 25033 | 15097 |
| D | 0 | 25969 | 13948 |
| Quadrant | Total seconds | Saturated seconds | Saturation percentage |
|---|---|---|---|
| A | 4828 | 50 | 1.035626% |
| B | 4714 | 56 | 1.187951% |
| C | 4805 | 40 | 0.832466% |
| D | 5555 | 55 | 0.990099% |
Noise dominated data is calculated using 1-second bins in cleaned event files. If a bin has >2000 counts, and if more than 50% of those come from <1% of pixels, then it is considered to be noise-dominated and hence unusable.
| Quadrant | # 1 sec bins | Bins with >0 counts | Bins with >2000 counts | High rate bins dominated by noise | Noise dominated (total time) | Noise dominated (detector-on time) | Marked lightcurve |
|---|---|---|---|---|---|---|---|
| A | 7219 | 5709 | 0 | 0 | 0.00% | 0.00% |  |
| B | 7218 | 5597 | 0 | 0 | 0.00% | 0.00% | 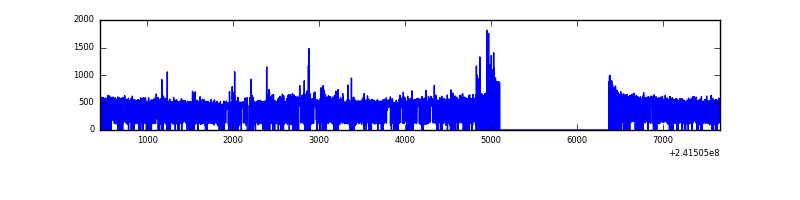 |
| C | 7219 | 5681 | 0 | 0 | 0.00% | 0.00% | 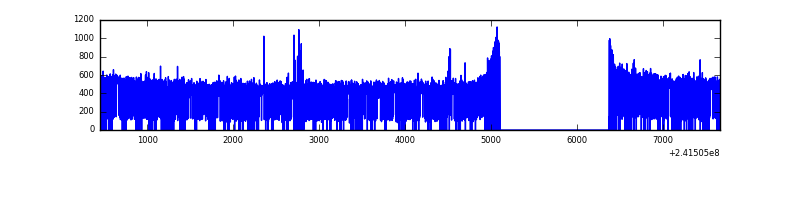 |
| D | 7218 | 5826 | 2 | 2 | 0.03% | 0.03% | 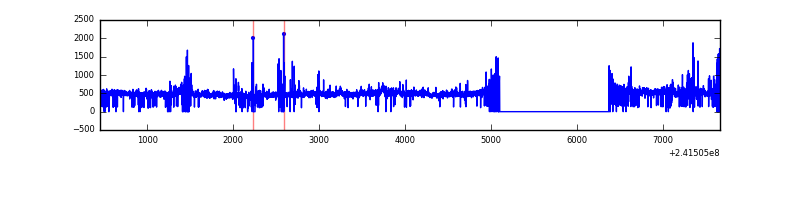 |
Top three noisy pixels from each quadrant. If the there are fewer than three noisy pixels in the level2.evt file, extra rows are filled as -1
| Pixel properties | Quadrant properties | ||||||
|---|---|---|---|---|---|---|---|
| Quadrant | DetID | PixID | Counts | Sigma | Mean | Median | Sigma |
| A | 8 | 15 | 32037 | 256.52 | 614 | 602 | 122.5 |
| A | 13 | 251 | 22071 | 175.19 | 614 | 602 | 122.5 |
| A | 0 | 226 | 5627 | 41.01 | 614 | 602 | 122.5 |
| B | 11 | 51 | 51129 | 452.73 | 594 | 579 | 111.7 |
| B | 4 | 239 | 42364 | 374.23 | 594 | 579 | 111.7 |
| B | 0 | 214 | 14891 | 128.18 | 594 | 579 | 111.7 |
| C | 14 | 234 | 12793 | 87.58 | 605 | 608 | 139.1 |
| C | 13 | 61 | 4328 | 26.74 | 605 | 608 | 139.1 |
| C | 4 | 175 | 2546 | 13.93 | 605 | 608 | 139.1 |
| D | 8 | 195 | 91152 | 556.96 | 695 | 680 | 162.4 |
| D | 2 | 33 | 68396 | 416.87 | 695 | 680 | 162.4 |
| D | 2 | 136 | 37964 | 229.53 | 695 | 680 | 162.4 |
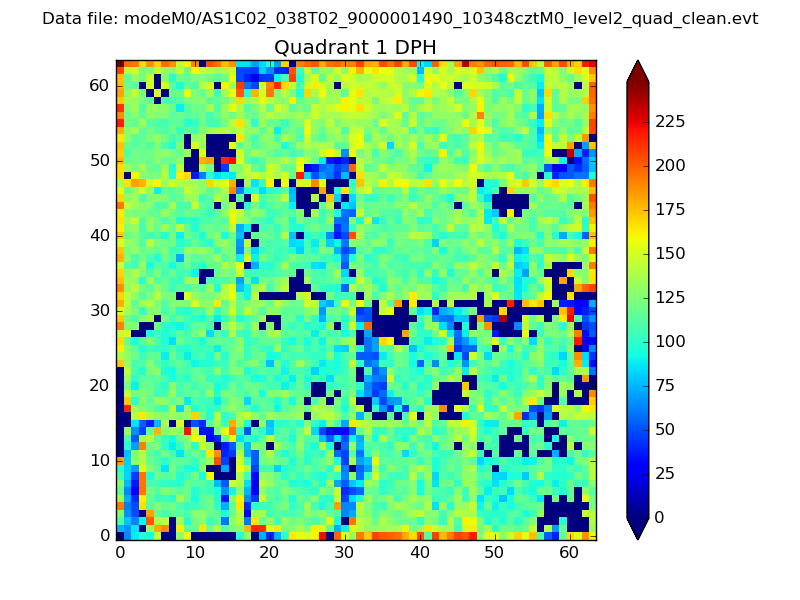
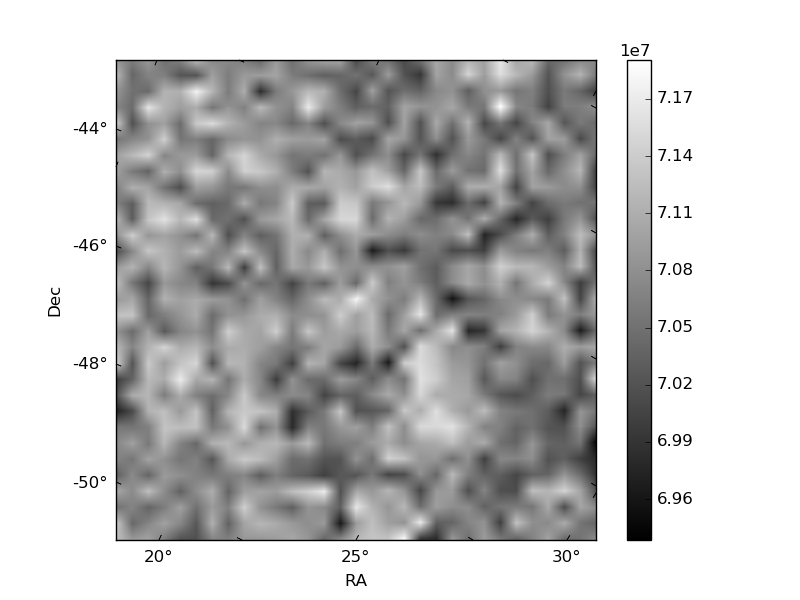
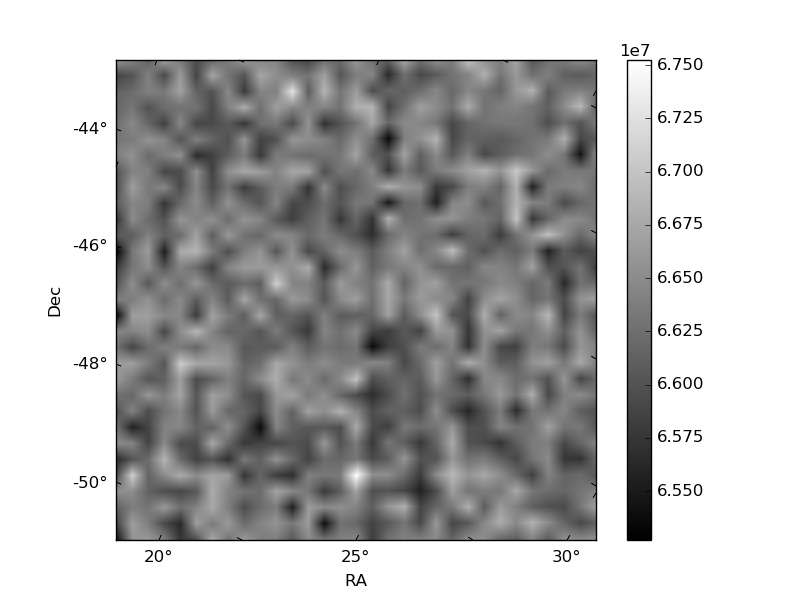
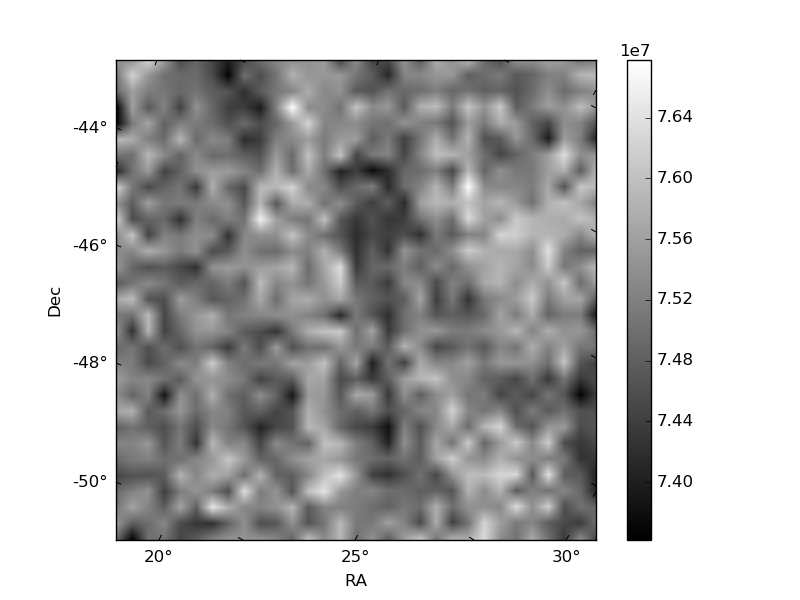
Histogram calculated using DETX and DETY for each event in the final _common_clean file
| Quadrant A | 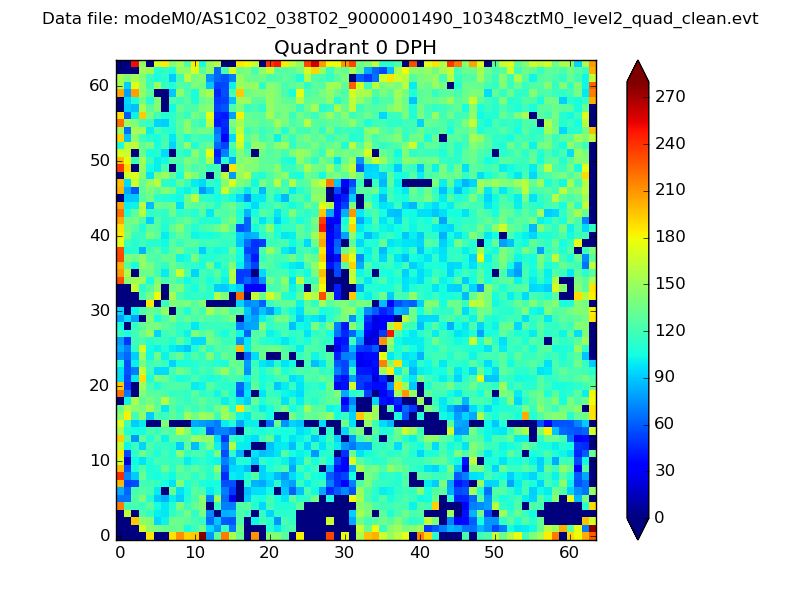 |
 |
Quadrant B |
|---|---|---|---|
| Quadrant D | 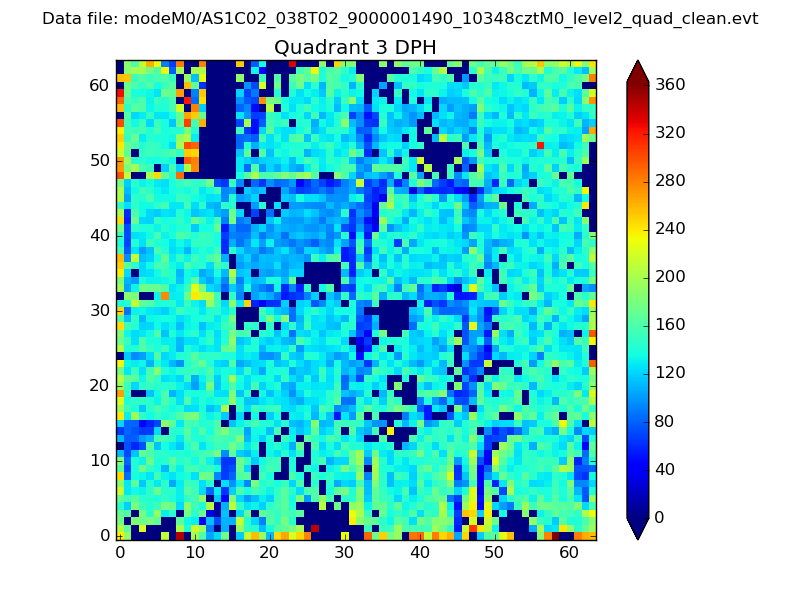 |
 |
Quadrant C |
| Plot type | Count rate plots | Images |
|---|---|---|
| Comparison with Poisson distribution Blue bars denote a histogram of data divided into 1 sec bins. Red curve is a Poisson curve with rate = median count rate of data. |
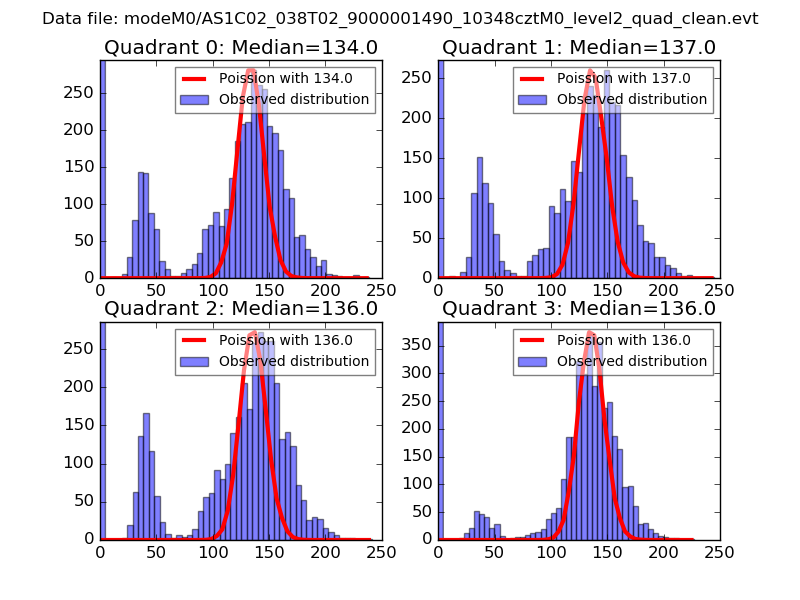 |
 |
| Quadrant-wise count rates Data is divided into 100 sec bins |
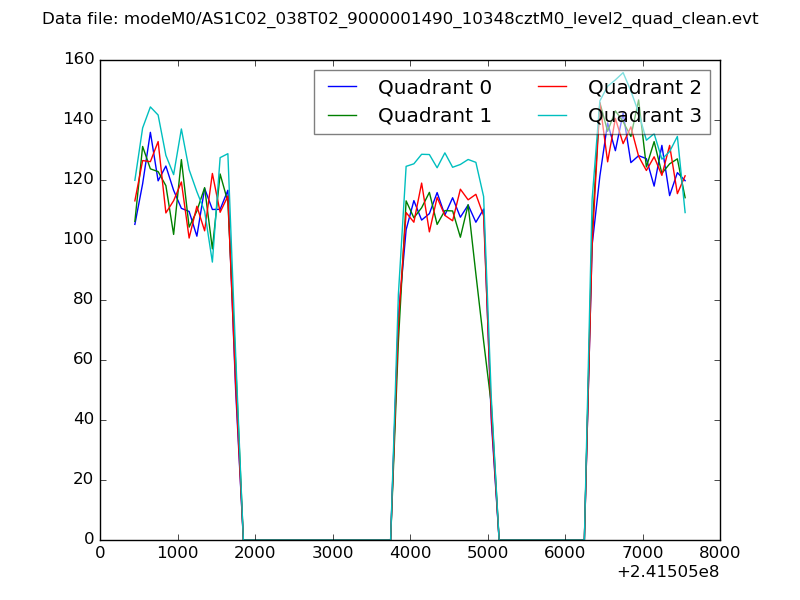 |
|
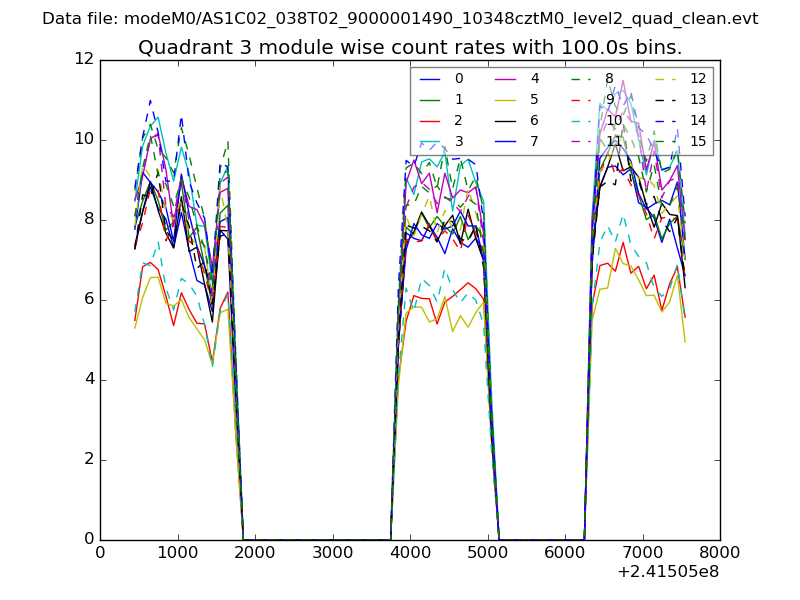
| Module-wise count rates for Quadrant A Data is divided into 100 sec bins |
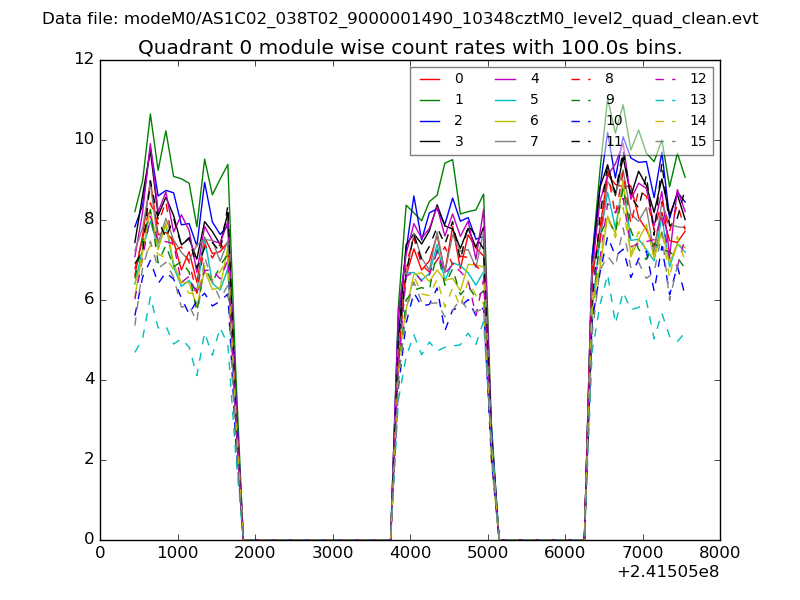 |
 |
| Module-wise count rates for Quadrant B Data is divided into 100 sec bins |
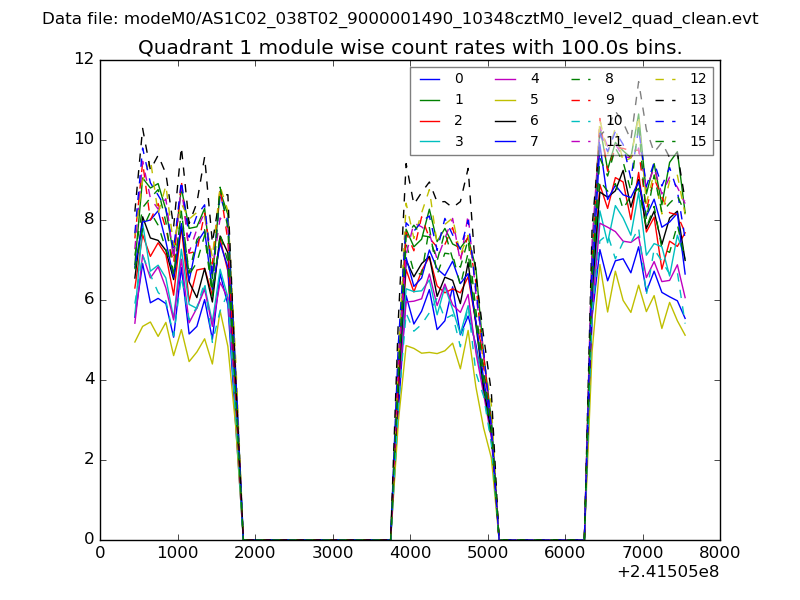 |
 |
| Module-wise count rates for Quadrant C Data is divided into 100 sec bins |
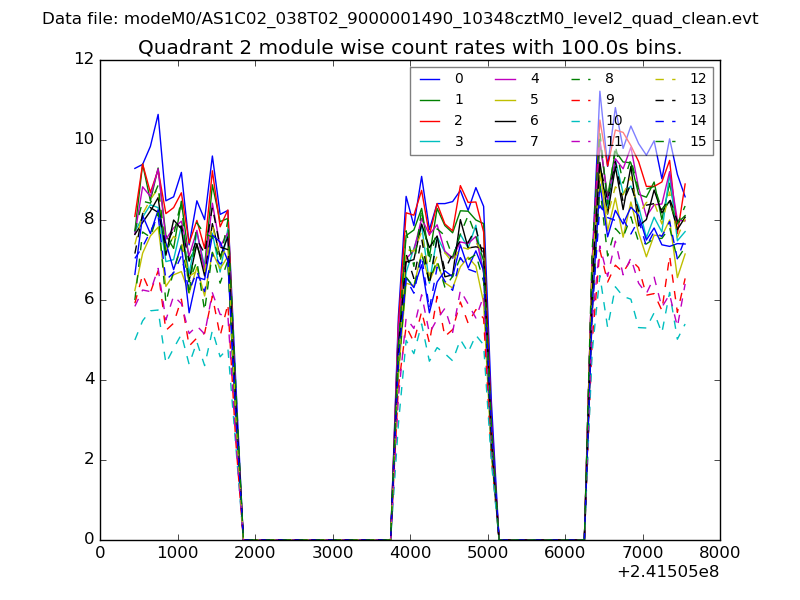 |
 |
| Module-wise count rates for Quadrant D Data is divided into 100 sec bins |
 |
 |
| Parameter | Plot |
|---|---|
| CZT HV Monitor | 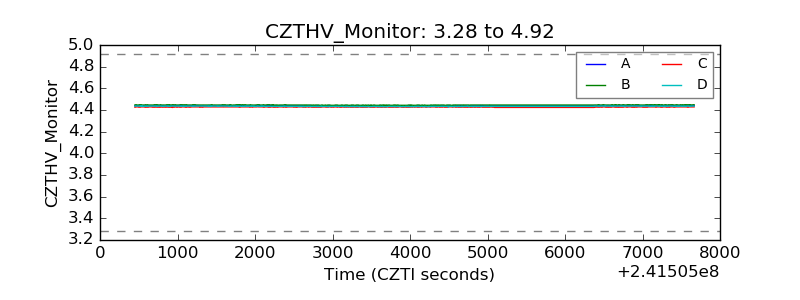 |
| D_VDD | 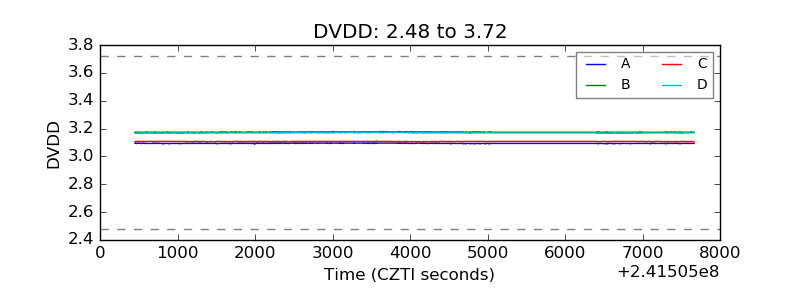 |
| Temperature 1 | 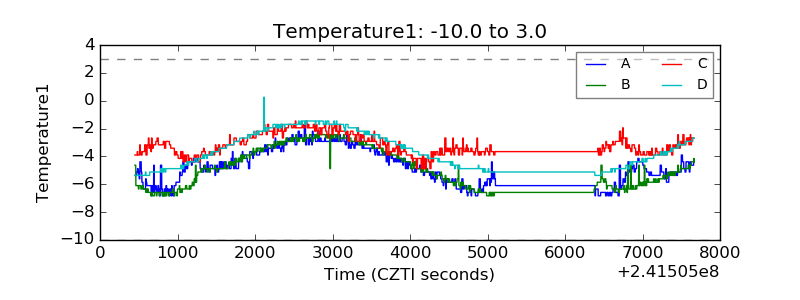 |
| Veto HV Monitor | 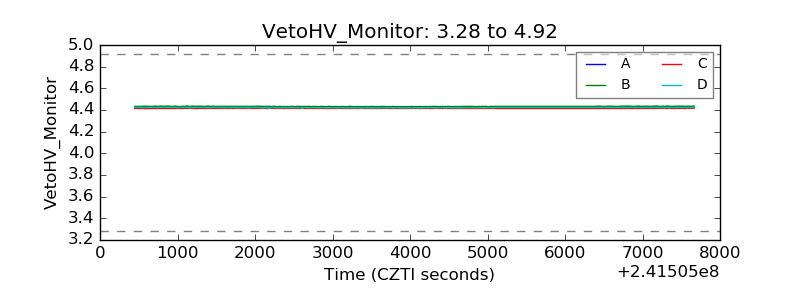 |
| Veto LLD | 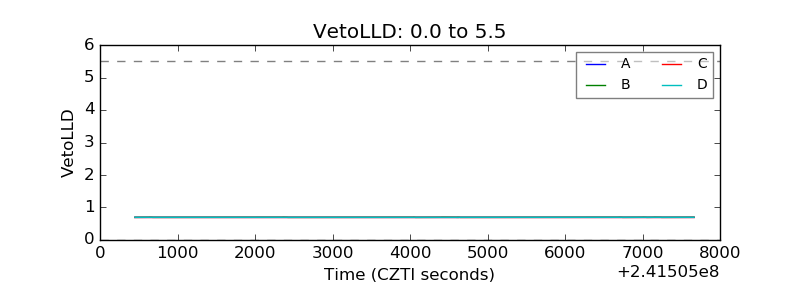 |
| Alpha Counter | 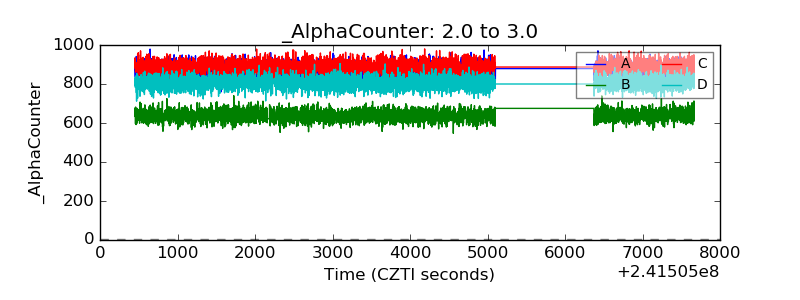 |
| _CPM_Rate | 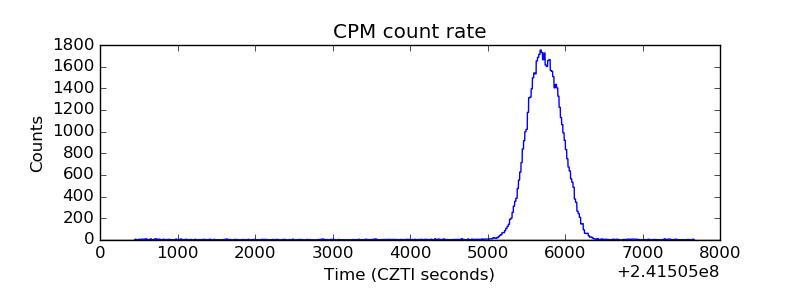 |
| CZT Counter |  |
| +2.5 Volts monitor |  |
| +5 Volts monitor |  |
| _ROLL_ROT | 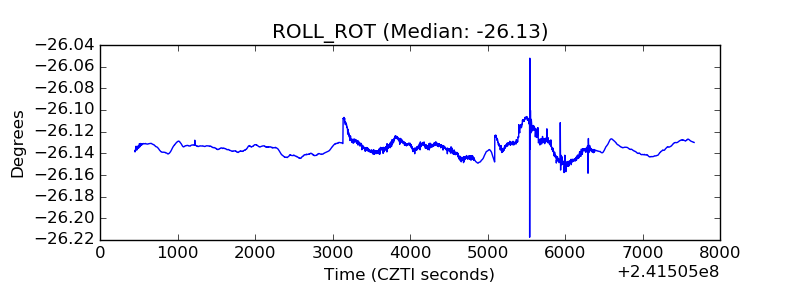 |
| _Roll_DEC | 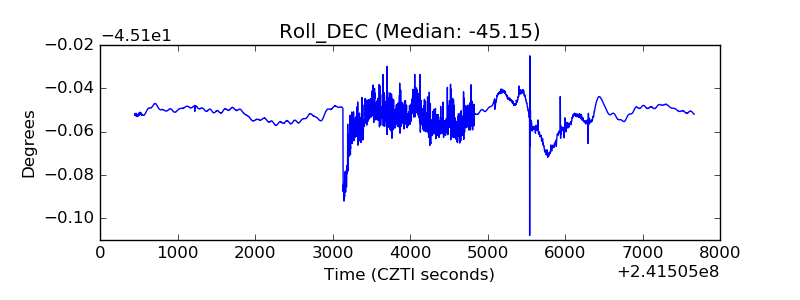 |
| _Roll_RA |  |
| Veto Counter | 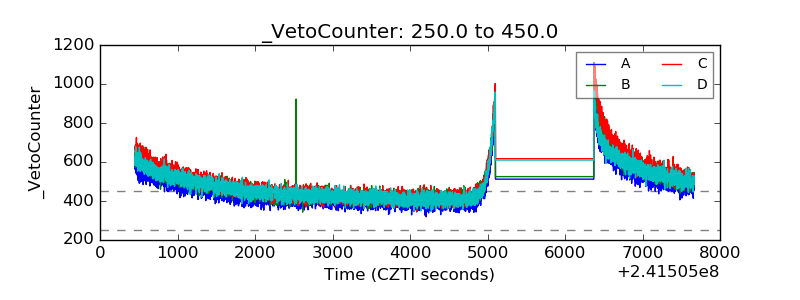 |