| Param | Original file | Final file |
|---|---|---|
| Filename | modeM0/AS1C02_038T02_9000001490_10349cztM0_level2.evt | modeM0/AS1C02_038T02_9000001490_10349cztM0_level2_quad_clean.evt |
| Size (bytes) | 341,530,560 | 63,858,240 |
| Size | 325.7 MB | 60.9 MB |
| Events in quadrant A | 2,339,198 | 396,370 |
| Events in quadrant B | 2,361,070 | 394,592 |
| Events in quadrant C | 2,321,272 | 402,086 |
| Events in quadrant D | 2,995,776 | 405,715 |
| Mode M9 | |||
|---|---|---|---|
| Quadrant | BADHDUFLAG | Total packets | Discarded packets |
| A | 0 | 22 | 9 |
| B | 0 | 26 | 13 |
| C | 0 | 26 | 13 |
| D | 0 | 20 | 7 |
| Mode SS | |||
|---|---|---|---|
| Quadrant | BADHDUFLAG | Total packets | Discarded packets |
| A | 0 | 219 | 113 |
| B | 0 | 220 | 128 |
| C | 0 | 220 | 114 |
| D | 0 | 208 | 108 |
| Mode M0 | |||
|---|---|---|---|
| Quadrant | BADHDUFLAG | Total packets | Discarded packets |
| A | 0 | 21589 | 11901 |
| B | 0 | 23749 | 14094 |
| C | 0 | 22685 | 12955 |
| D | 0 | 26212 | 14291 |
| Quadrant | Total seconds | Saturated seconds | Saturation percentage |
|---|---|---|---|
| A | 4700 | 51 | 1.085106% |
| B | 4608 | 49 | 1.063368% |
| C | 4715 | 42 | 0.890774% |
| D | 5097 | 69 | 1.353737% |
Noise dominated data is calculated using 1-second bins in cleaned event files. If a bin has >2000 counts, and if more than 50% of those come from <1% of pixels, then it is considered to be noise-dominated and hence unusable.
| Quadrant | # 1 sec bins | Bins with >0 counts | Bins with >2000 counts | High rate bins dominated by noise | Noise dominated (total time) | Noise dominated (detector-on time) | Marked lightcurve |
|---|---|---|---|---|---|---|---|
| A | 6973 | 5483 | 0 | 0 | 0.00% | 0.00% | 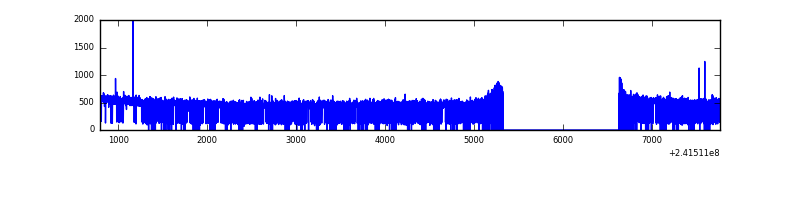 |
| B | 6973 | 5402 | 0 | 0 | 0.00% | 0.00% | 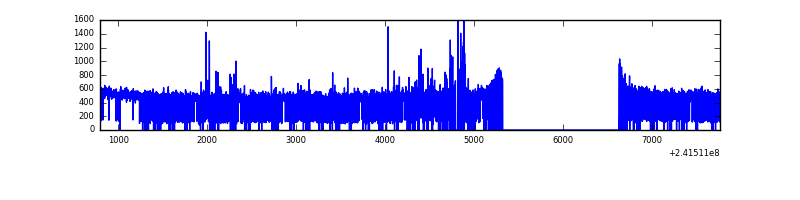 |
| C | 6971 | 5476 | 0 | 0 | 0.00% | 0.00% | 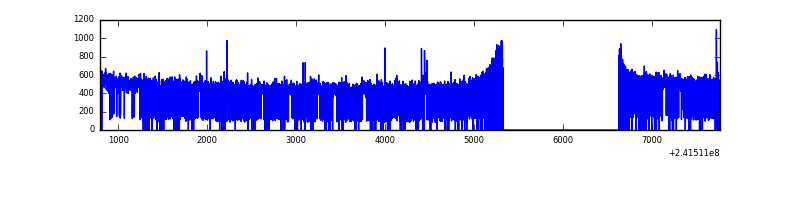 |
| D | 6973 | 5485 | 2 | 2 | 0.03% | 0.04% | 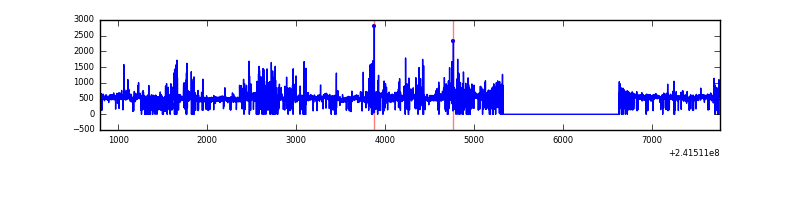 |
Top three noisy pixels from each quadrant. If the there are fewer than three noisy pixels in the level2.evt file, extra rows are filled as -1
| Pixel properties | Quadrant properties | ||||||
|---|---|---|---|---|---|---|---|
| Quadrant | DetID | PixID | Counts | Sigma | Mean | Median | Sigma |
| A | 13 | 251 | 9431 | 72.45 | 602 | 590 | 122.0 |
| A | 8 | 15 | 8420 | 64.16 | 602 | 590 | 122.0 |
| A | 0 | 226 | 5590 | 40.97 | 602 | 590 | 122.0 |
| B | 4 | 239 | 47239 | 421.93 | 585 | 570 | 110.6 |
| B | 11 | 51 | 23050 | 203.24 | 585 | 570 | 110.6 |
| B | 0 | 214 | 11983 | 103.18 | 585 | 570 | 110.6 |
| C | 4 | 175 | 9022 | 62.22 | 591 | 594 | 135.5 |
| C | 14 | 234 | 8085 | 55.3 | 591 | 594 | 135.5 |
| C | 13 | 61 | 4491 | 28.77 | 591 | 594 | 135.5 |
| D | 8 | 195 | 203757 | 1346.19 | 637 | 621 | 150.9 |
| D | 2 | 33 | 182726 | 1206.82 | 637 | 621 | 150.9 |
| D | 14 | 34 | 105597 | 695.68 | 637 | 621 | 150.9 |
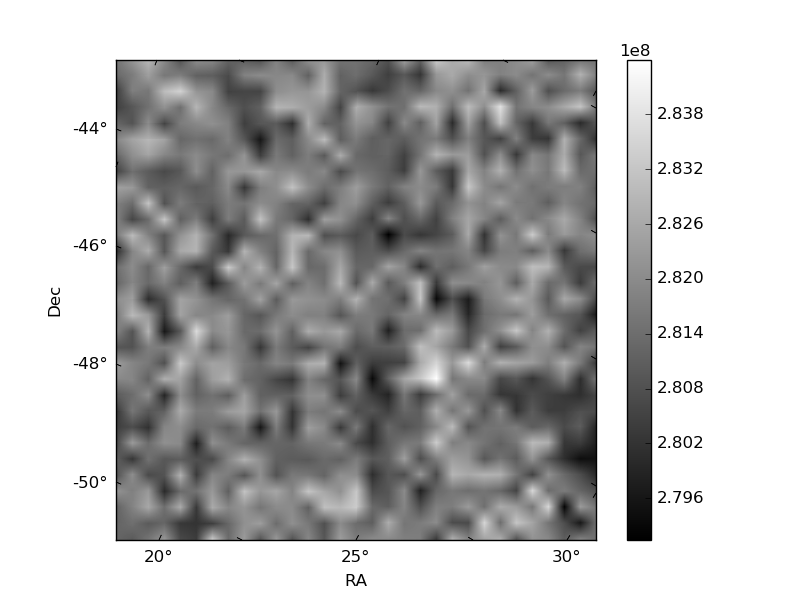
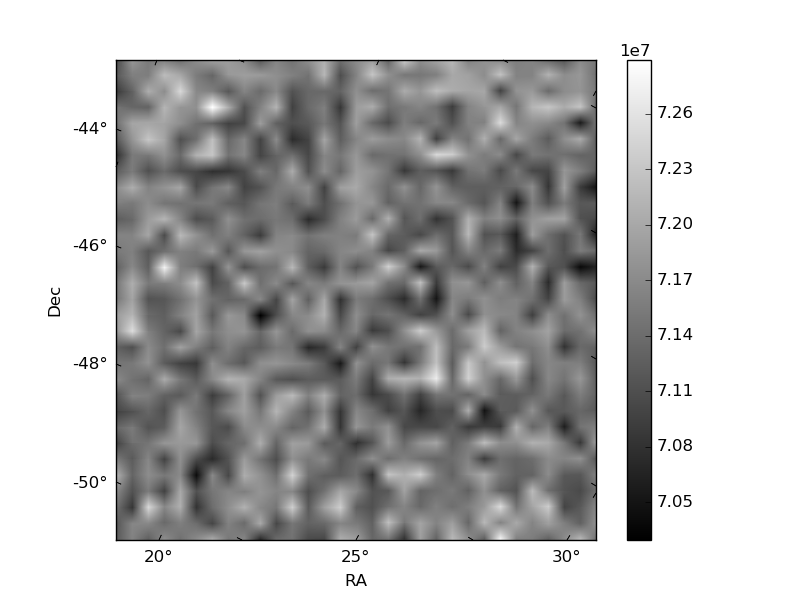
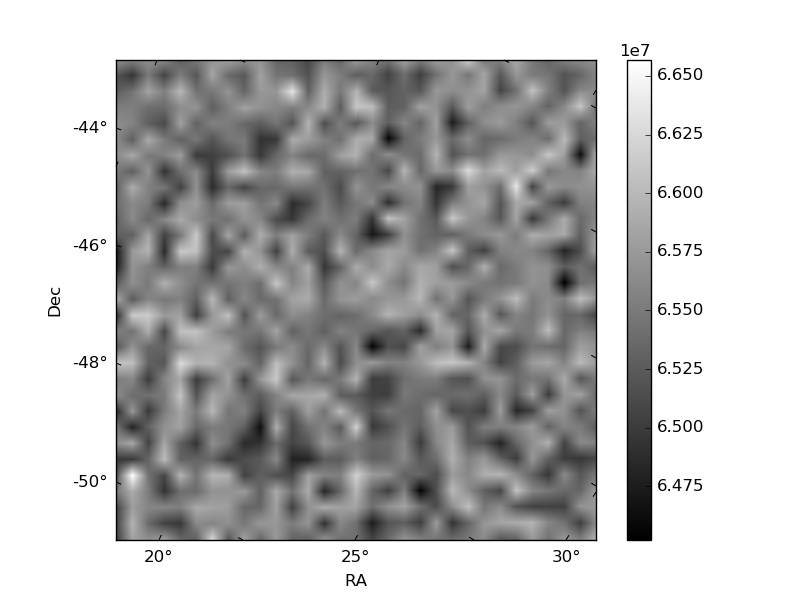
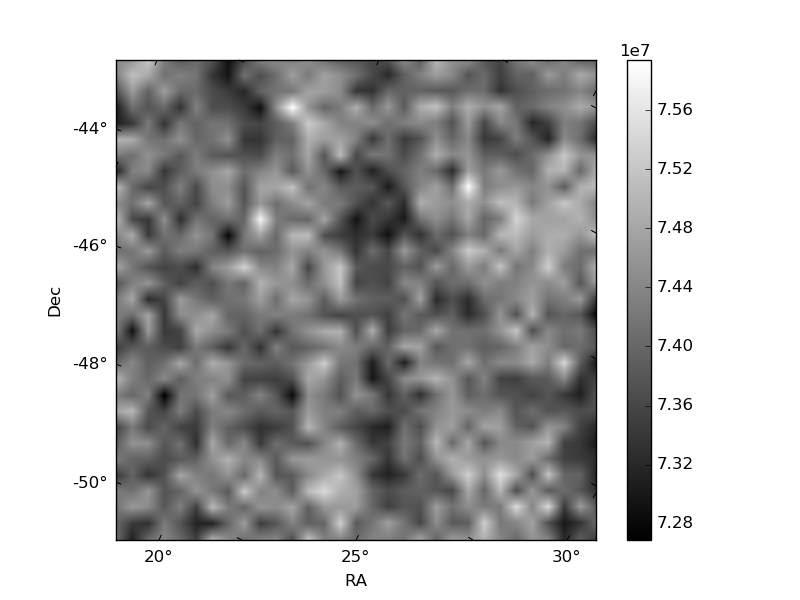
Histogram calculated using DETX and DETY for each event in the final _common_clean file
| Quadrant A | 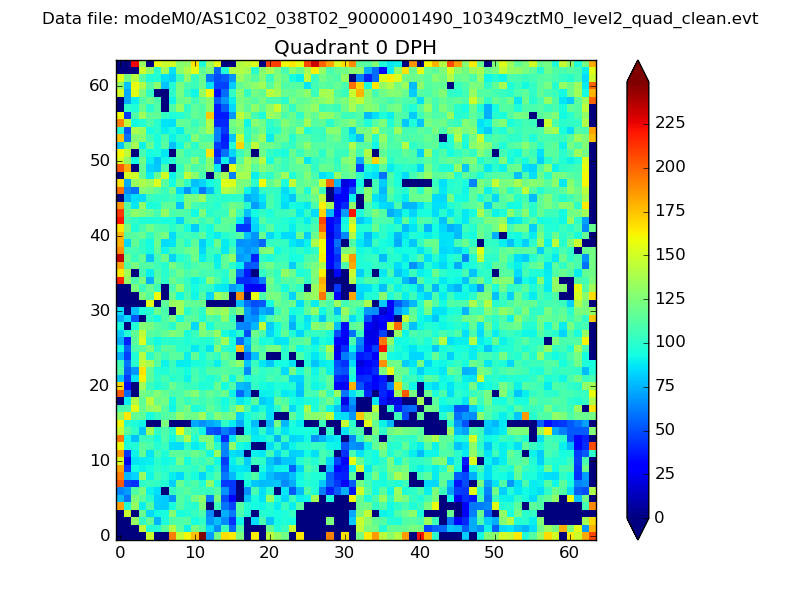 |
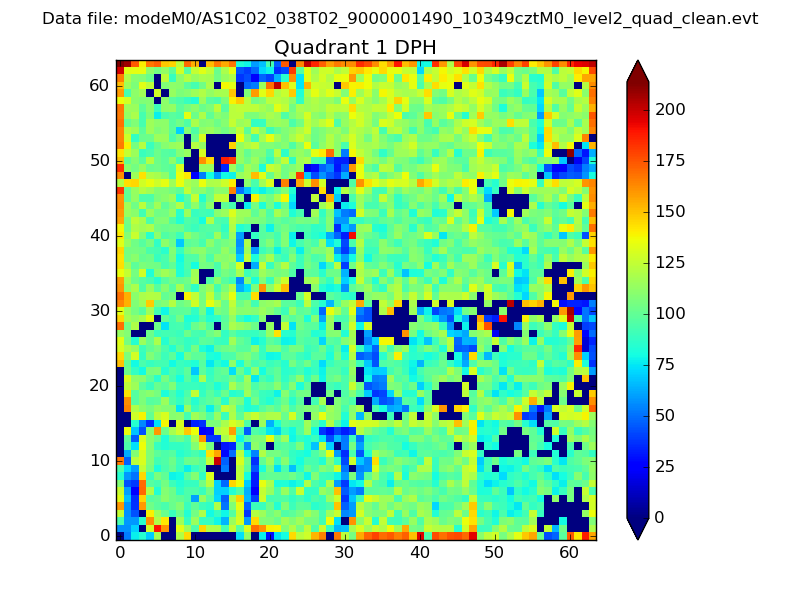 |
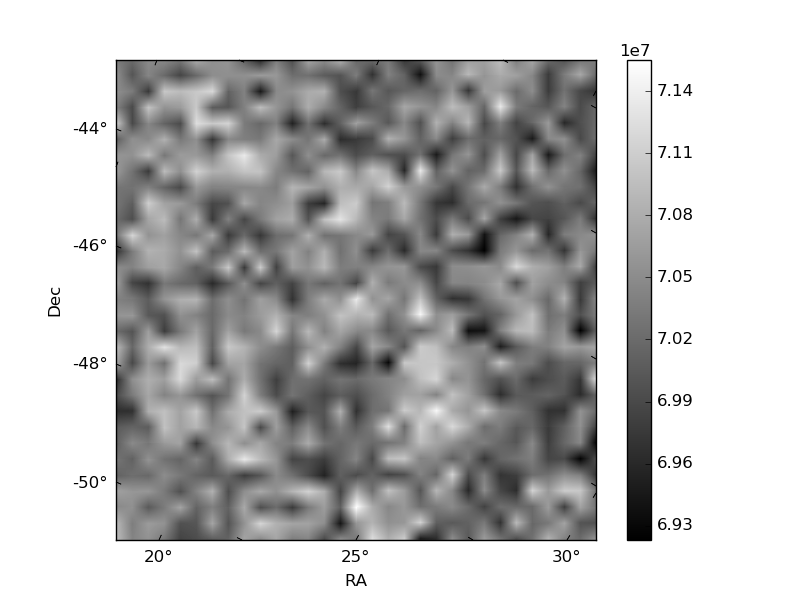
Quadrant B |
|---|---|---|---|
| Quadrant D | 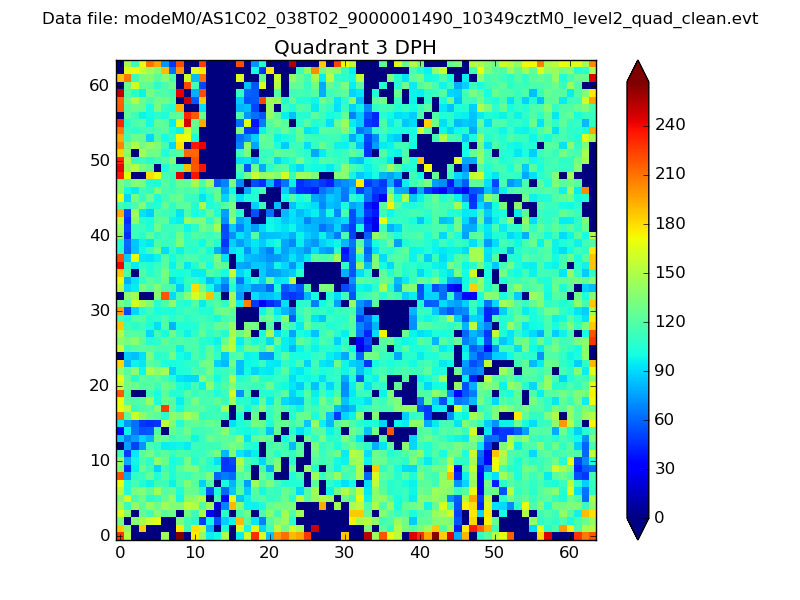 |
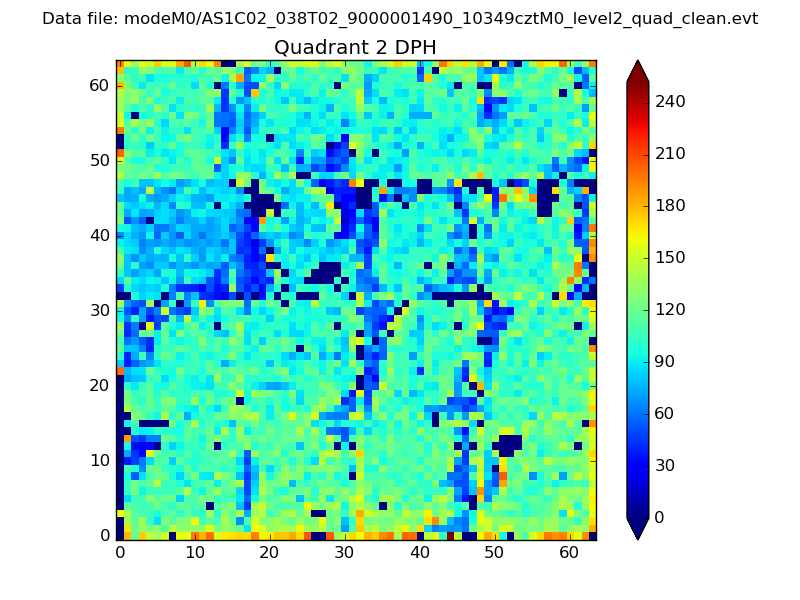 |
Quadrant C |
| Plot type | Count rate plots | Images |
|---|---|---|
| Comparison with Poisson distribution Blue bars denote a histogram of data divided into 1 sec bins. Red curve is a Poisson curve with rate = median count rate of data. |
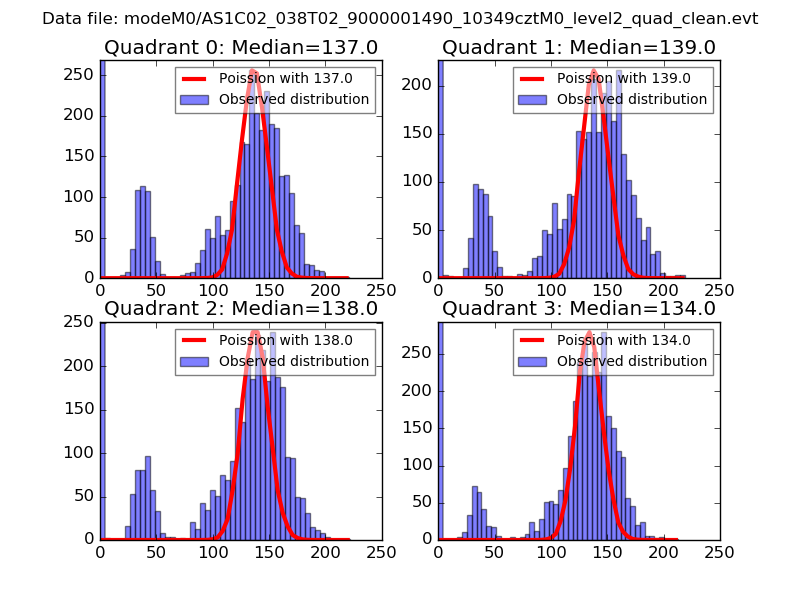 |
 |
| Quadrant-wise count rates Data is divided into 100 sec bins |
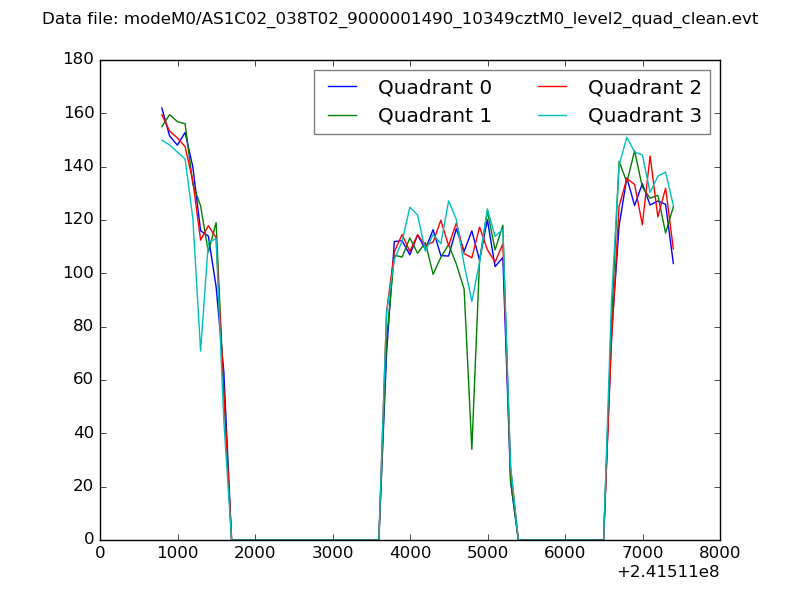 |
|
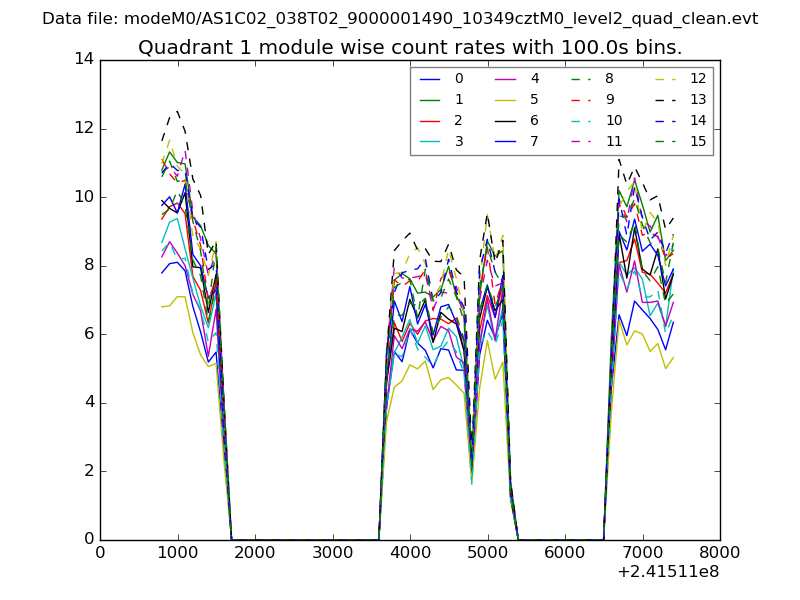
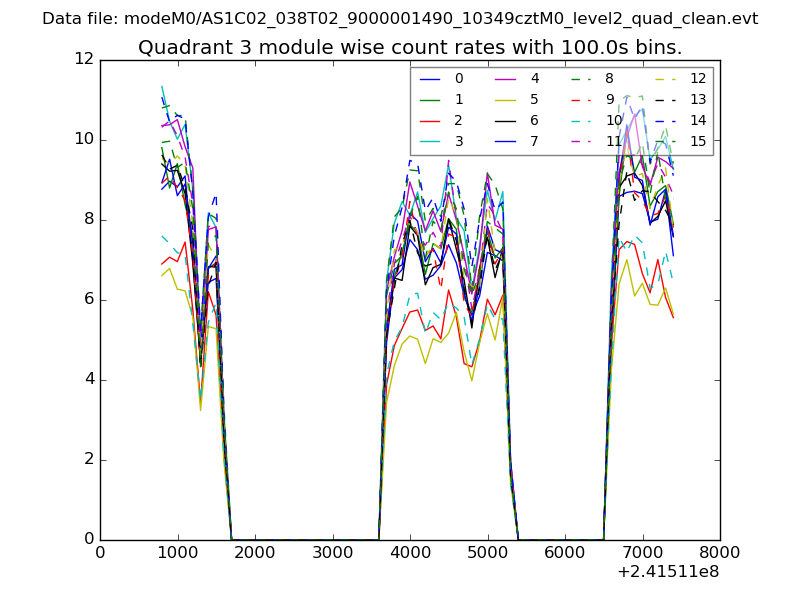
| Module-wise count rates for Quadrant A Data is divided into 100 sec bins |
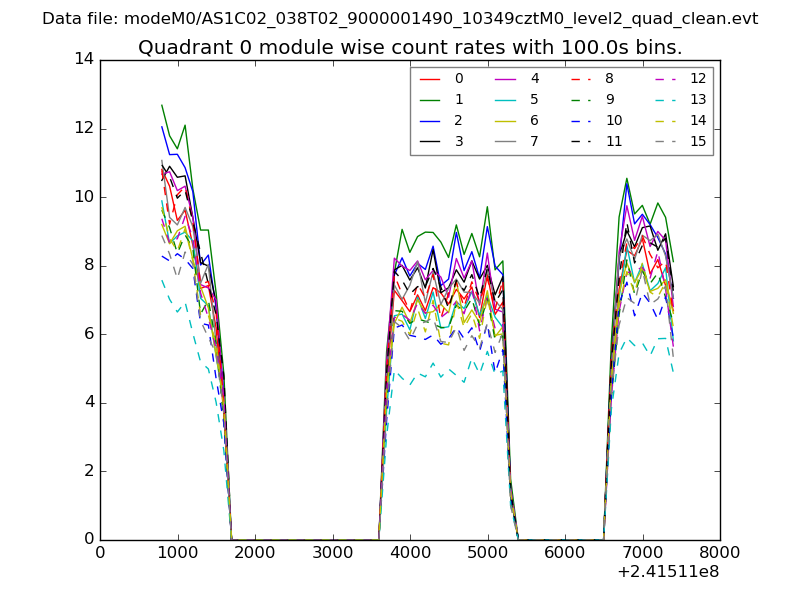 |
 |
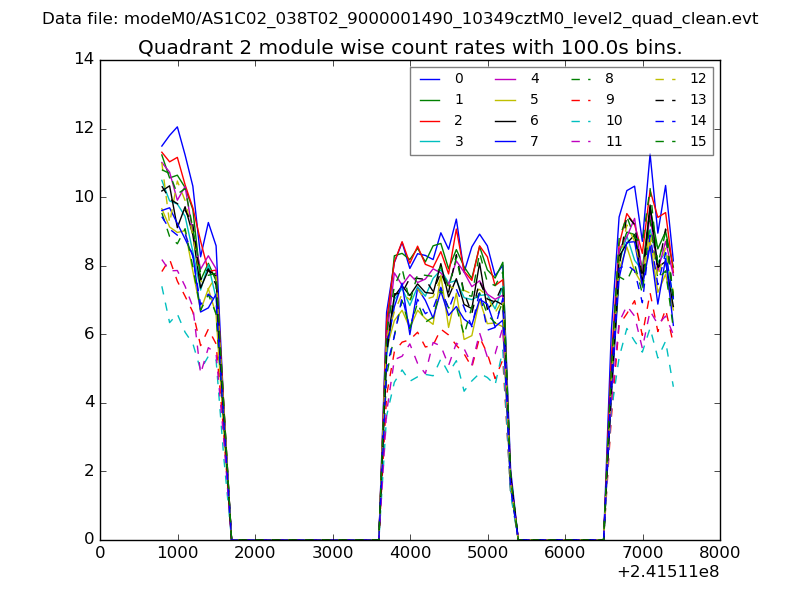
| Module-wise count rates for Quadrant B Data is divided into 100 sec bins |
 |
 |
| Module-wise count rates for Quadrant C Data is divided into 100 sec bins |
 |
 |
| Module-wise count rates for Quadrant D Data is divided into 100 sec bins |
 |
 |
| Parameter | Plot |
|---|---|
| CZT HV Monitor | 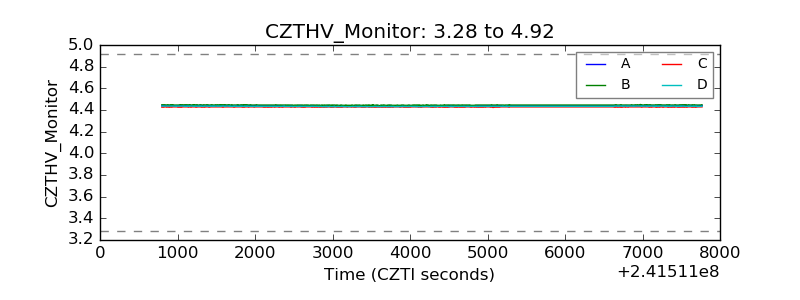 |
| D_VDD | 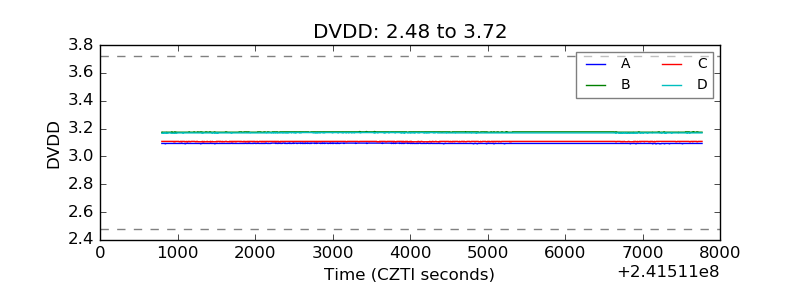 |
| Temperature 1 |  |
| Veto HV Monitor | 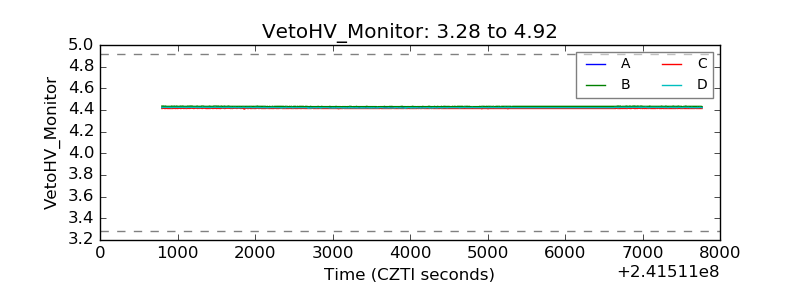 |
| Veto LLD |  |
| Alpha Counter | 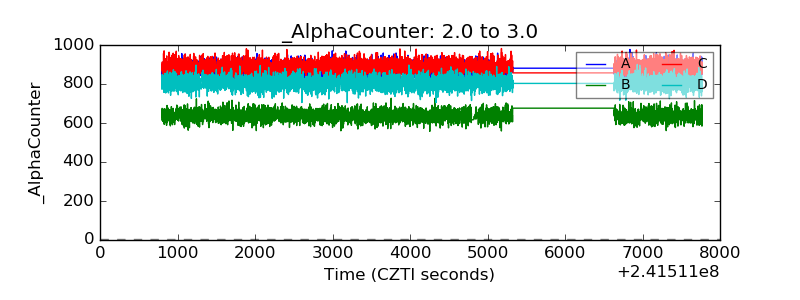 |
| _CPM_Rate |  |
| CZT Counter | 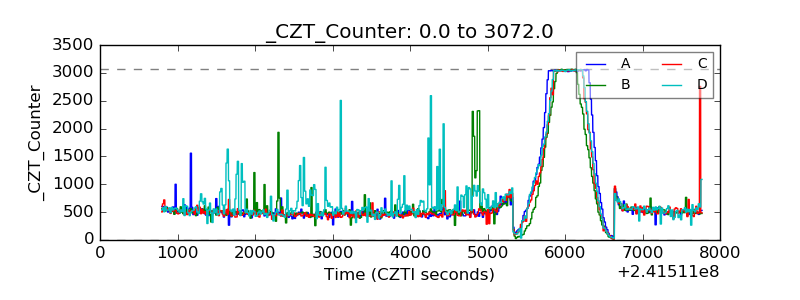 |
| +2.5 Volts monitor |  |
| +5 Volts monitor |  |
| _ROLL_ROT | 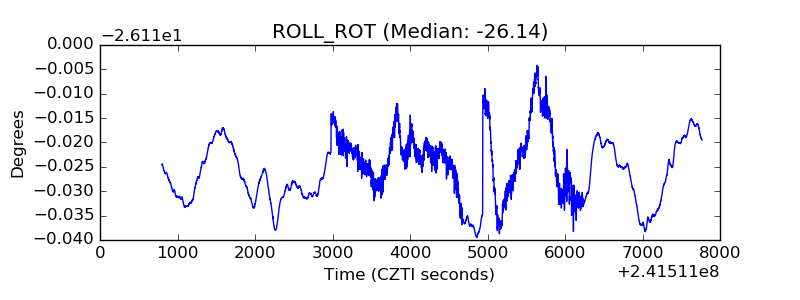 |
| _Roll_DEC | 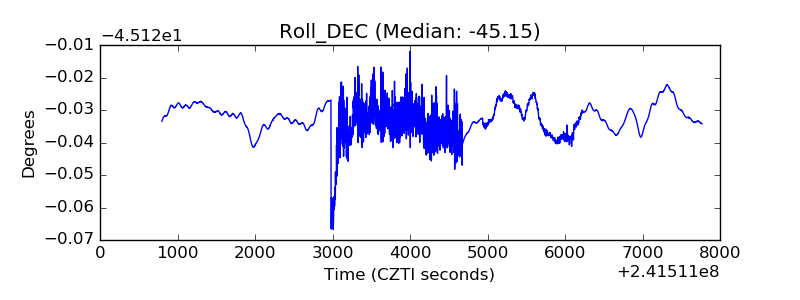 |
| _Roll_RA | 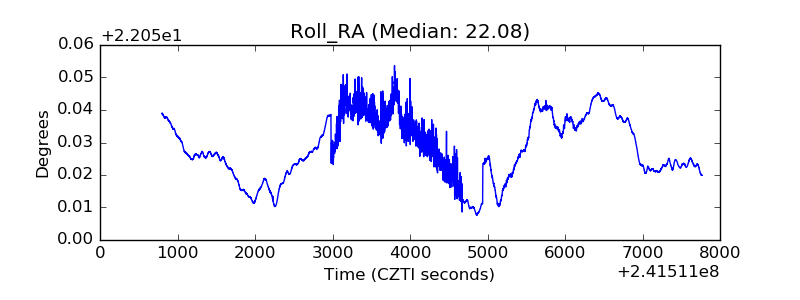 |
| Veto Counter | 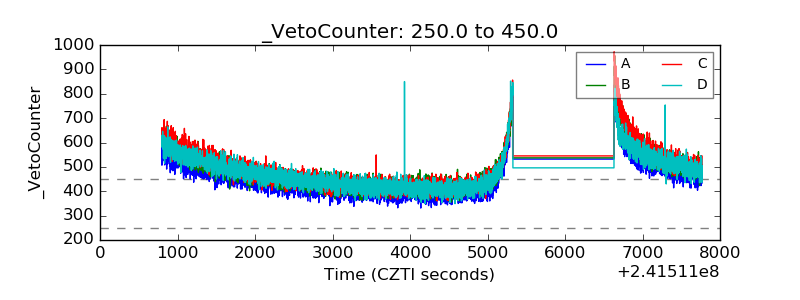 |