| Param | Original file | Final file |
|---|---|---|
| Filename | modeM0/AS1C02_038T02_9000001490_10351cztM0_level2.evt | modeM0/AS1C02_038T02_9000001490_10351cztM0_level2_quad_clean.evt |
| Size (bytes) | 765,567,360 | 115,237,440 |
| Size | 730.1 MB | 109.9 MB |
| Events in quadrant A | 4,885,873 | 693,305 |
| Events in quadrant B | 5,564,391 | 669,257 |
| Events in quadrant C | 4,881,156 | 692,810 |
| Events in quadrant D | 7,148,922 | 714,553 |
| Mode M9 | |||
|---|---|---|---|
| Quadrant | BADHDUFLAG | Total packets | Discarded packets |
| A | 0 | 30 | 9 |
| B | 0 | 31 | 10 |
| C | 0 | 31 | 10 |
| D | 0 | 28 | 7 |
| Mode SS | |||
|---|---|---|---|
| Quadrant | BADHDUFLAG | Total packets | Discarded packets |
| A | 0 | 374 | 149 |
| B | 0 | 374 | 154 |
| C | 0 | 374 | 151 |
| D | 0 | 364 | 140 |
| Mode M0 | |||
|---|---|---|---|
| Quadrant | BADHDUFLAG | Total packets | Discarded packets |
| A | 0 | 36743 | 15649 |
| B | 0 | 42875 | 20183 |
| C | 0 | 38040 | 16824 |
| D | 0 | 46028 | 17678 |
| Quadrant | Total seconds | Saturated seconds | Saturation percentage |
|---|---|---|---|
| A | 10280 | 195 | 1.896887% |
| B | 9968 | 401 | 4.022873% |
| C | 10288 | 146 | 1.419129% |
| D | 10966 | 308 | 2.808681% |
Noise dominated data is calculated using 1-second bins in cleaned event files. If a bin has >2000 counts, and if more than 50% of those come from <1% of pixels, then it is considered to be noise-dominated and hence unusable.
| Quadrant | # 1 sec bins | Bins with >0 counts | Bins with >2000 counts | High rate bins dominated by noise | Noise dominated (total time) | Noise dominated (detector-on time) | Marked lightcurve |
|---|---|---|---|---|---|---|---|
| A | 13602 | 11241 | 0 | 0 | 0.00% | 0.00% | 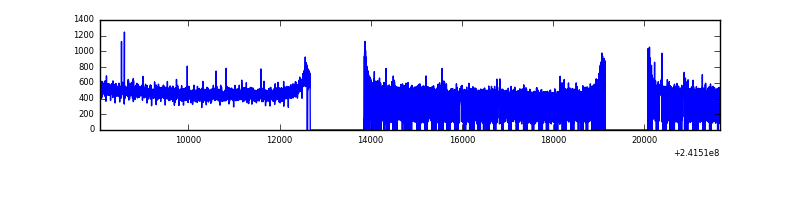 |
| B | 13602 | 11012 | 161 | 161 | 1.18% | 1.46% | 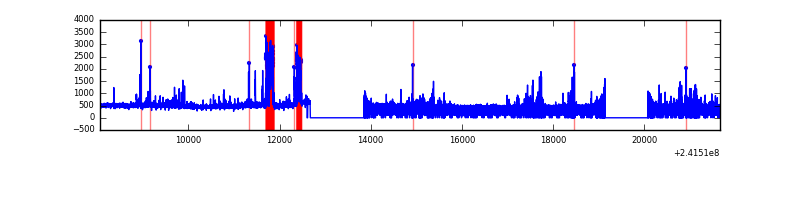 |
| C | 13601 | 11224 | 10 | 10 | 0.07% | 0.09% | 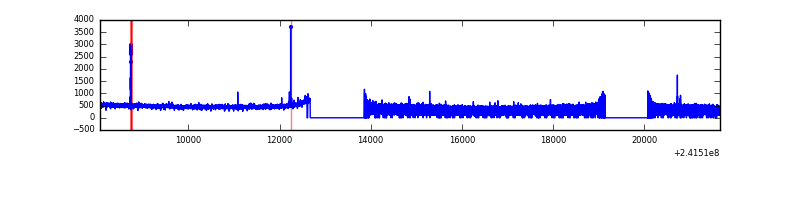 |
| D | 13602 | 11324 | 147 | 147 | 1.08% | 1.30% | 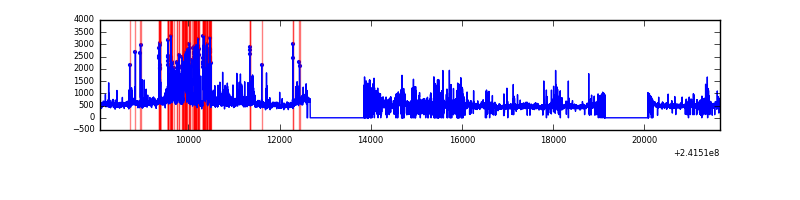 |
Top three noisy pixels from each quadrant. If the there are fewer than three noisy pixels in the level2.evt file, extra rows are filled as -1
| Pixel properties | Quadrant properties | ||||||
|---|---|---|---|---|---|---|---|
| Quadrant | DetID | PixID | Counts | Sigma | Mean | Median | Sigma |
| A | 3 | 1 | 11872 | 41.82 | 1265 | 1238 | 254.3 |
| A | 0 | 226 | 11482 | 40.29 | 1265 | 1238 | 254.3 |
| A | 12 | 194 | 10541 | 36.59 | 1265 | 1238 | 254.3 |
| B | 4 | 239 | 634586 | 2790.78 | 1208 | 1178 | 227.0 |
| B | 11 | 51 | 108658 | 473.55 | 1208 | 1178 | 227.0 |
| B | 0 | 219 | 53995 | 232.71 | 1208 | 1178 | 227.0 |
| C | 14 | 234 | 47714 | 164.21 | 1234 | 1242 | 283.0 |
| C | 4 | 175 | 22365 | 74.64 | 1234 | 1242 | 283.0 |
| C | 13 | 61 | 9122 | 27.84 | 1234 | 1242 | 283.0 |
| D | 1 | 52 | 1032393 | 3335.69 | 1305 | 1269 | 309.1 |
| D | 8 | 195 | 510126 | 1646.15 | 1305 | 1269 | 309.1 |
| D | 2 | 33 | 224420 | 721.89 | 1305 | 1269 | 309.1 |
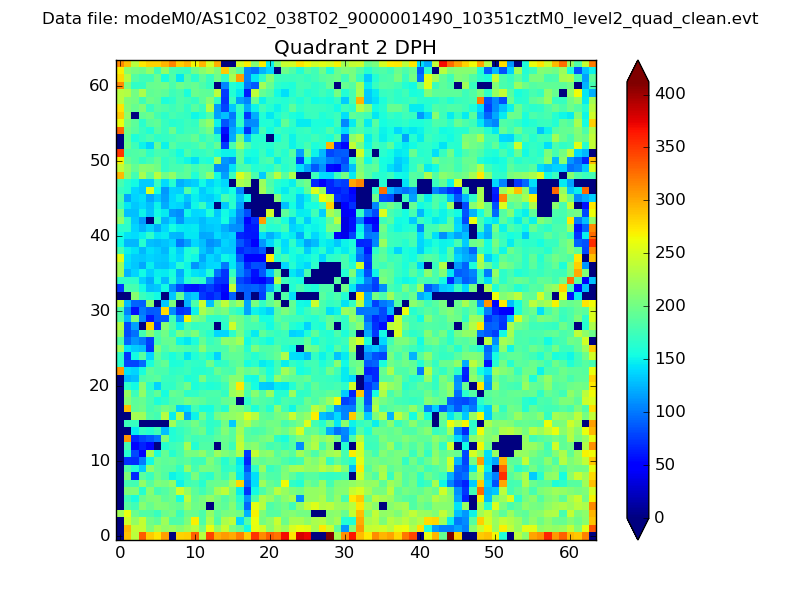
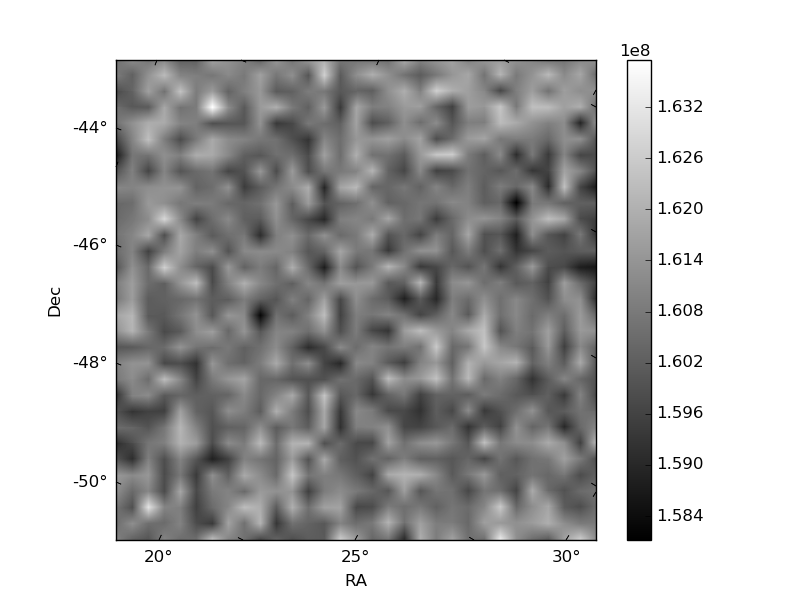
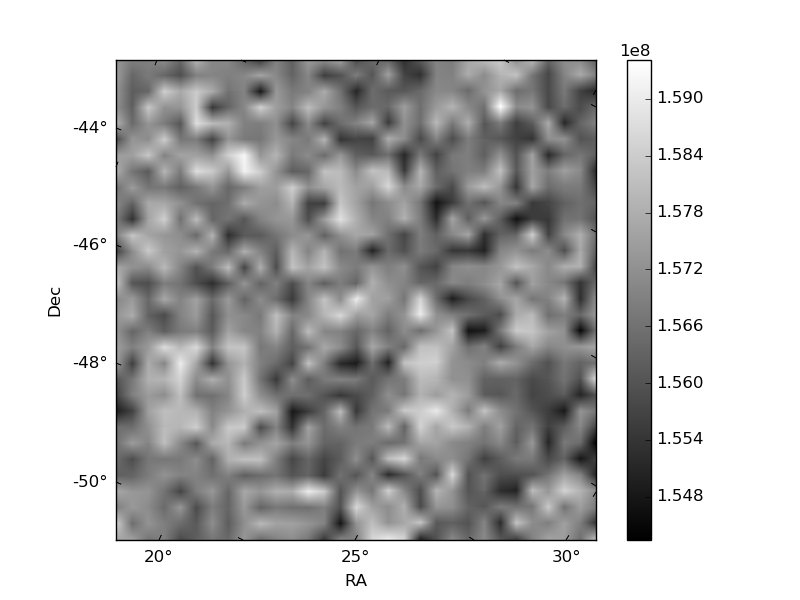
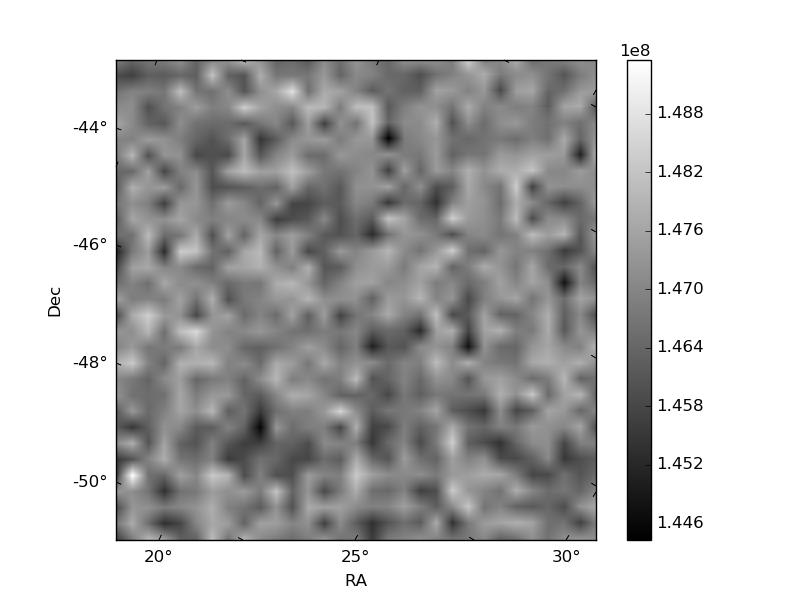
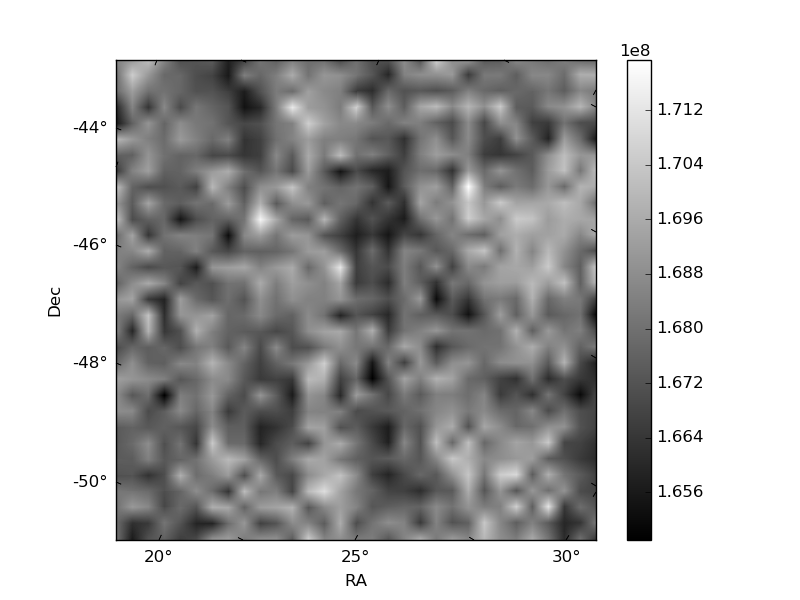
Histogram calculated using DETX and DETY for each event in the final _common_clean file
| Quadrant A | 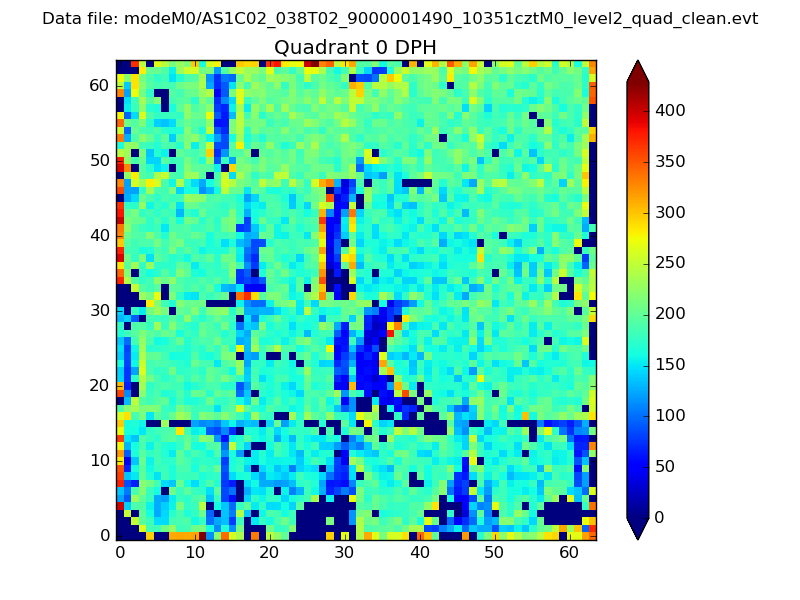 |
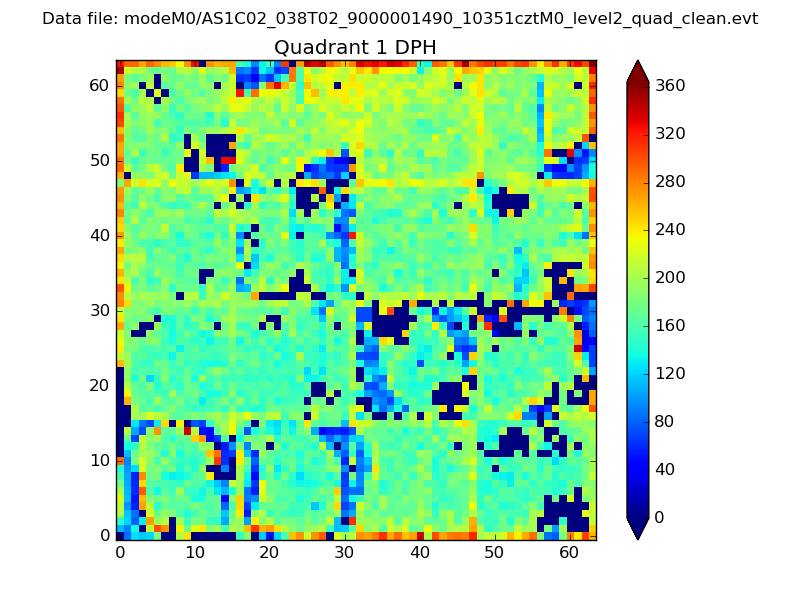 |
Quadrant B |
|---|---|---|---|
| Quadrant D | 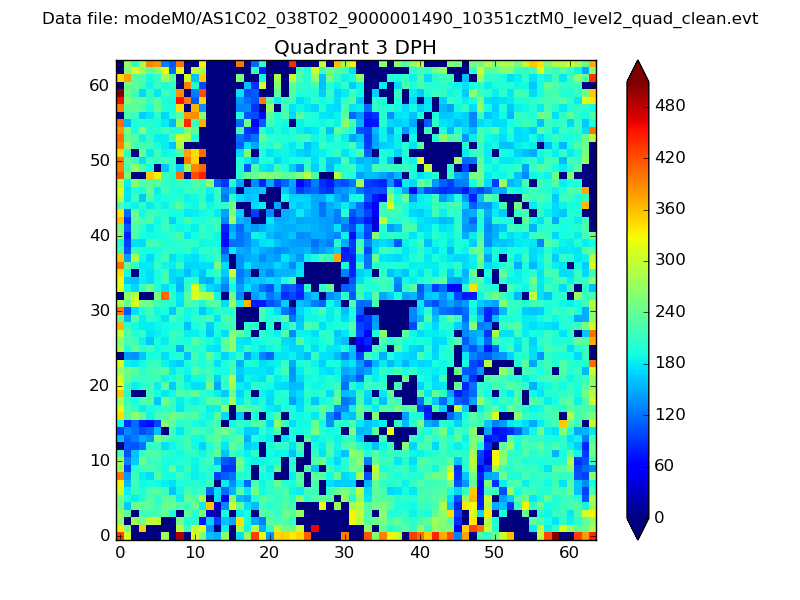 |
 |
Quadrant C |
| Plot type | Count rate plots | Images |
|---|---|---|
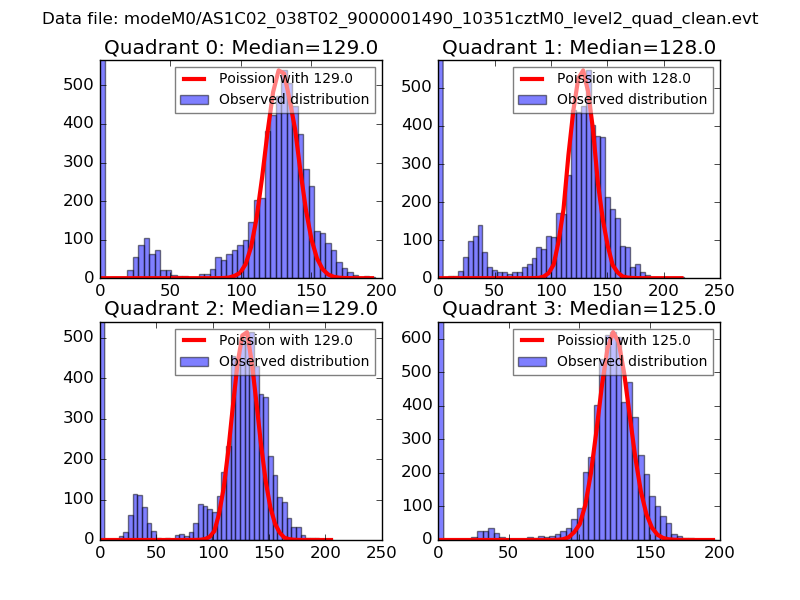
| Comparison with Poisson distribution Blue bars denote a histogram of data divided into 1 sec bins. Red curve is a Poisson curve with rate = median count rate of data. |
 |
 |
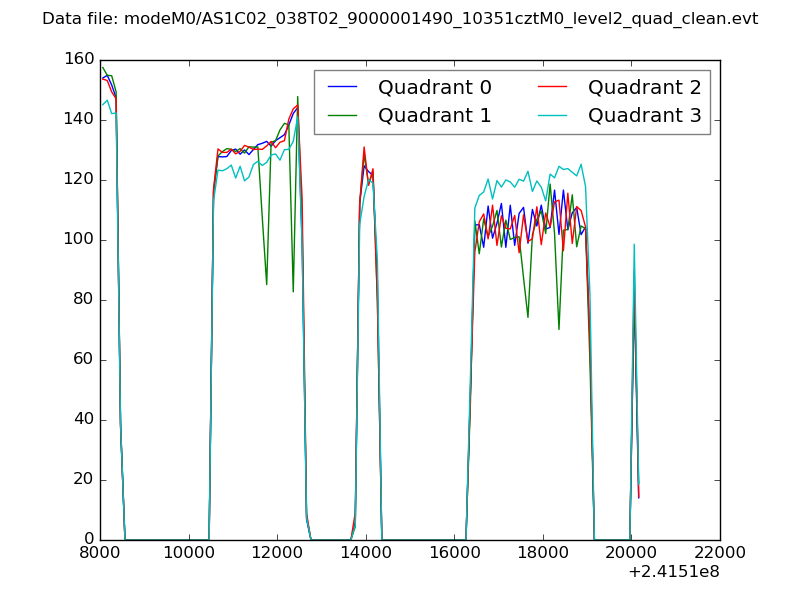
| Quadrant-wise count rates Data is divided into 100 sec bins |
 |
|
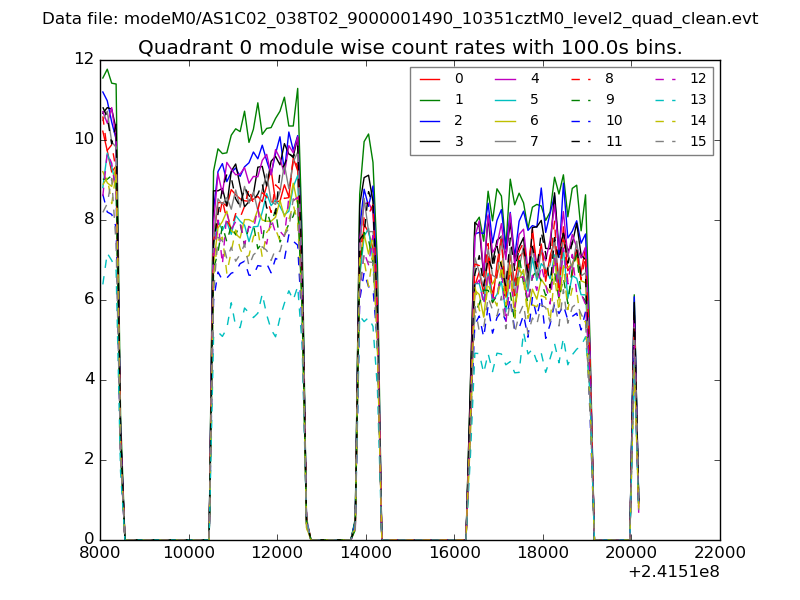
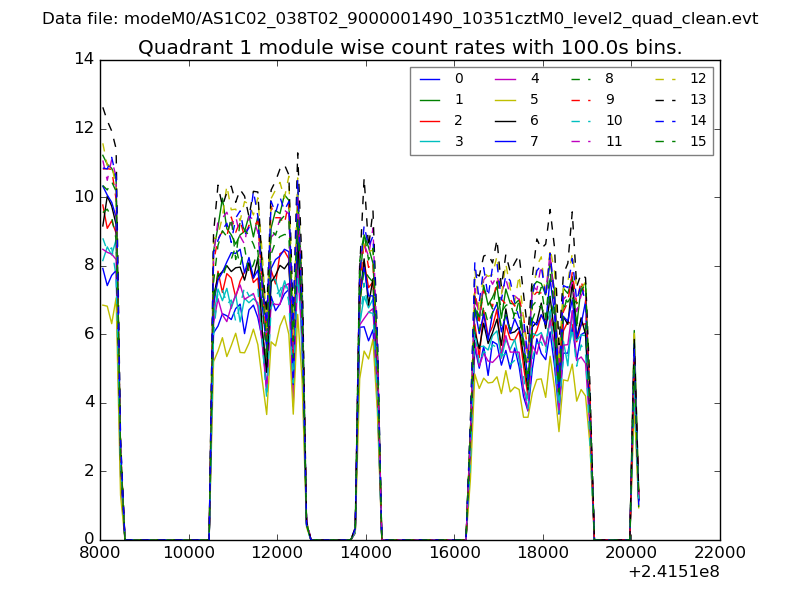
| Module-wise count rates for Quadrant A Data is divided into 100 sec bins |
 |
 |
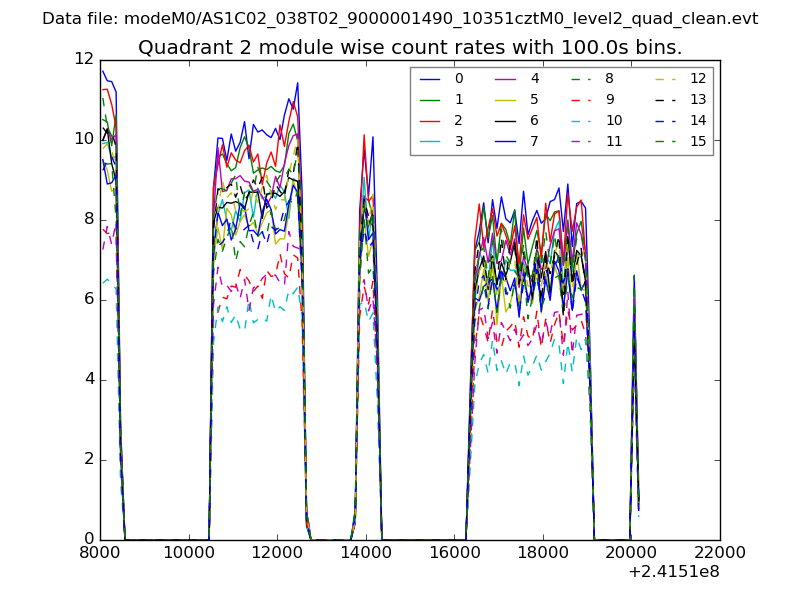
| Module-wise count rates for Quadrant B Data is divided into 100 sec bins |
 |
 |
| Module-wise count rates for Quadrant C Data is divided into 100 sec bins |
 |
 |
| Module-wise count rates for Quadrant D Data is divided into 100 sec bins |
 |
 |
| Parameter | Plot |
|---|---|
| CZT HV Monitor | 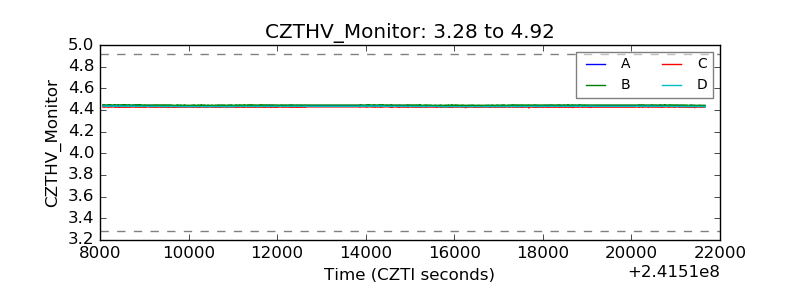 |
| D_VDD | 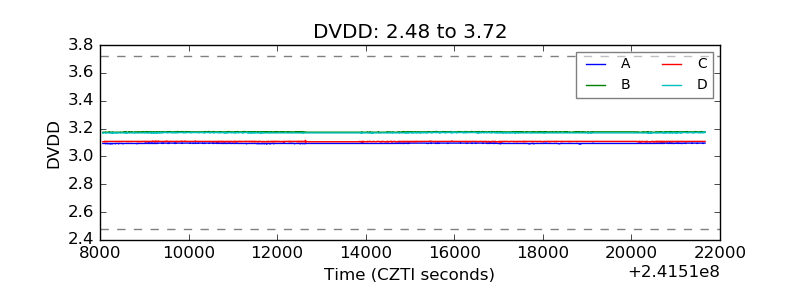 |
| Temperature 1 | 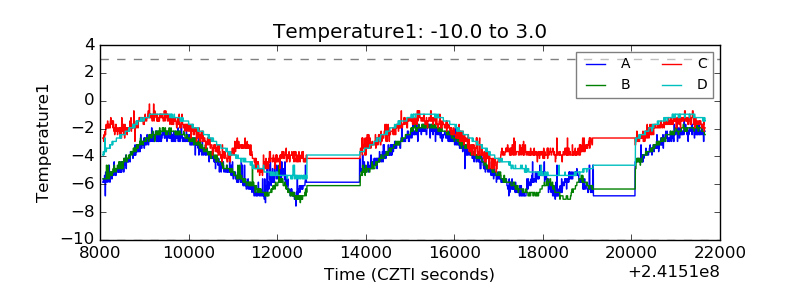 |
| Veto HV Monitor | 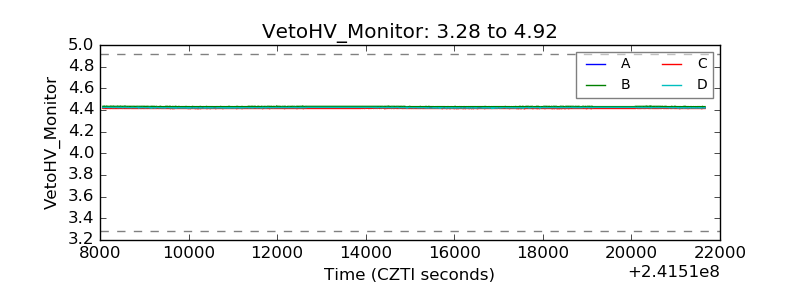 |
| Veto LLD | 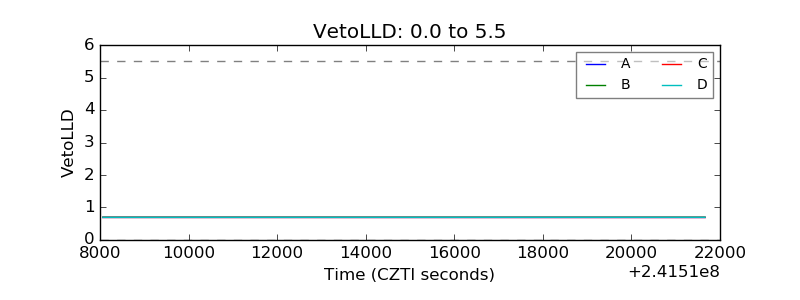 |
| Alpha Counter | 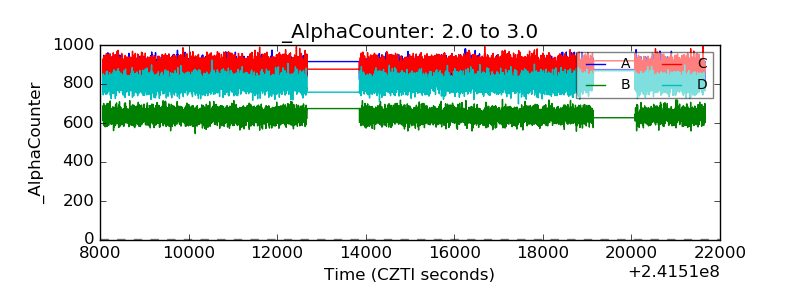 |
| _CPM_Rate | 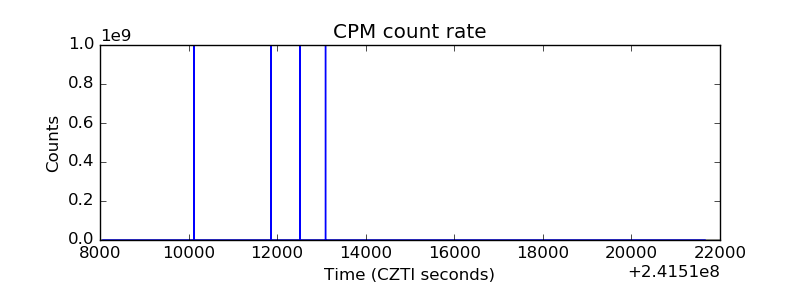 |
| CZT Counter | 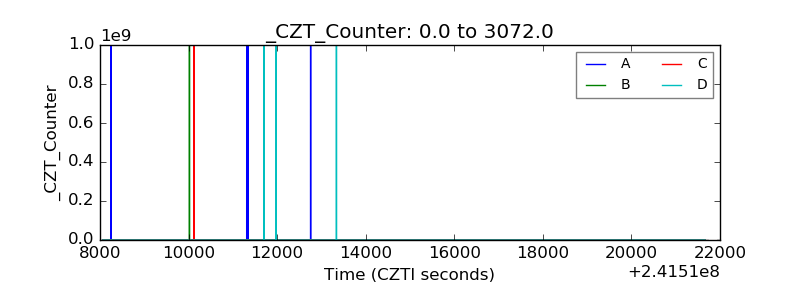 |
| +2.5 Volts monitor |  |
| +5 Volts monitor |  |
| _ROLL_ROT |  |
| _Roll_DEC |  |
| _Roll_RA | 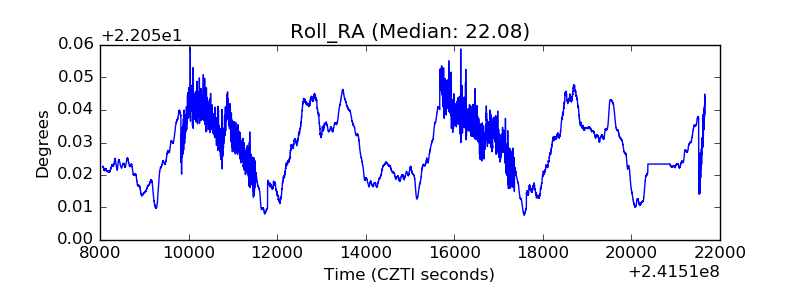 |
| Veto Counter | 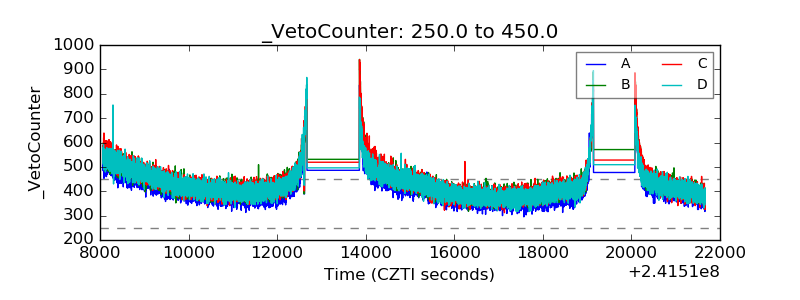 |