| Param | Original file | Final file |
|---|---|---|
| Filename | modeM0/AS1C02_038T02_9000001490_10352cztM0_level2.evt | modeM0/AS1C02_038T02_9000001490_10352cztM0_level2_quad_clean.evt |
| Size (bytes) | 509,463,360 | 75,493,440 |
| Size | 485.9 MB | 72.0 MB |
| Events in quadrant A | 3,441,188 | 445,216 |
| Events in quadrant B | 4,124,929 | 447,126 |
| Events in quadrant C | 3,424,832 | 449,200 |
| Events in quadrant D | 3,939,325 | 433,091 |
| Mode M9 | |||
|---|---|---|---|
| Quadrant | BADHDUFLAG | Total packets | Discarded packets |
| A | 0 | 12 | 0 |
| B | 0 | 12 | 0 |
| C | 0 | 12 | 0 |
| D | 0 | 13 | 0 |
| Mode SS | |||
|---|---|---|---|
| Quadrant | BADHDUFLAG | Total packets | Discarded packets |
| A | 0 | 148 | 0 |
| B | 0 | 148 | 0 |
| C | 0 | 148 | 0 |
| D | 0 | 148 | 0 |
| Mode M0 | |||
|---|---|---|---|
| Quadrant | BADHDUFLAG | Total packets | Discarded packets |
| A | 0 | 15245 | 3 |
| B | 0 | 17093 | 2 |
| C | 0 | 15281 | 2 |
| D | 0 | 16341 | 2 |
| Quadrant | Total seconds | Saturated seconds | Saturation percentage |
|---|---|---|---|
| A | 7343 | 172 | 2.342367% |
| B | 7343 | 300 | 4.085524% |
| C | 7343 | 115 | 1.566117% |
| D | 7343 | 149 | 2.029143% |
Noise dominated data is calculated using 1-second bins in cleaned event files. If a bin has >2000 counts, and if more than 50% of those come from <1% of pixels, then it is considered to be noise-dominated and hence unusable.
| Quadrant | # 1 sec bins | Bins with >0 counts | Bins with >2000 counts | High rate bins dominated by noise | Noise dominated (total time) | Noise dominated (detector-on time) | Marked lightcurve |
|---|---|---|---|---|---|---|---|
| A | 7898 | 7343 | 0 | 0 | 0.00% | 0.00% | 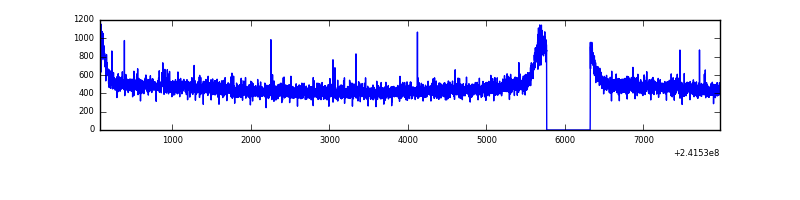 |
| B | 7898 | 7343 | 78 | 78 | 0.99% | 1.06% | 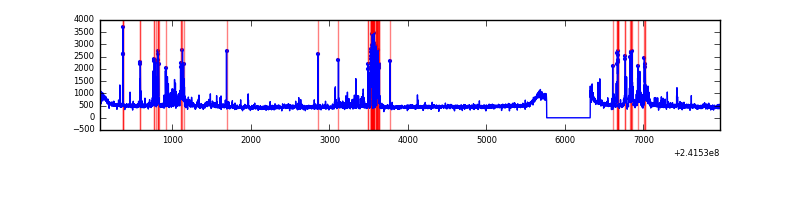 |
| C | 7898 | 7343 | 1 | 1 | 0.01% | 0.01% | 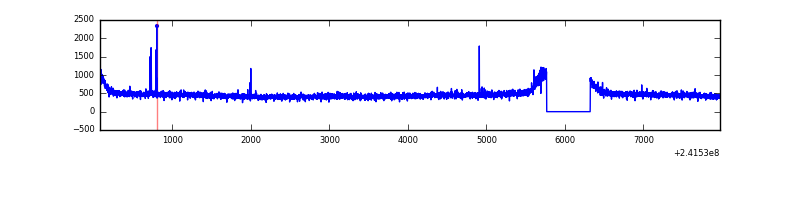 |
| D | 7898 | 7343 | 27 | 27 | 0.34% | 0.37% | 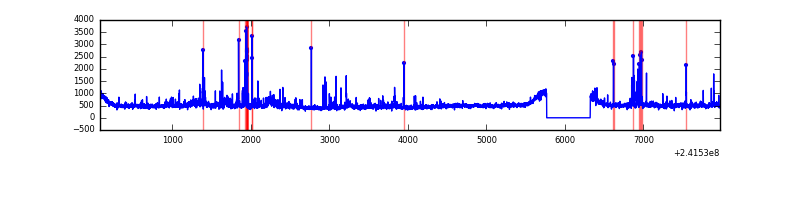 |
Top three noisy pixels from each quadrant. If the there are fewer than three noisy pixels in the level2.evt file, extra rows are filled as -1
| Pixel properties | Quadrant properties | ||||||
|---|---|---|---|---|---|---|---|
| Quadrant | DetID | PixID | Counts | Sigma | Mean | Median | Sigma |
| A | 3 | 1 | 9481 | 47.55 | 889 | 867 | 181.2 |
| A | 13 | 251 | 8858 | 44.11 | 889 | 867 | 181.2 |
| A | 0 | 226 | 8069 | 39.76 | 889 | 867 | 181.2 |
| B | 4 | 239 | 477961 | 2791.57 | 885 | 861 | 170.9 |
| B | 0 | 214 | 72806 | 420.96 | 885 | 861 | 170.9 |
| B | 0 | 219 | 43574 | 249.92 | 885 | 861 | 170.9 |
| C | 14 | 234 | 20322 | 95.67 | 871 | 876 | 203.3 |
| C | 4 | 175 | 7985 | 34.98 | 871 | 876 | 203.3 |
| C | 13 | 61 | 6528 | 27.81 | 871 | 876 | 203.3 |
| D | 8 | 195 | 278107 | 1338.03 | 867 | 843 | 207.2 |
| D | 1 | 52 | 135337 | 649.05 | 867 | 843 | 207.2 |
| D | 2 | 33 | 96784 | 462.99 | 867 | 843 | 207.2 |
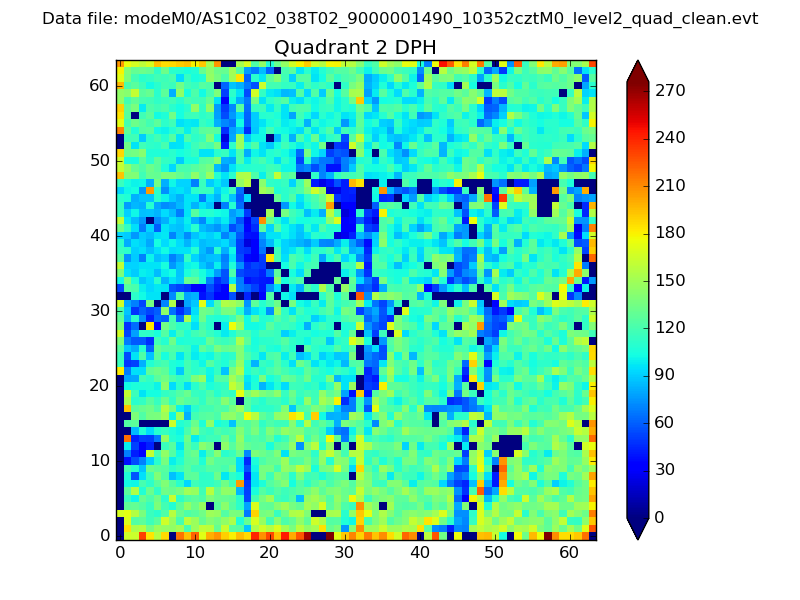
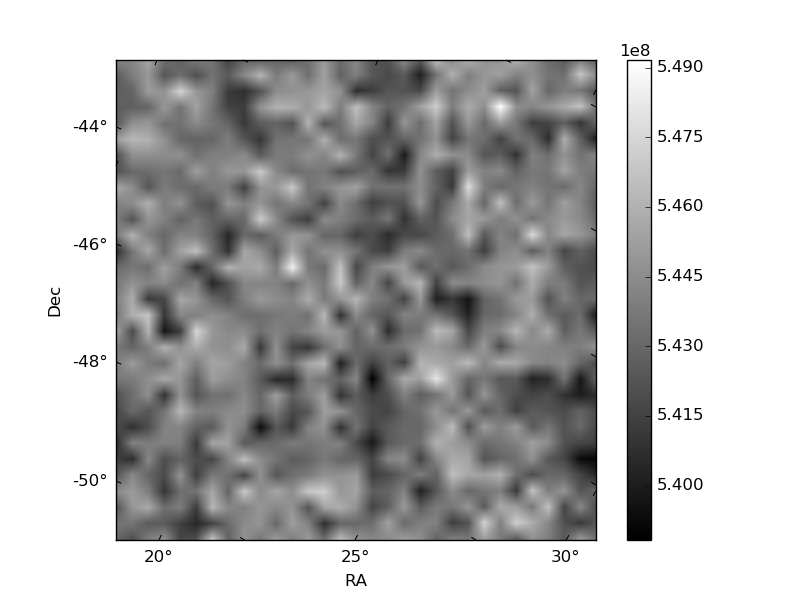
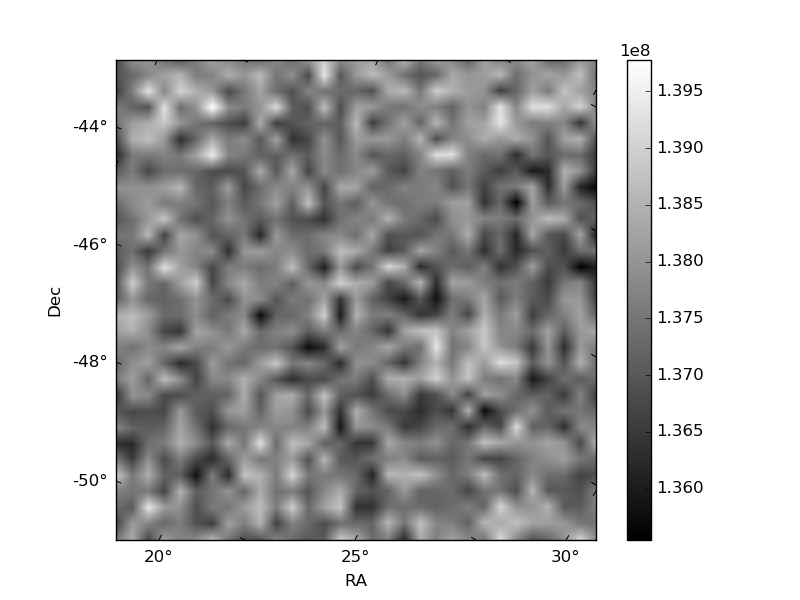
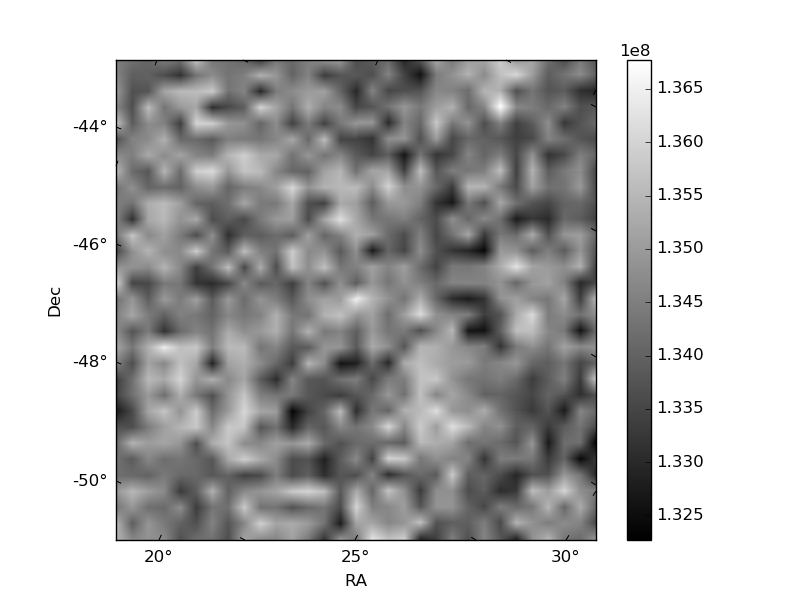
Histogram calculated using DETX and DETY for each event in the final _common_clean file
| Quadrant A | 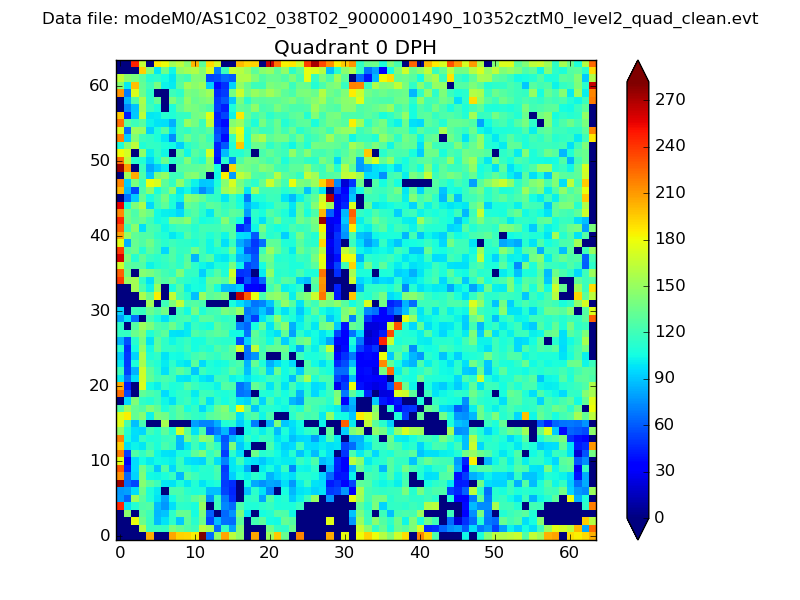 |
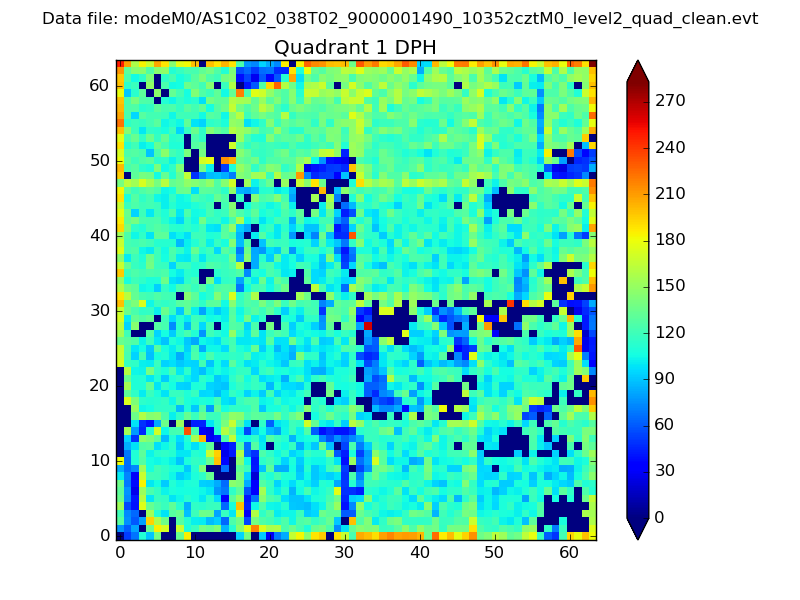 |
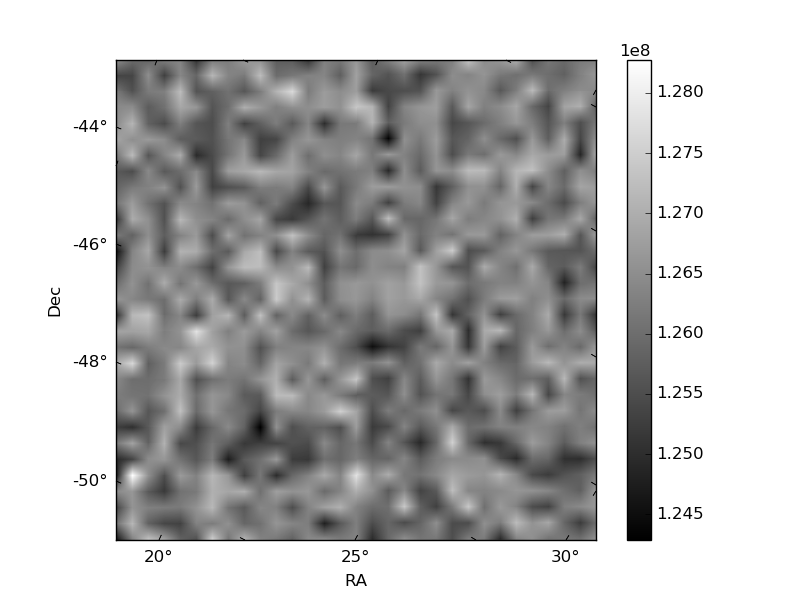
Quadrant B |
|---|---|---|---|
| Quadrant D | 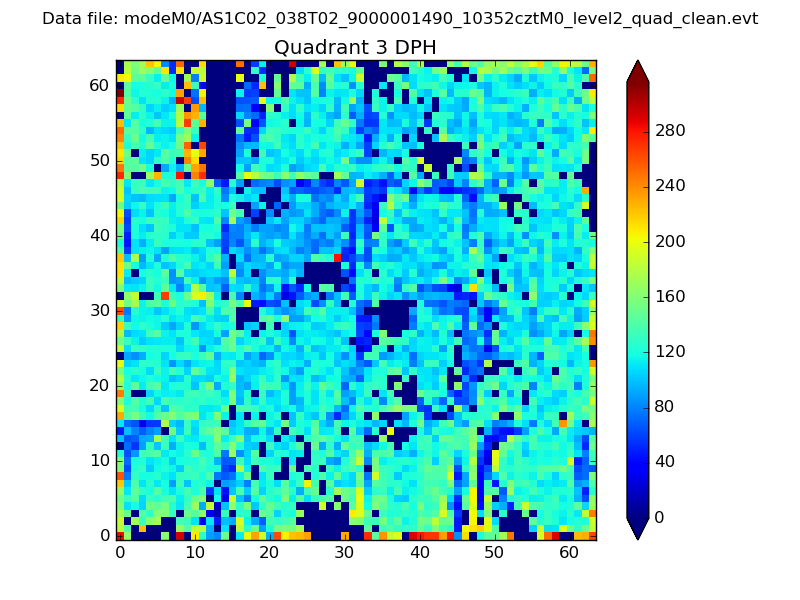 |
 |
Quadrant C |
| Plot type | Count rate plots | Images |
|---|---|---|
| Comparison with Poisson distribution Blue bars denote a histogram of data divided into 1 sec bins. Red curve is a Poisson curve with rate = median count rate of data. |
 |
 |
| Quadrant-wise count rates Data is divided into 100 sec bins |
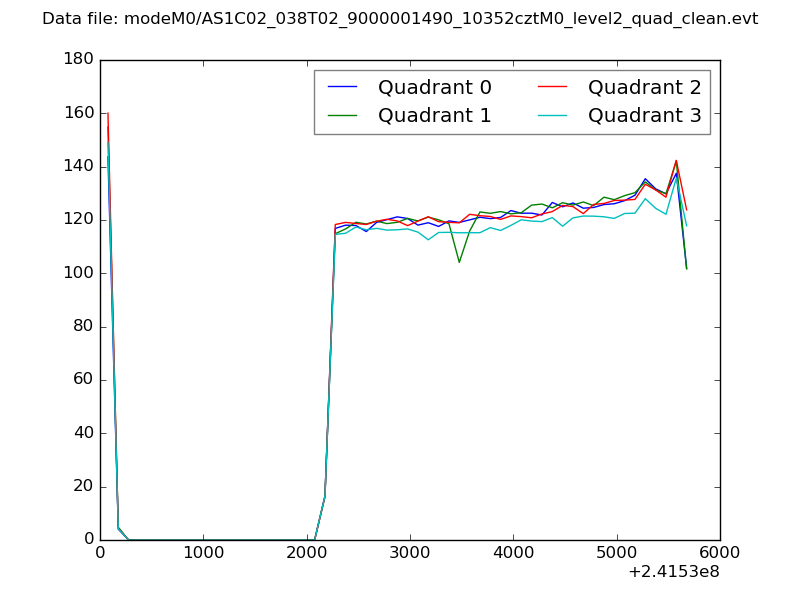 |
|
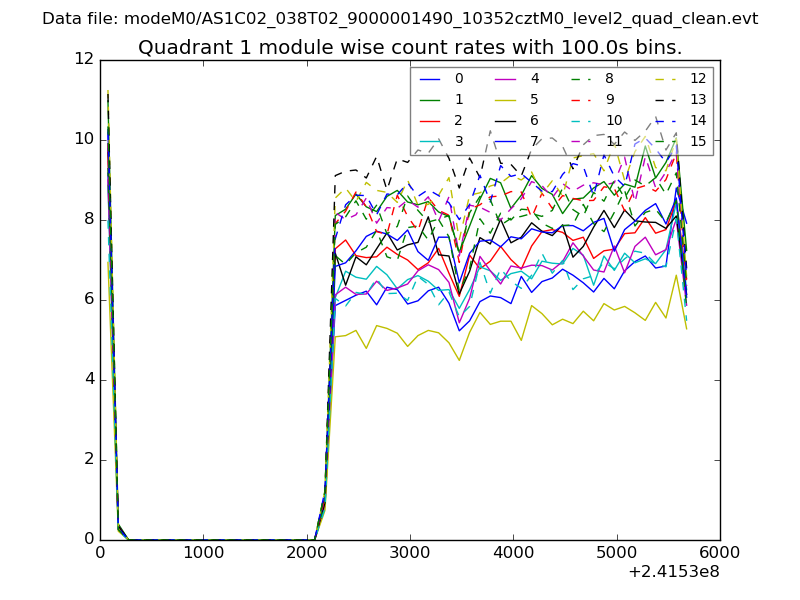
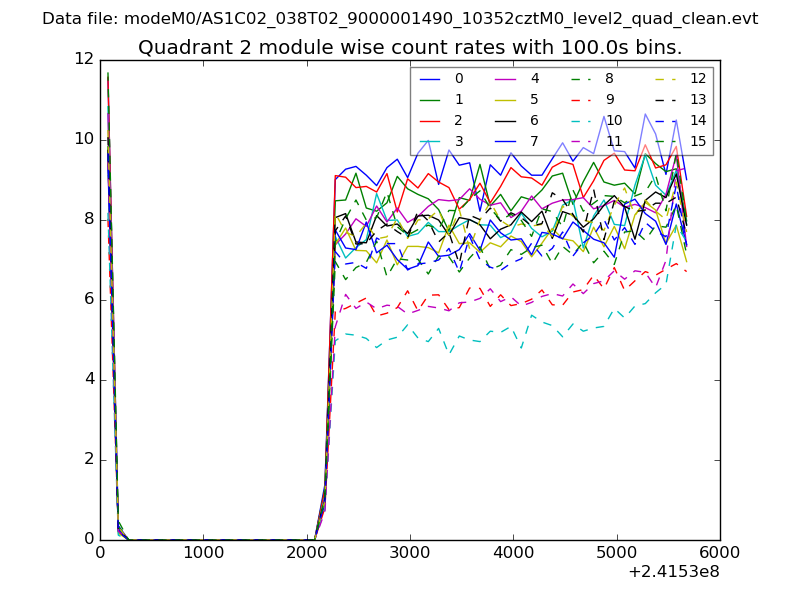
| Module-wise count rates for Quadrant A Data is divided into 100 sec bins |
 |
 |
| Module-wise count rates for Quadrant B Data is divided into 100 sec bins |
 |
 |
| Module-wise count rates for Quadrant C Data is divided into 100 sec bins |
 |
 |
| Module-wise count rates for Quadrant D Data is divided into 100 sec bins |
 |
 |
| Parameter | Plot |
|---|---|
| CZT HV Monitor | 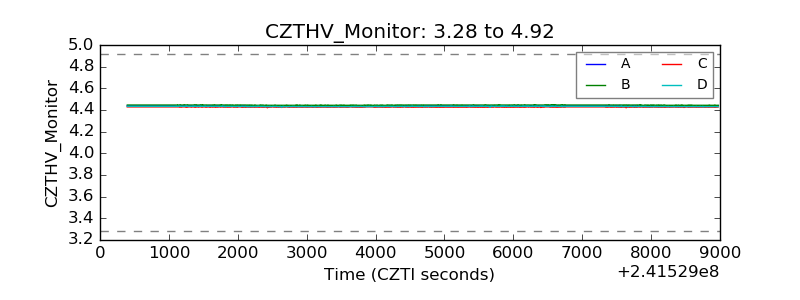 |
| D_VDD | 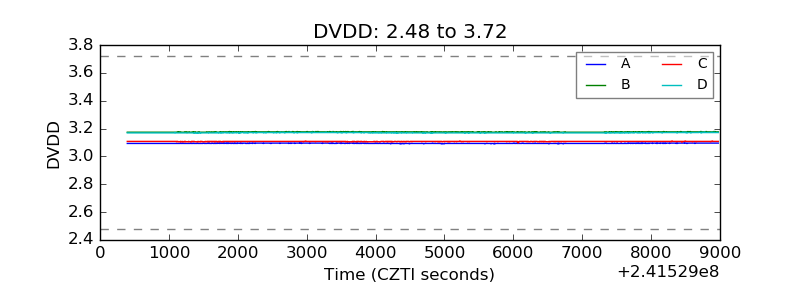 |
| Temperature 1 | 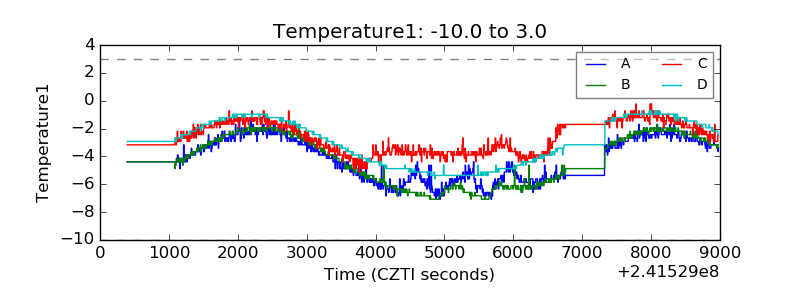 |
| Veto HV Monitor | 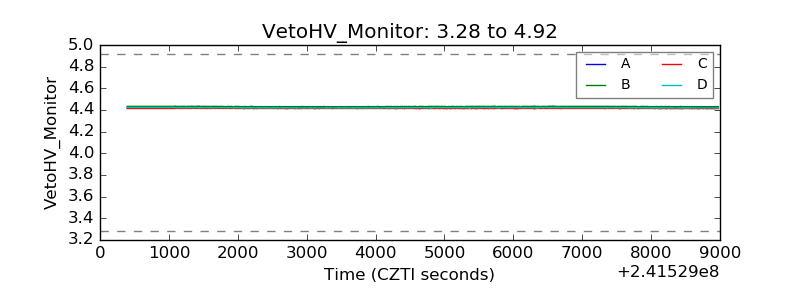 |
| Veto LLD | 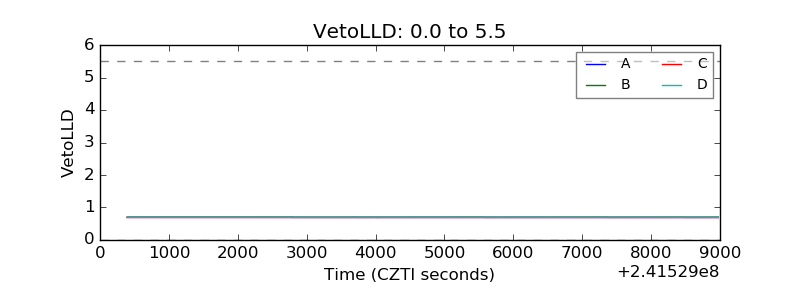 |
| Alpha Counter | 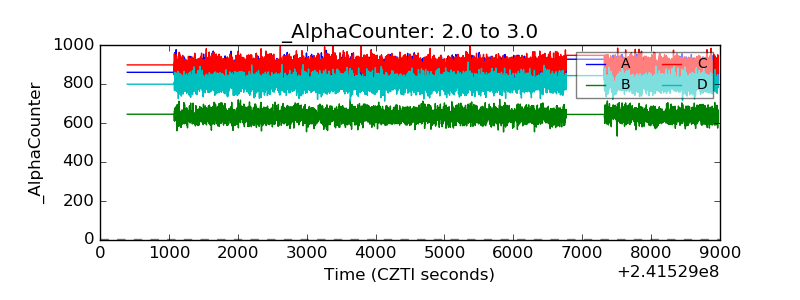 |
| _CPM_Rate | 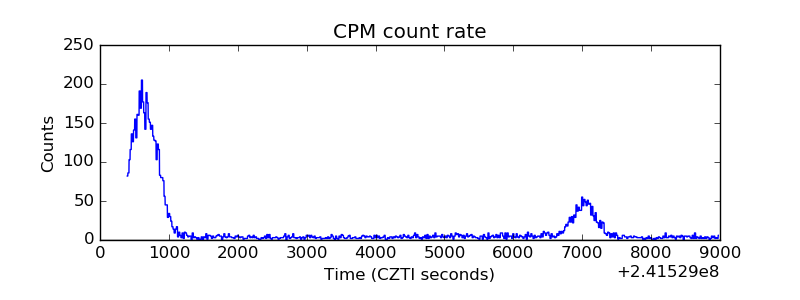 |
| CZT Counter | 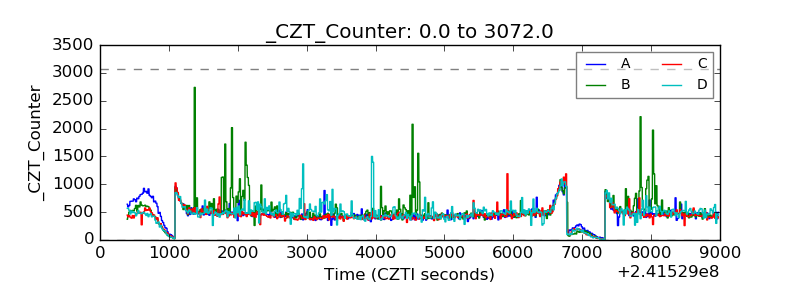 |
| +2.5 Volts monitor |  |
| +5 Volts monitor |  |
| _ROLL_ROT |  |
| _Roll_DEC |  |
| _Roll_RA | 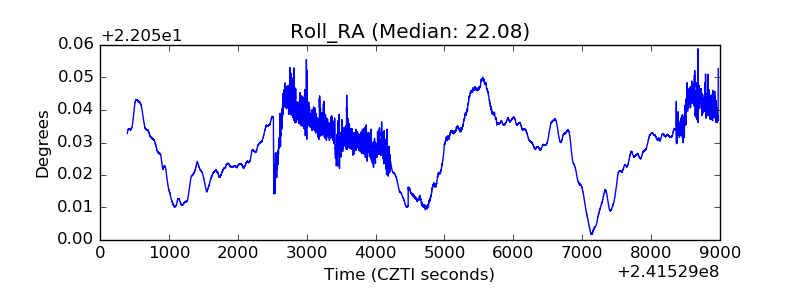 |
| Veto Counter | 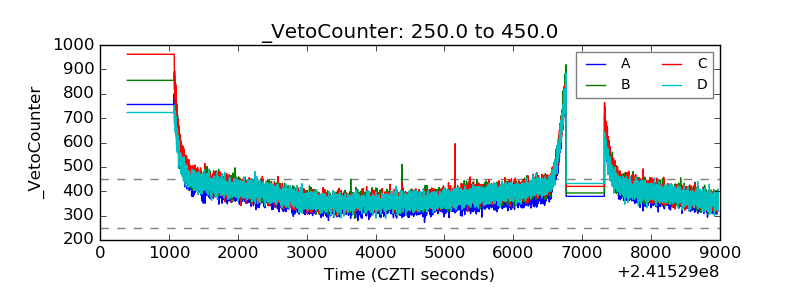 |