| Param | Original file | Final file |
|---|---|---|
| Filename | modeM0/AS1C02_038T02_9000001490_10353cztM0_level2.evt | modeM0/AS1C02_038T02_9000001490_10353cztM0_level2_quad_clean.evt |
| Size (bytes) | 183,012,480 | 32,929,920 |
| Size | 174.5 MB | 31.4 MB |
| Events in quadrant A | 1,251,355 | 196,964 |
| Events in quadrant B | 1,357,220 | 183,767 |
| Events in quadrant C | 1,263,472 | 196,244 |
| Events in quadrant D | 1,469,871 | 212,682 |
| Mode M9 | |||
|---|---|---|---|
| Quadrant | BADHDUFLAG | Total packets | Discarded packets |
| A | 0 | 3 | 0 |
| B | 0 | 3 | 1 |
| C | 0 | 3 | 1 |
| D | 0 | 4 | 1 |
| Mode SS | |||
|---|---|---|---|
| Quadrant | BADHDUFLAG | Total packets | Discarded packets |
| A | 0 | 184 | 124 |
| B | 0 | 184 | 130 |
| C | 0 | 183 | 127 |
| D | 0 | 173 | 119 |
| Mode M0 | |||
|---|---|---|---|
| Quadrant | BADHDUFLAG | Total packets | Discarded packets |
| A | 0 | 17675 | 11852 |
| B | 0 | 21644 | 15905 |
| C | 0 | 18425 | 12517 |
| D | 0 | 18560 | 12025 |
| Quadrant | Total seconds | Saturated seconds | Saturation percentage |
|---|---|---|---|
| A | 2891 | 7 | 0.242131% |
| B | 2677 | 12 | 0.448263% |
| C | 2931 | 2 | 0.068236% |
| D | 3151 | 2 | 0.063472% |
Noise dominated data is calculated using 1-second bins in cleaned event files. If a bin has >2000 counts, and if more than 50% of those come from <1% of pixels, then it is considered to be noise-dominated and hence unusable.
| Quadrant | # 1 sec bins | Bins with >0 counts | Bins with >2000 counts | High rate bins dominated by noise | Noise dominated (total time) | Noise dominated (detector-on time) | Marked lightcurve |
|---|---|---|---|---|---|---|---|
| A | 4572 | 3869 | 0 | 0 | 0.00% | 0.00% | 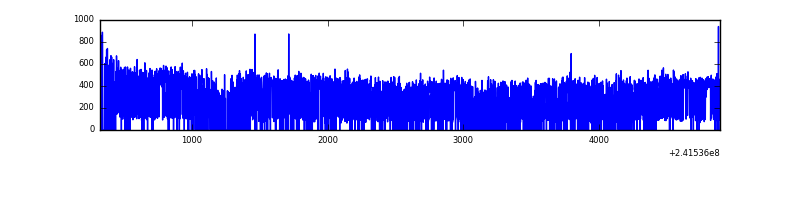 |
| B | 4572 | 3602 | 0 | 0 | 0.00% | 0.00% | 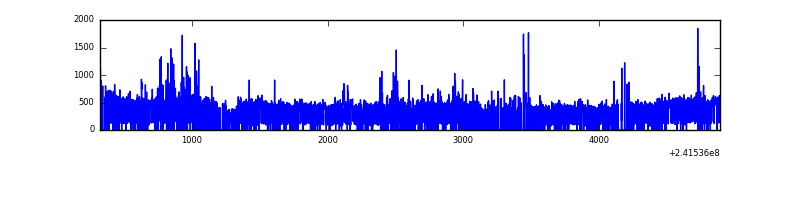 |
| C | 4572 | 3875 | 0 | 0 | 0.00% | 0.00% | 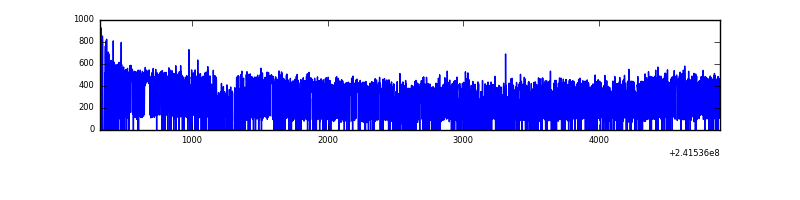 |
| D | 4570 | 3978 | 1 | 1 | 0.02% | 0.03% | 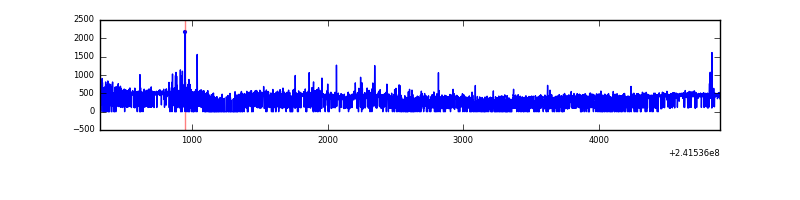 |
Top three noisy pixels from each quadrant. If the there are fewer than three noisy pixels in the level2.evt file, extra rows are filled as -1
| Pixel properties | Quadrant properties | ||||||
|---|---|---|---|---|---|---|---|
| Quadrant | DetID | PixID | Counts | Sigma | Mean | Median | Sigma |
| A | 13 | 251 | 3572 | 48.08 | 323 | 315 | 67.7 |
| A | 0 | 226 | 2934 | 38.66 | 323 | 315 | 67.7 |
| A | 12 | 194 | 2765 | 36.17 | 323 | 315 | 67.7 |
| B | 4 | 239 | 80246 | 1366.64 | 301 | 293 | 58.5 |
| B | 3 | 208 | 46879 | 796.3 | 301 | 293 | 58.5 |
| B | 11 | 51 | 17926 | 301.4 | 301 | 293 | 58.5 |
| C | 4 | 175 | 4121 | 49.59 | 322 | 323 | 76.6 |
| C | 13 | 61 | 2423 | 27.42 | 322 | 323 | 76.6 |
| C | 14 | 234 | 1739 | 18.49 | 322 | 323 | 76.6 |
| D | 8 | 195 | 92032 | 1110.77 | 342 | 333 | 82.6 |
| D | 1 | 52 | 26171 | 312.98 | 342 | 333 | 82.6 |
| D | 2 | 33 | 20914 | 249.3 | 342 | 333 | 82.6 |
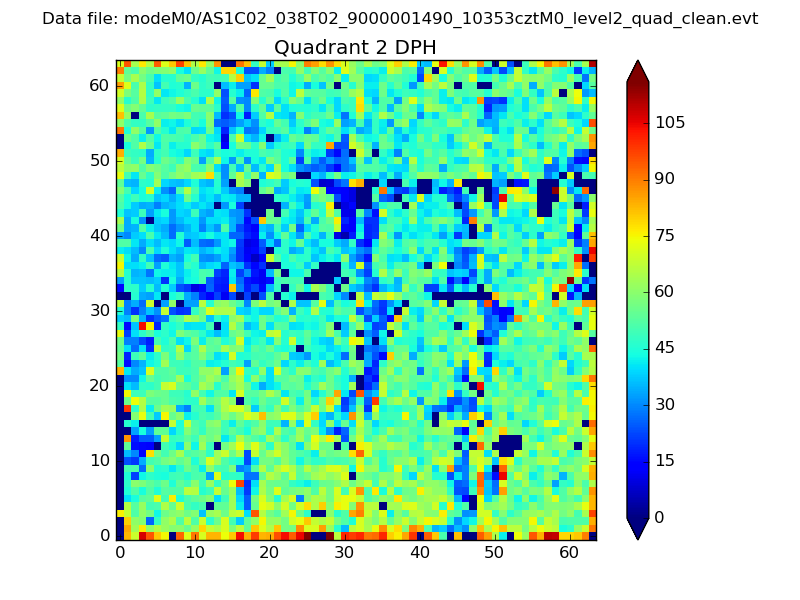
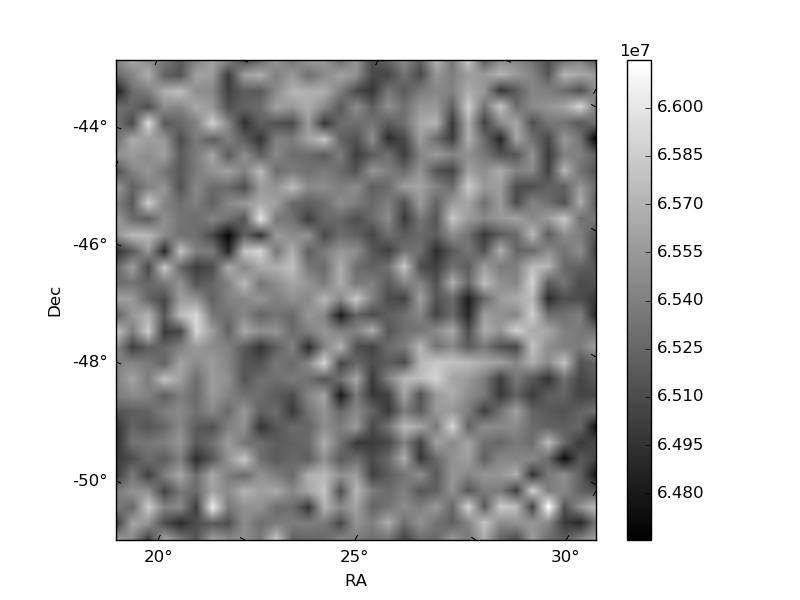
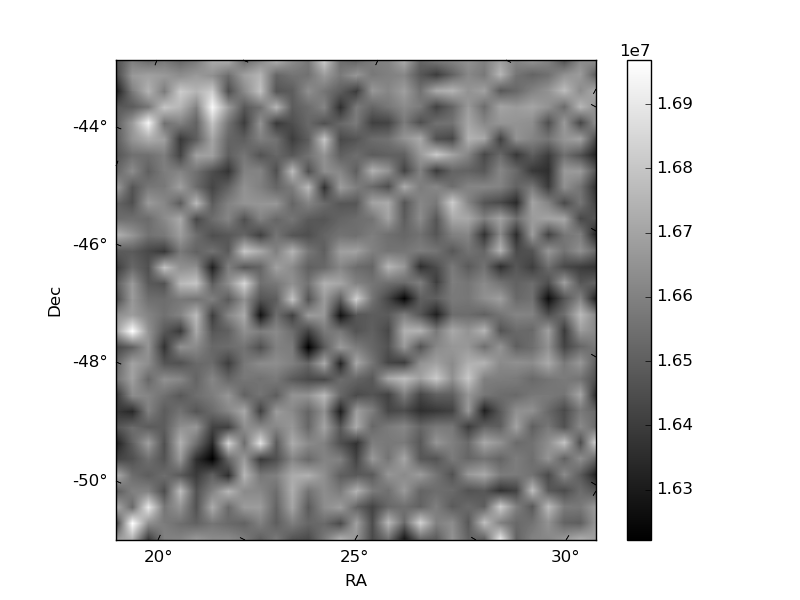
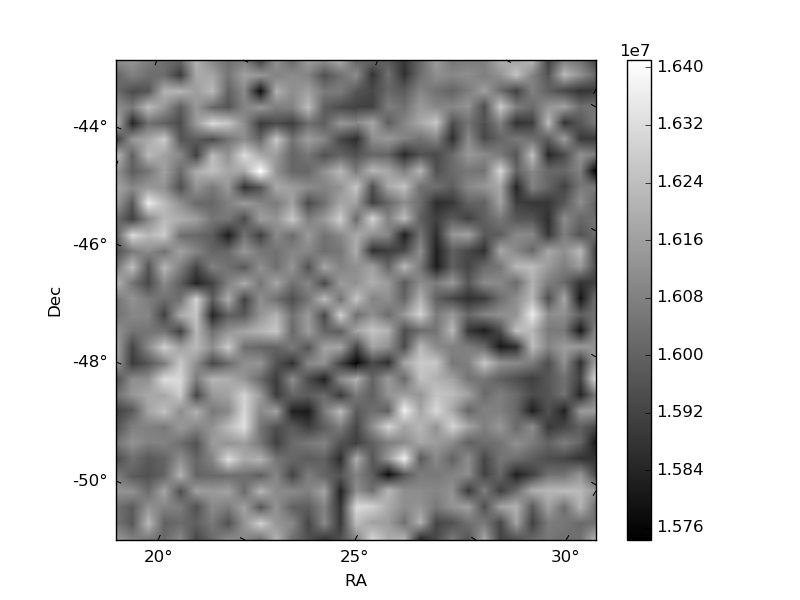
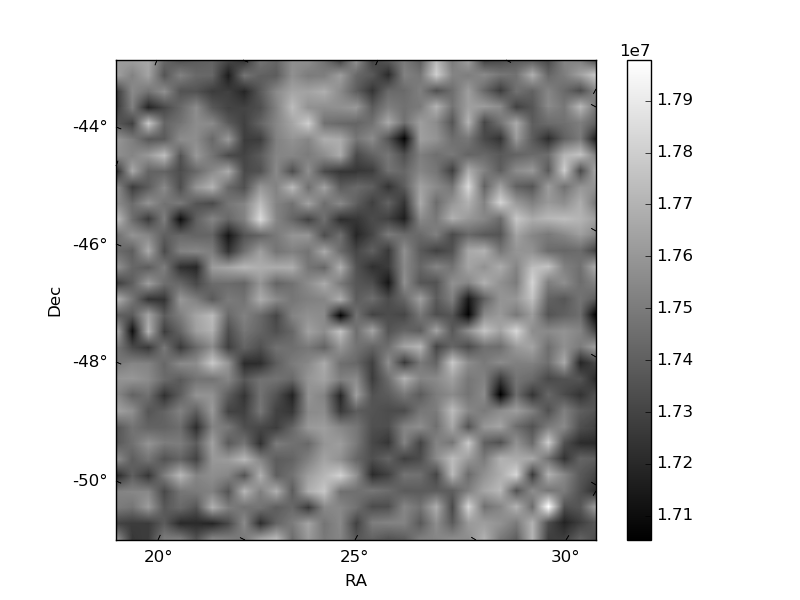
Histogram calculated using DETX and DETY for each event in the final _common_clean file
| Quadrant A | 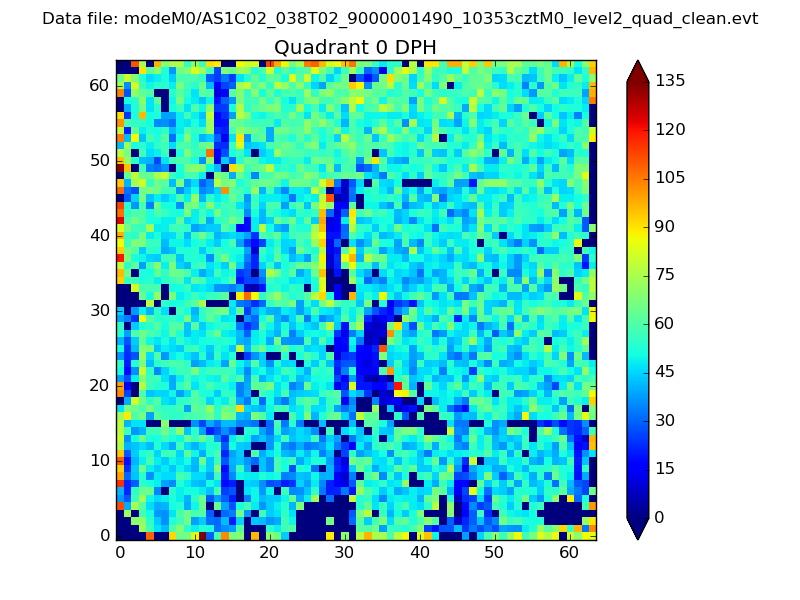 |
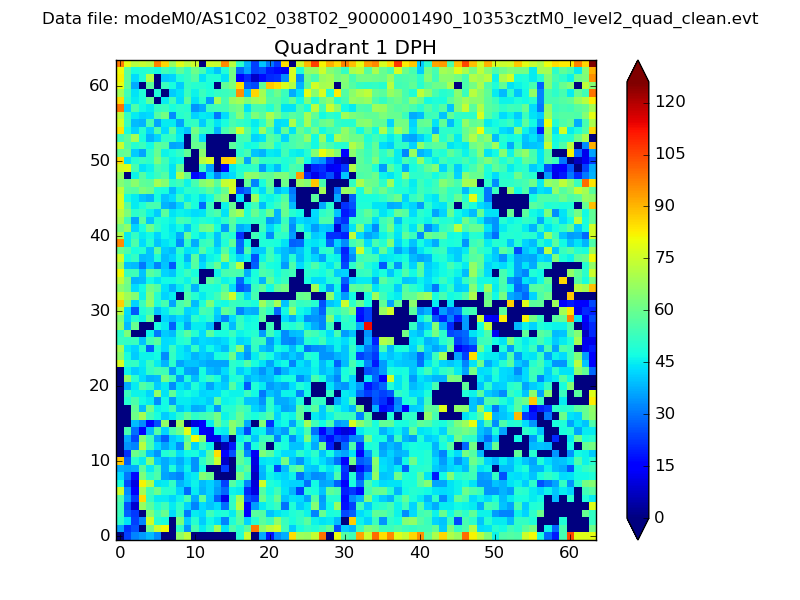 |
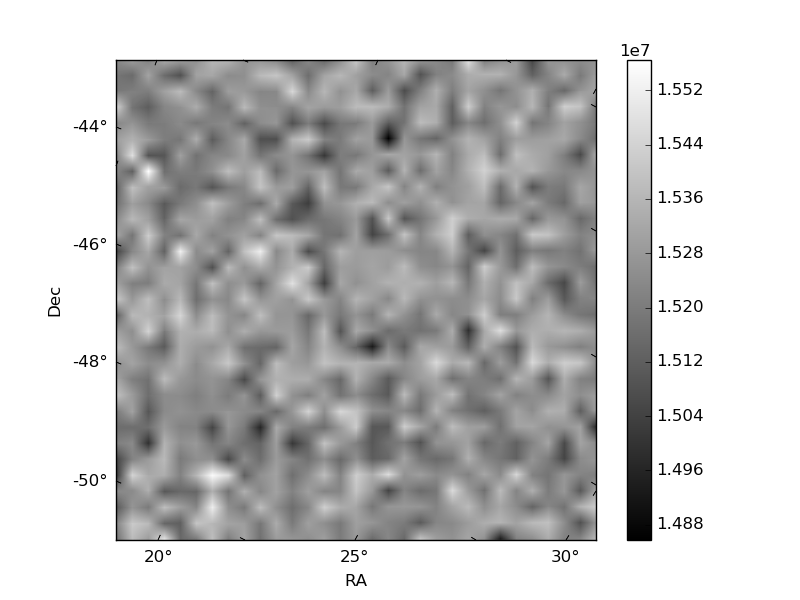
Quadrant B |
|---|---|---|---|
| Quadrant D | 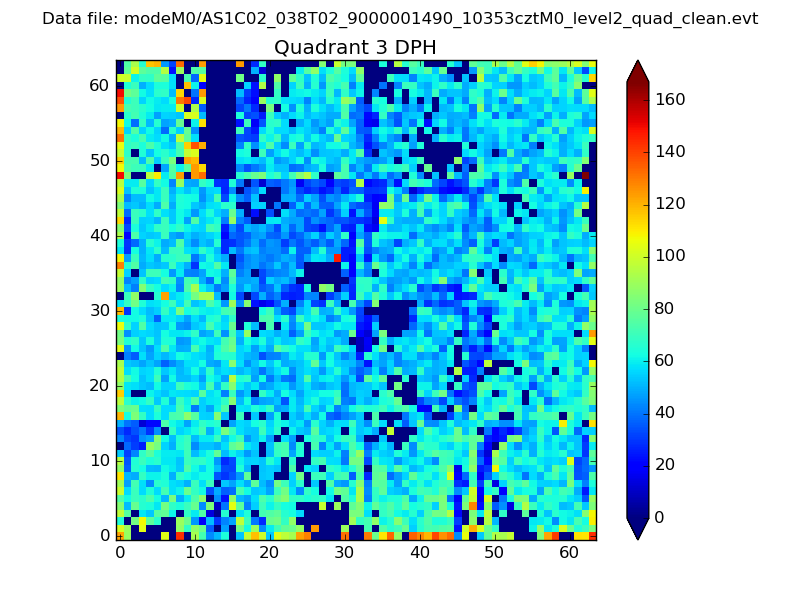 |
 |
Quadrant C |
| Plot type | Count rate plots | Images |
|---|---|---|
| Comparison with Poisson distribution Blue bars denote a histogram of data divided into 1 sec bins. Red curve is a Poisson curve with rate = median count rate of data. |
 |
 |
| Quadrant-wise count rates Data is divided into 100 sec bins |
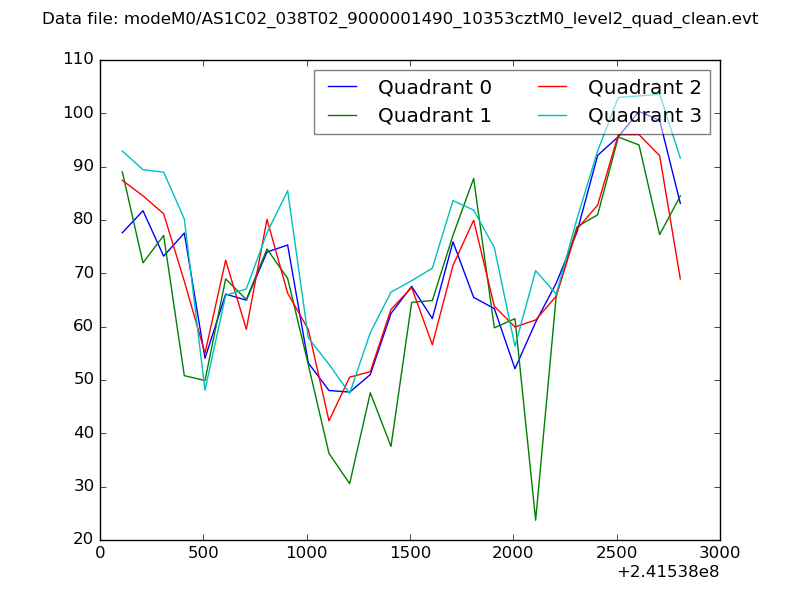 |
|
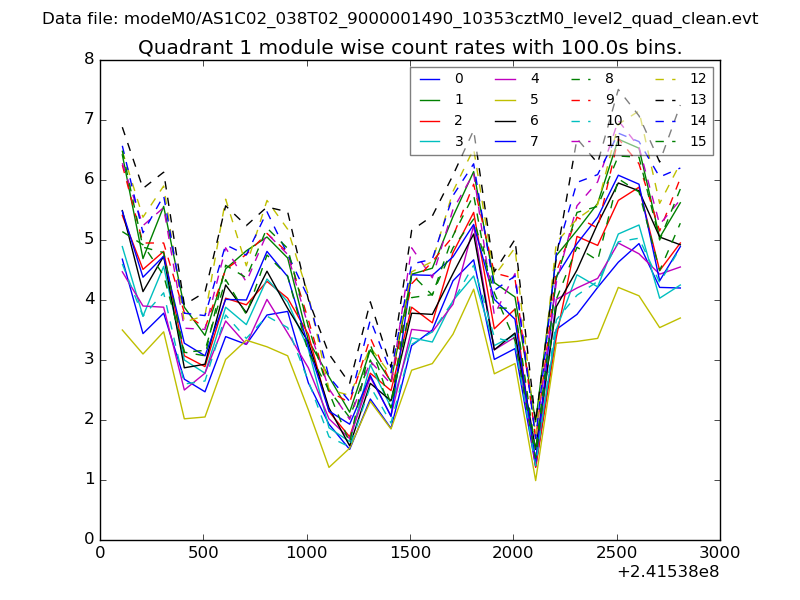
| Module-wise count rates for Quadrant A Data is divided into 100 sec bins |
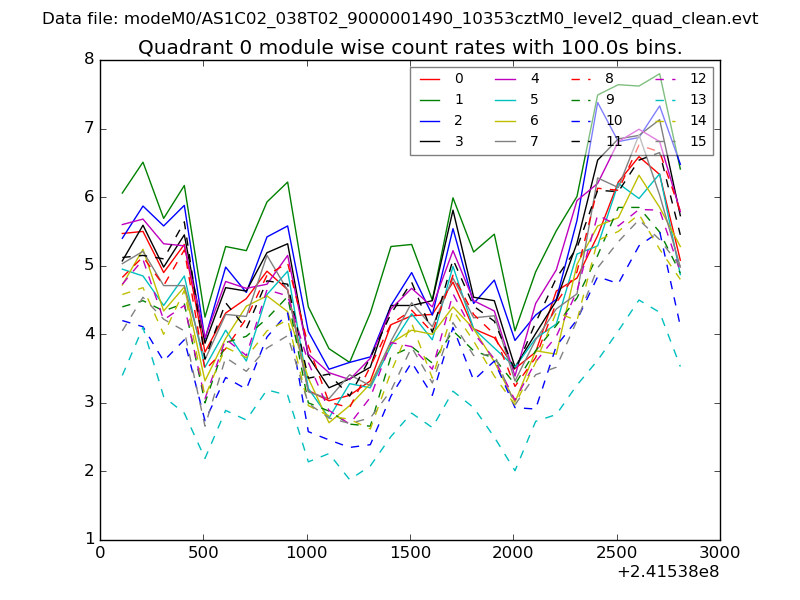 |
 |
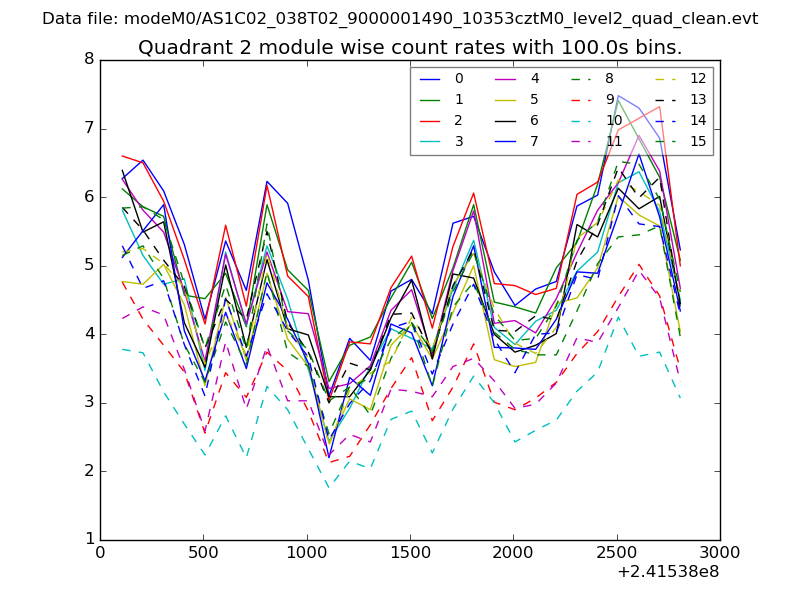
| Module-wise count rates for Quadrant B Data is divided into 100 sec bins |
 |
 |
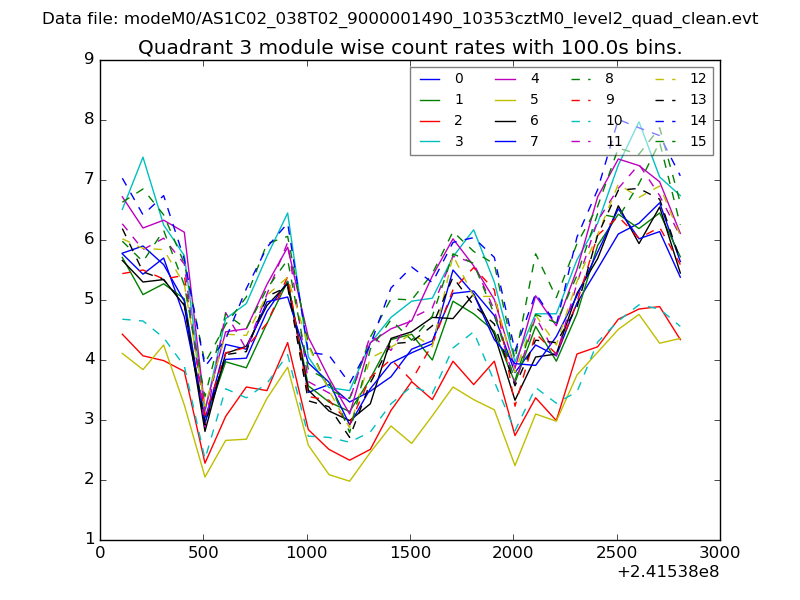
| Module-wise count rates for Quadrant C Data is divided into 100 sec bins |
 |
 |
| Module-wise count rates for Quadrant D Data is divided into 100 sec bins |
 |
 |
| Parameter | Plot |
|---|---|
| CZT HV Monitor | 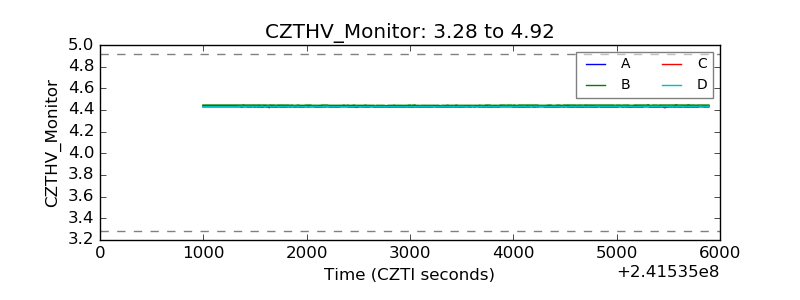 |
| D_VDD | 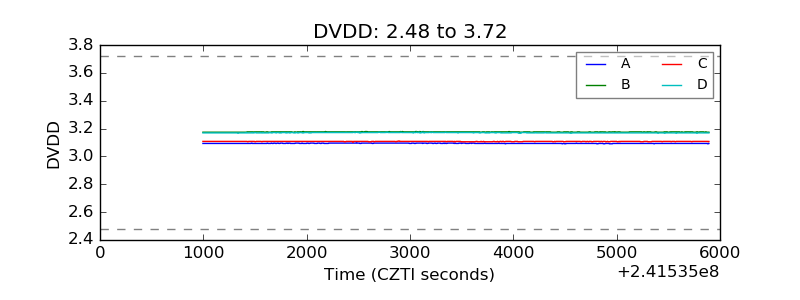 |
| Temperature 1 | 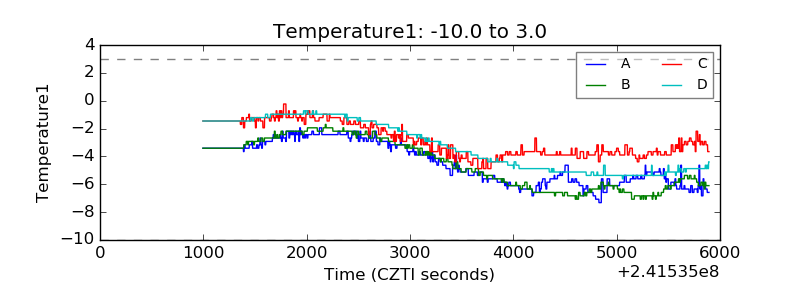 |
| Veto HV Monitor |  |
| Veto LLD | 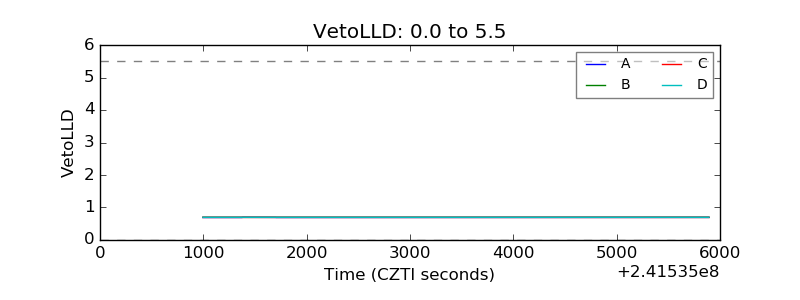 |
| Alpha Counter | 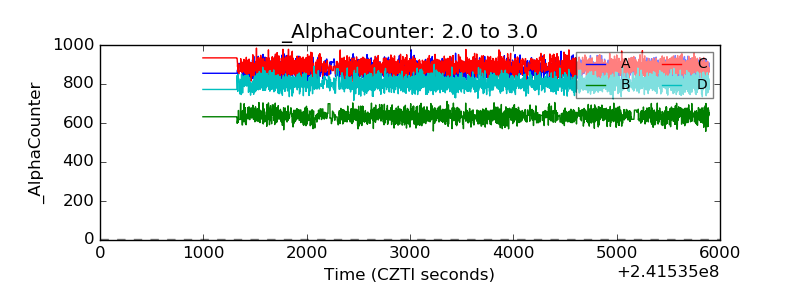 |
| _CPM_Rate | 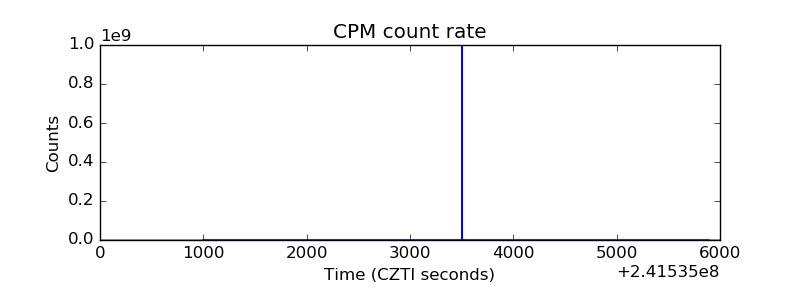 |
| CZT Counter | 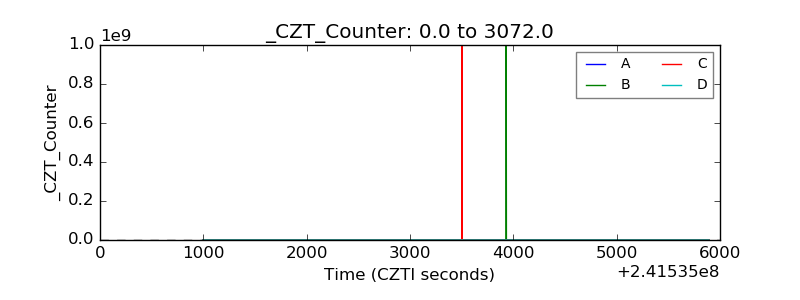 |
| +2.5 Volts monitor |  |
| +5 Volts monitor |  |
| _ROLL_ROT | 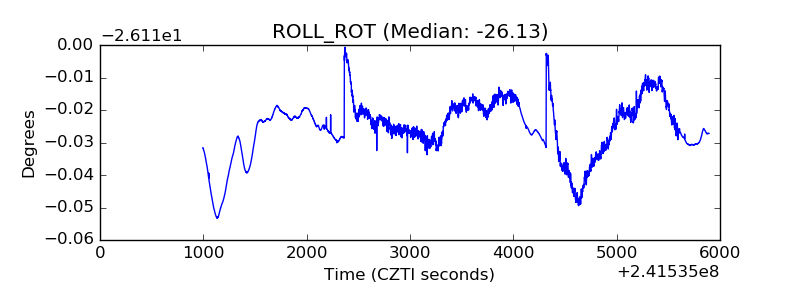 |
| _Roll_DEC |  |
| _Roll_RA | 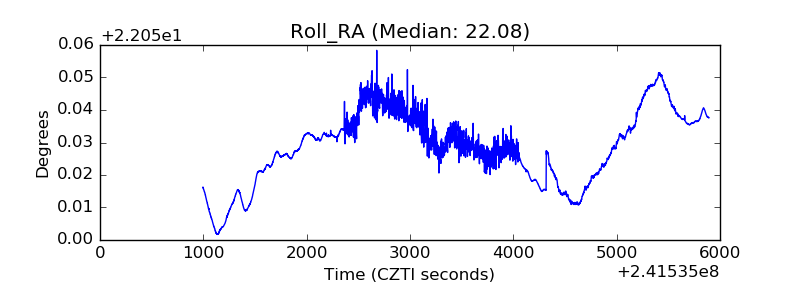 |
| Veto Counter | 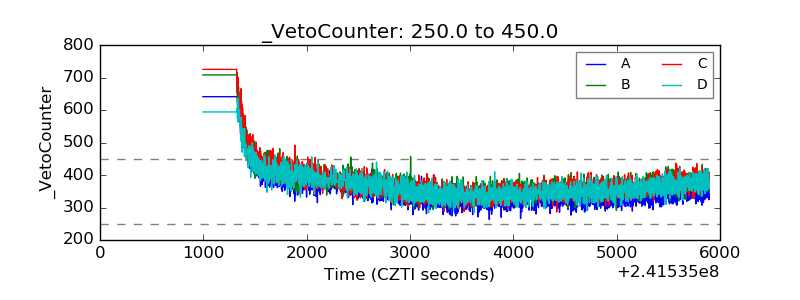 |