| Param | Original file | Final file |
|---|---|---|
| Filename | modeM0/AS1C02_045T02_9000001492_10361cztM0_level2.evt | modeM0/AS1C02_045T02_9000001492_10361cztM0_level2_quad_clean.evt |
| Size (bytes) | 383,402,880 | 93,836,160 |
| Size | 365.6 MB | 89.5 MB |
| Events in quadrant A | 2,579,339 | 593,424 |
| Events in quadrant B | 2,721,606 | 583,231 |
| Events in quadrant C | 2,504,654 | 603,239 |
| Events in quadrant D | 3,401,341 | 648,134 |
| Mode M0 | |||
|---|---|---|---|
| Quadrant | BADHDUFLAG | Total packets | Discarded packets |
| A | 0 | 27640 | 15804 |
| B | 0 | 31246 | 19440 |
| C | 0 | 28392 | 16629 |
| D | 0 | 32613 | 18374 |
| Mode M9 | |||
|---|---|---|---|
| Quadrant | BADHDUFLAG | Total packets | Discarded packets |
| A | 0 | 5 | 2 |
| B | 0 | 6 | 3 |
| C | 0 | 6 | 3 |
| D | 0 | 5 | 2 |
| Mode SS | |||
|---|---|---|---|
| Quadrant | BADHDUFLAG | Total packets | Discarded packets |
| A | 0 | 284 | 157 |
| B | 0 | 284 | 153 |
| C | 0 | 284 | 154 |
| D | 0 | 273 | 142 |
| Quadrant | Total seconds | Saturated seconds | Saturation percentage |
|---|---|---|---|
| A | 5789 | 48 | 0.829159% |
| B | 5584 | 74 | 1.325215% |
| C | 5805 | 17 | 0.292851% |
| D | 6480 | 57 | 0.879630% |
Noise dominated data is calculated using 1-second bins in cleaned event files. If a bin has >2000 counts, and if more than 50% of those come from <1% of pixels, then it is considered to be noise-dominated and hence unusable.
| Quadrant | # 1 sec bins | Bins with >0 counts | Bins with >2000 counts | High rate bins dominated by noise | Noise dominated (total time) | Noise dominated (detector-on time) | Marked lightcurve |
|---|---|---|---|---|---|---|---|
| A | 7241 | 6773 | 1 | 1 | 0.01% | 0.01% | 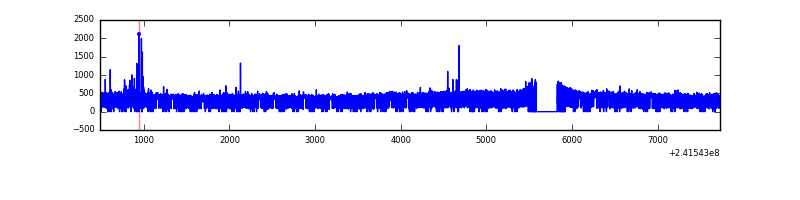 |
| B | 7241 | 6611 | 0 | 0 | 0.00% | 0.00% | 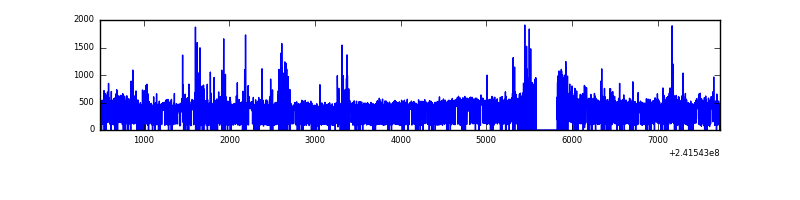 |
| C | 7241 | 6771 | 0 | 0 | 0.00% | 0.00% |  |
| D | 7241 | 6750 | 10 | 10 | 0.14% | 0.15% | 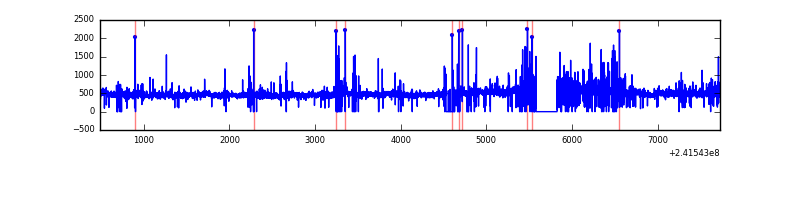 |
Top three noisy pixels from each quadrant. If the there are fewer than three noisy pixels in the level2.evt file, extra rows are filled as -1
| Pixel properties | Quadrant properties | ||||||
|---|---|---|---|---|---|---|---|
| Quadrant | DetID | PixID | Counts | Sigma | Mean | Median | Sigma |
| A | 15 | 174 | 33212 | 243.98 | 653 | 638 | 133.5 |
| A | 8 | 5 | 9153 | 63.78 | 653 | 638 | 133.5 |
| A | 13 | 251 | 8143 | 56.21 | 653 | 638 | 133.5 |
| B | 4 | 239 | 136511 | 1123.09 | 631 | 616 | 121.0 |
| B | 11 | 51 | 71489 | 585.72 | 631 | 616 | 121.0 |
| B | 3 | 208 | 18979 | 151.76 | 631 | 616 | 121.0 |
| C | 13 | 61 | 4738 | 27.53 | 640 | 644 | 148.7 |
| C | 14 | 67 | 3856 | 21.6 | 640 | 644 | 148.7 |
| C | 14 | 234 | 3529 | 19.4 | 640 | 644 | 148.7 |
| D | 8 | 195 | 380789 | 2270.58 | 703 | 683 | 167.4 |
| D | 1 | 20 | 116639 | 692.67 | 703 | 683 | 167.4 |
| D | 1 | 52 | 55250 | 325.96 | 703 | 683 | 167.4 |
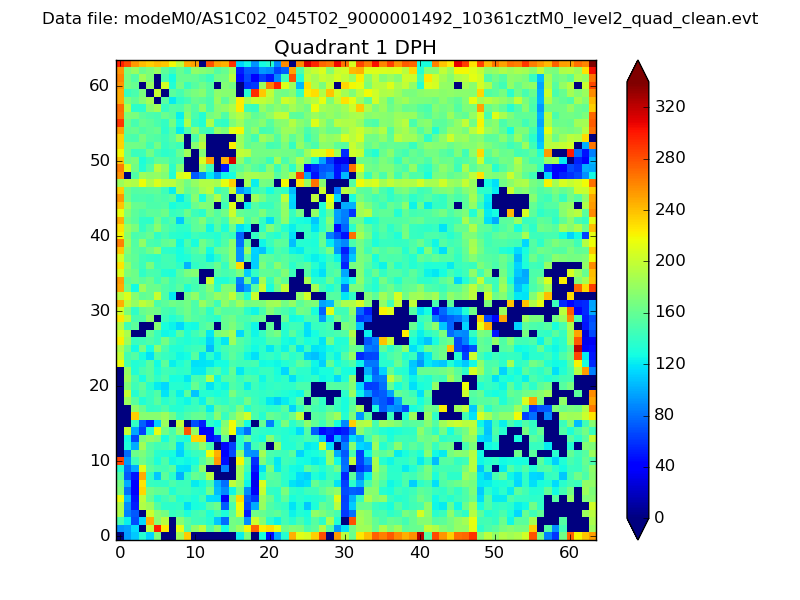
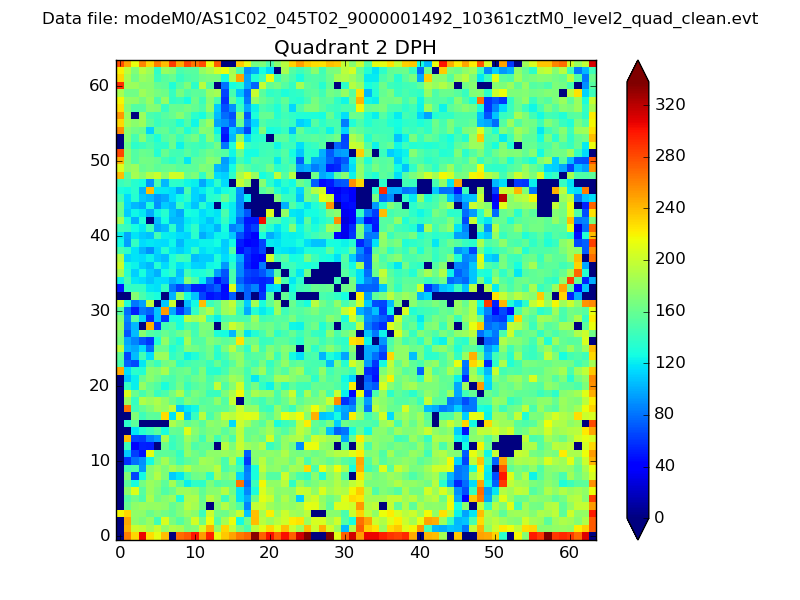
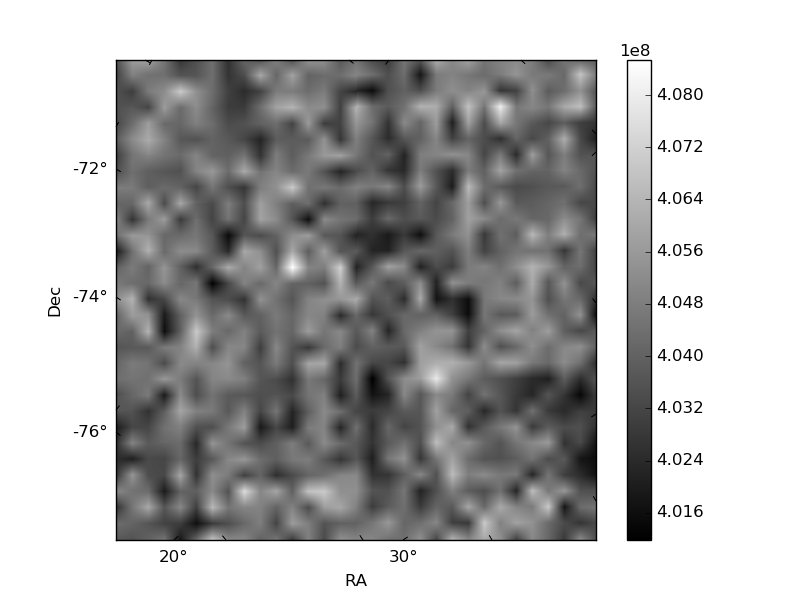
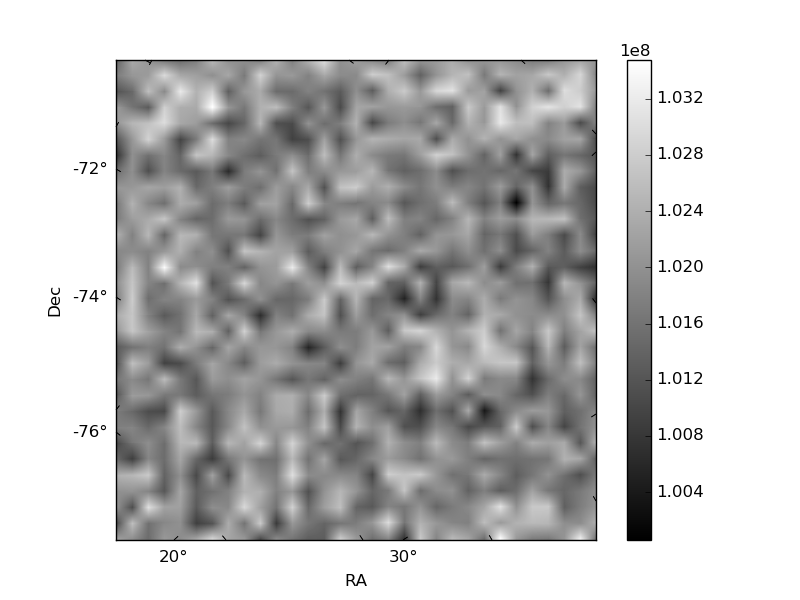
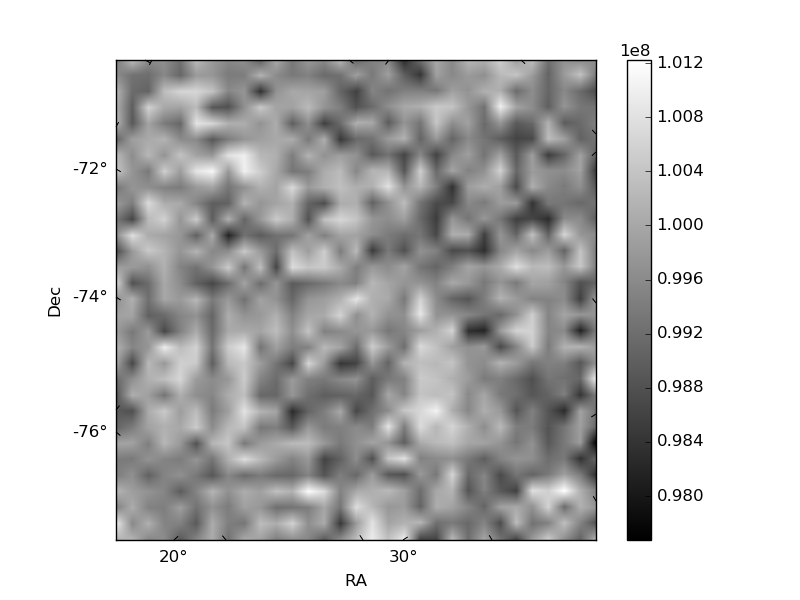
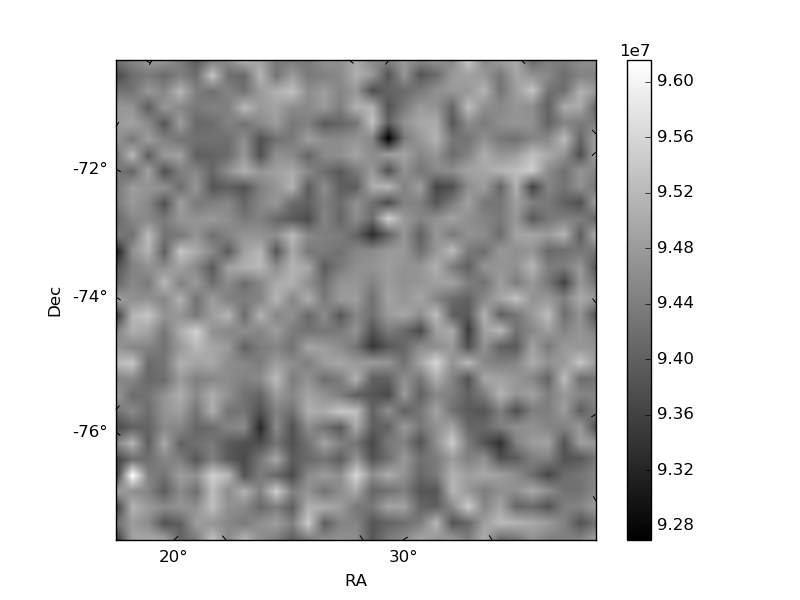
Histogram calculated using DETX and DETY for each event in the final _common_clean file
| Quadrant A | 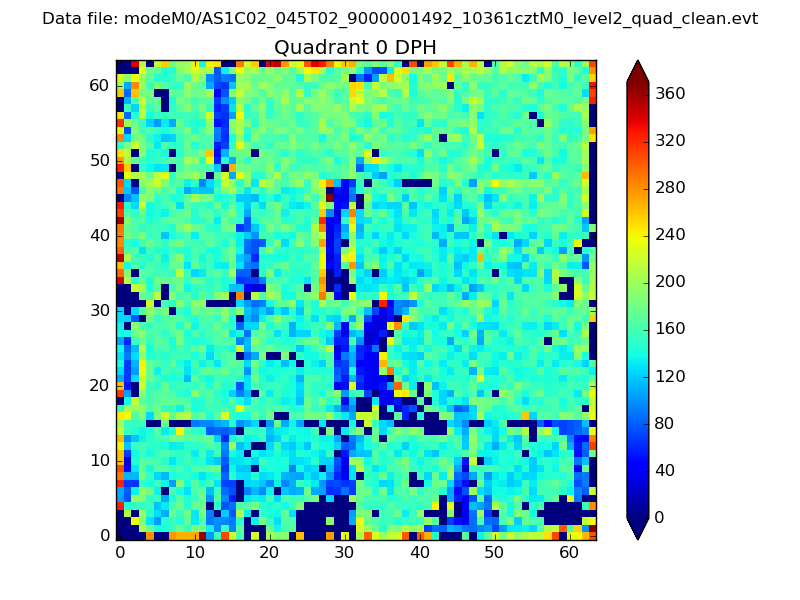 |
 |
Quadrant B |
|---|---|---|---|
| Quadrant D | 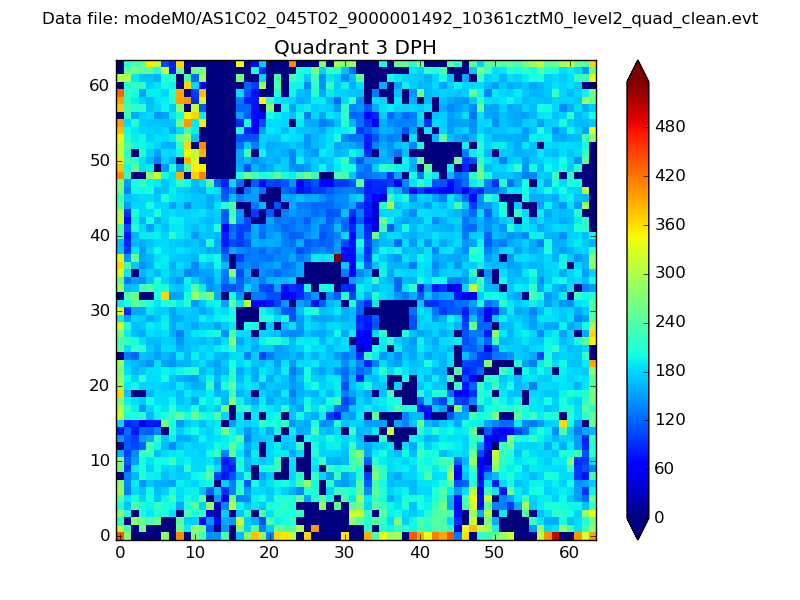 |
 |
Quadrant C |
| Plot type | Count rate plots | Images |
|---|---|---|
| Comparison with Poisson distribution Blue bars denote a histogram of data divided into 1 sec bins. Red curve is a Poisson curve with rate = median count rate of data. |
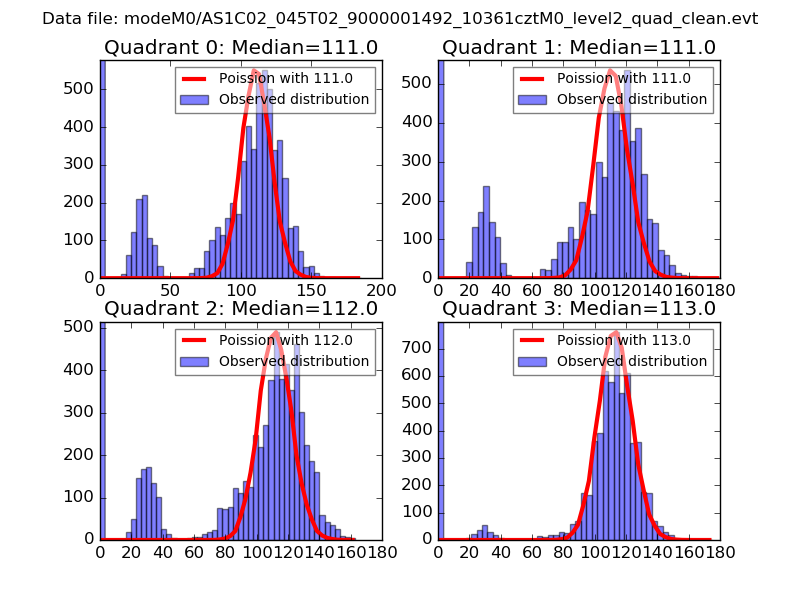 |
 |
| Quadrant-wise count rates Data is divided into 100 sec bins |
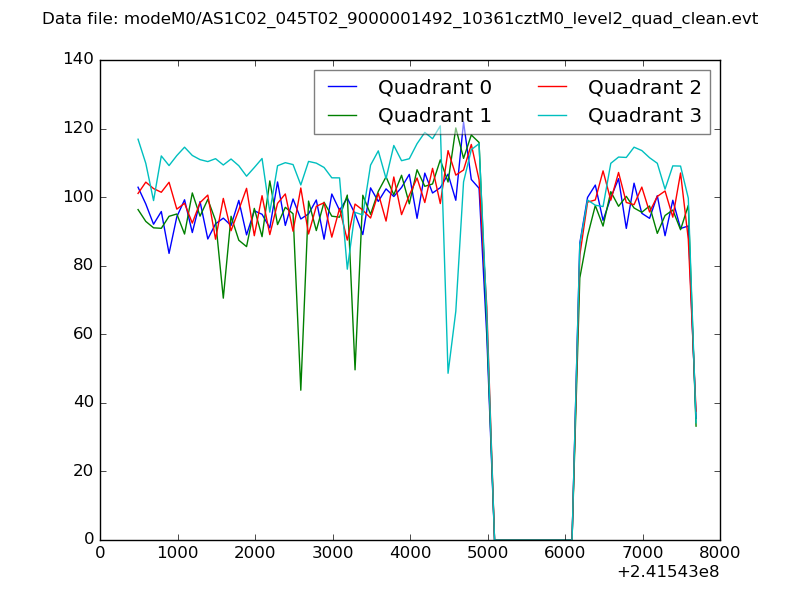 |
|
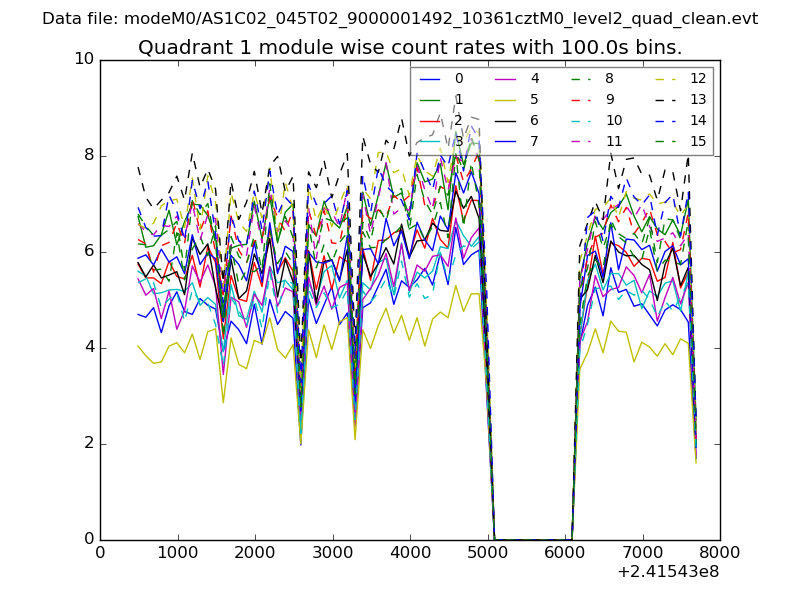
| Module-wise count rates for Quadrant A Data is divided into 100 sec bins |
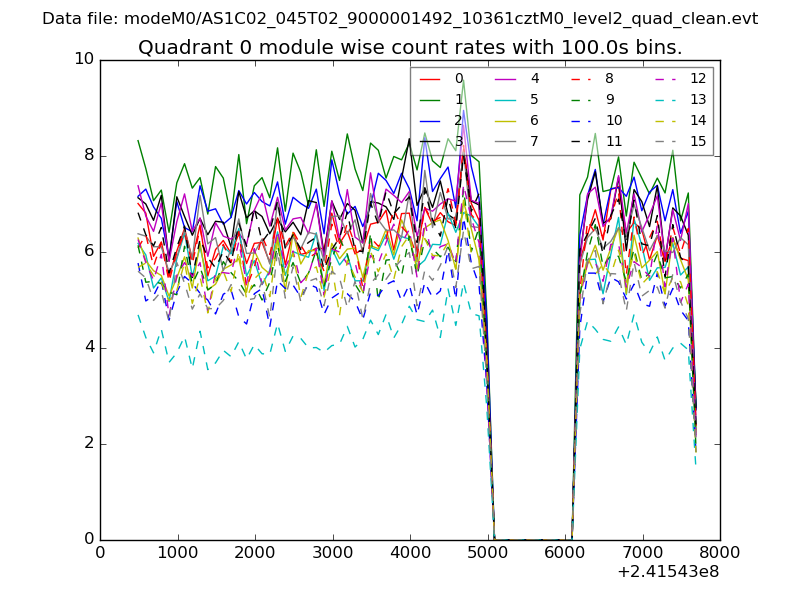 |
 |
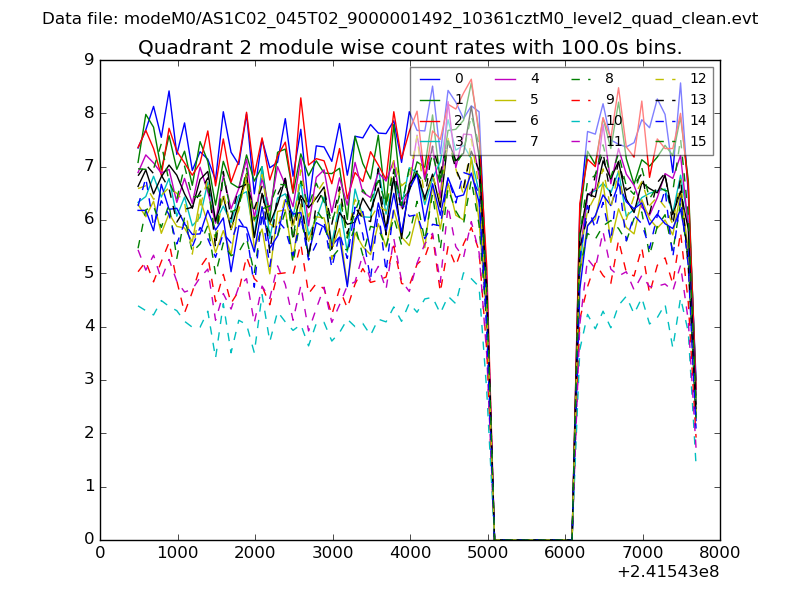
| Module-wise count rates for Quadrant B Data is divided into 100 sec bins |
 |
 |
| Module-wise count rates for Quadrant C Data is divided into 100 sec bins |
 |
 |
| Module-wise count rates for Quadrant D Data is divided into 100 sec bins |
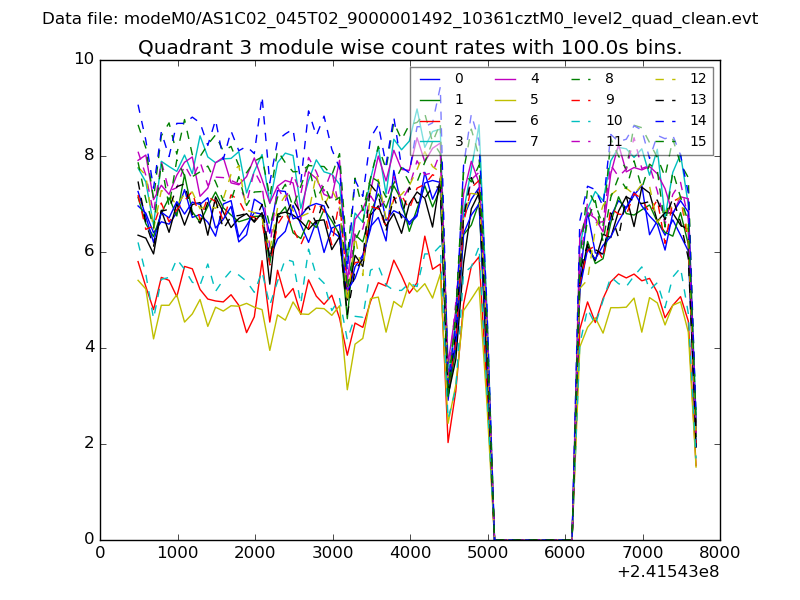 |
 |
| Parameter | Plot |
|---|---|
| CZT HV Monitor | 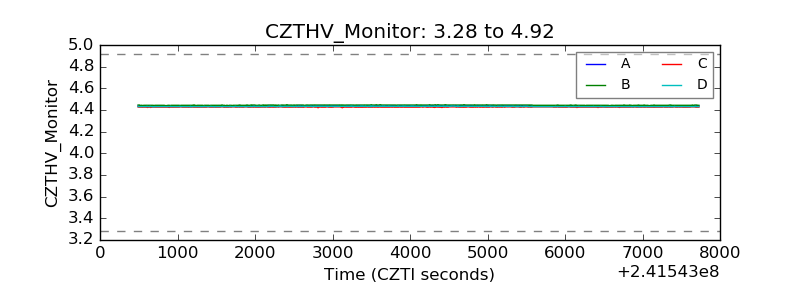 |
| D_VDD | 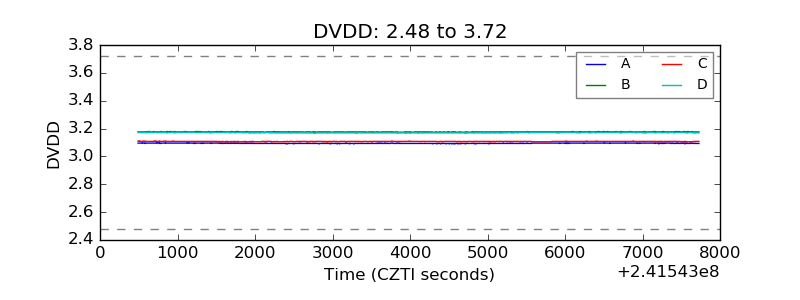 |
| Temperature 1 | 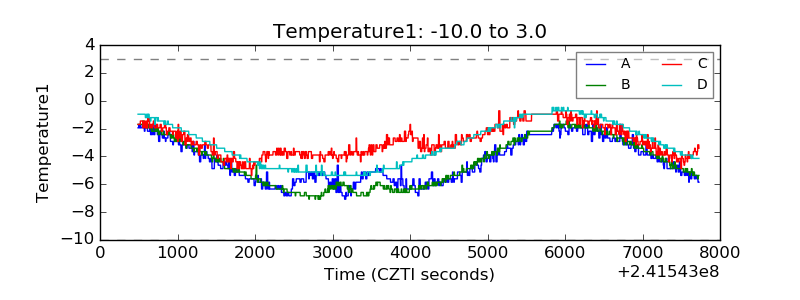 |
| Veto HV Monitor |  |
| Veto LLD | 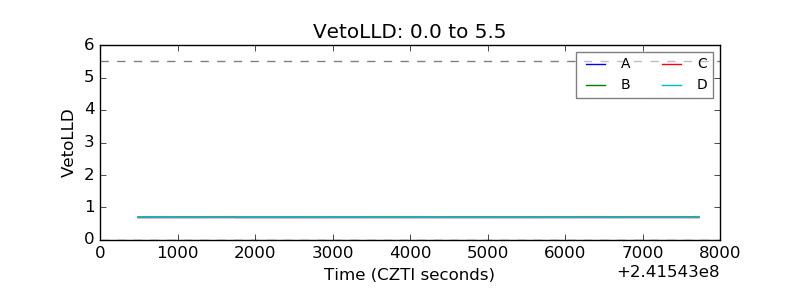 |
| Alpha Counter | 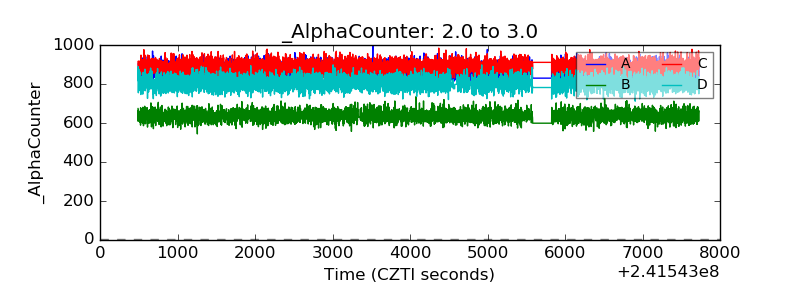 |
| _CPM_Rate | 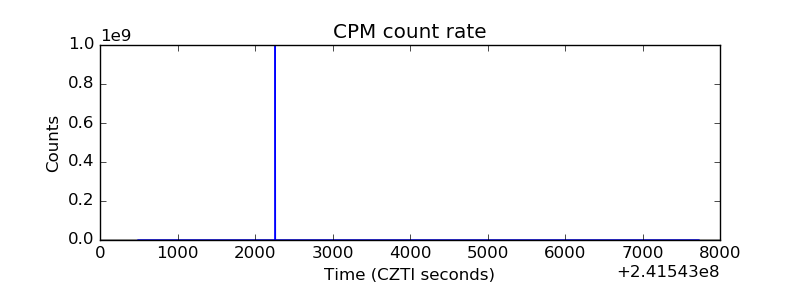 |
| CZT Counter | 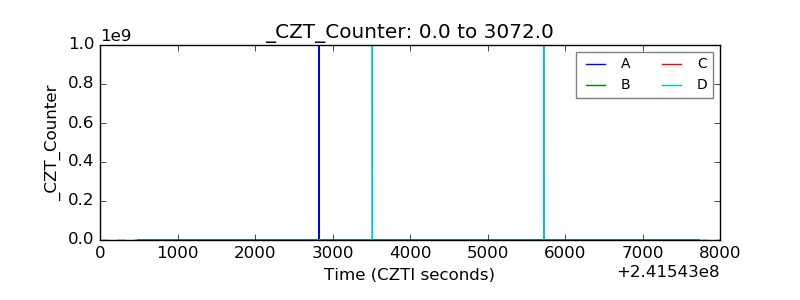 |
| +2.5 Volts monitor |  |
| +5 Volts monitor |  |
| _ROLL_ROT | 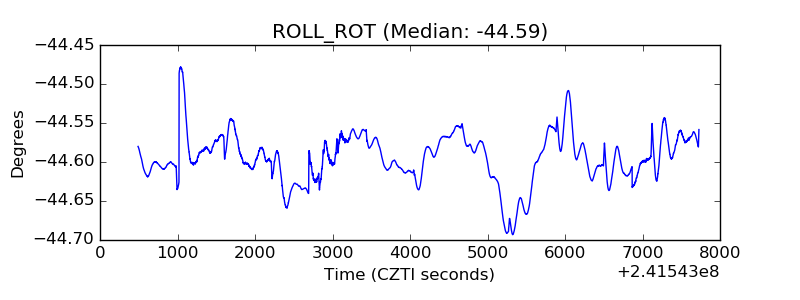 |
| _Roll_DEC | 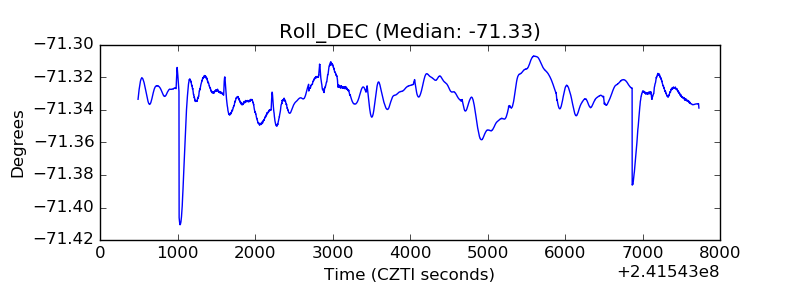 |
| _Roll_RA | 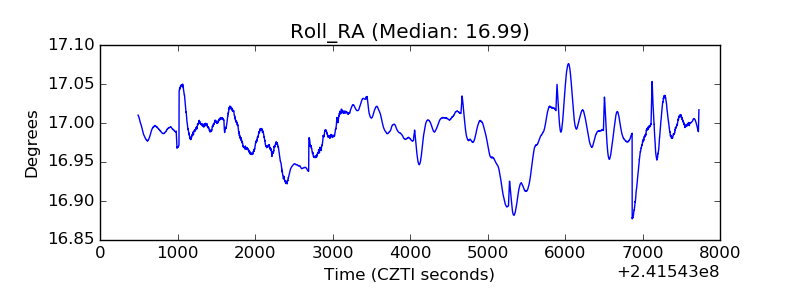 |
| Veto Counter | 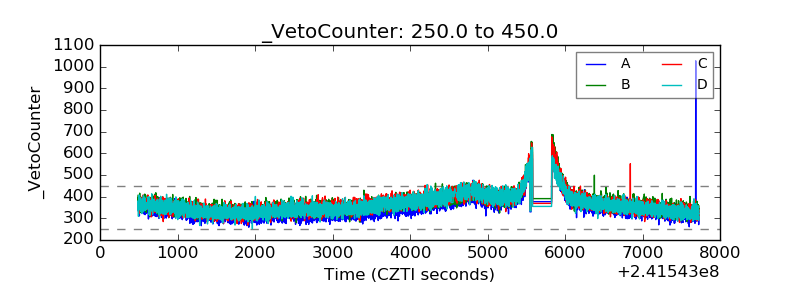 |