| Param | Original file | Final file |
|---|---|---|
| Filename | modeM0/AS1G07_048T01_9000001494_10361cztM0_level2.evt | modeM0/AS1G07_048T01_9000001494_10361cztM0_level2_quad_clean.evt |
| Size (bytes) | 1,744,580,160 | 304,479,360 |
| Size | 1.6 GB | 290.4 MB |
| Events in quadrant A | 11,378,893 | 1,919,895 |
| Events in quadrant B | 11,912,893 | 1,809,169 |
| Events in quadrant C | 11,287,521 | 1,910,145 |
| Events in quadrant D | 16,532,383 | 1,834,437 |
| Mode M0 | |||
|---|---|---|---|
| Quadrant | BADHDUFLAG | Total packets | Discarded packets |
| A | 0 | 143108 | 91650 |
| B | 0 | 167403 | 115547 |
| C | 0 | 149885 | 98350 |
| D | 0 | 207589 | 140915 |
| Mode M9 | |||
|---|---|---|---|
| Quadrant | BADHDUFLAG | Total packets | Discarded packets |
| A | 0 | 119 | 68 |
| B | 0 | 136 | 84 |
| C | 0 | 136 | 84 |
| D | 0 | 118 | 66 |
| Mode SS | |||
|---|---|---|---|
| Quadrant | BADHDUFLAG | Total packets | Discarded packets |
| A | 0 | 1492 | 922 |
| B | 0 | 1492 | 920 |
| C | 0 | 1492 | 920 |
| D | 0 | 1425 | 856 |
| Quadrant | Total seconds | Saturated seconds | Saturation percentage |
|---|---|---|---|
| A | 25334 | 95 | 0.374990% |
| B | 24167 | 150 | 0.620681% |
| C | 25437 | 64 | 0.251602% |
| D | 26409 | 230 | 0.870915% |
Noise dominated data is calculated using 1-second bins in cleaned event files. If a bin has >2000 counts, and if more than 50% of those come from <1% of pixels, then it is considered to be noise-dominated and hence unusable.
| Quadrant | # 1 sec bins | Bins with >0 counts | Bins with >2000 counts | High rate bins dominated by noise | Noise dominated (total time) | Noise dominated (detector-on time) | Marked lightcurve |
|---|---|---|---|---|---|---|---|
| A | 35606 | 29646 | 0 | 0 | 0.00% | 0.00% | 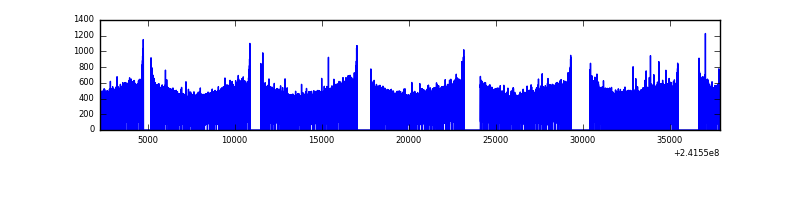 |
| B | 35605 | 28706 | 1 | 1 | 0.00% | 0.00% | 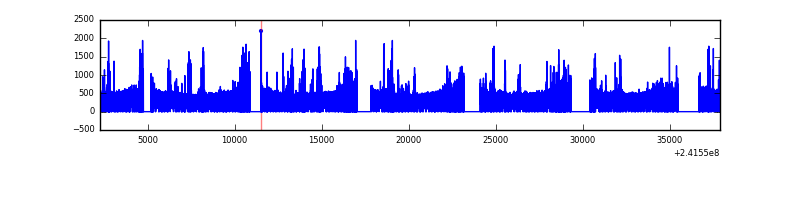 |
| C | 35606 | 29627 | 0 | 0 | 0.00% | 0.00% | 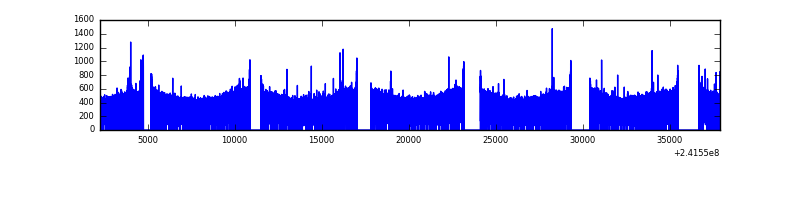 |
| D | 35605 | 28840 | 59 | 59 | 0.17% | 0.20% | 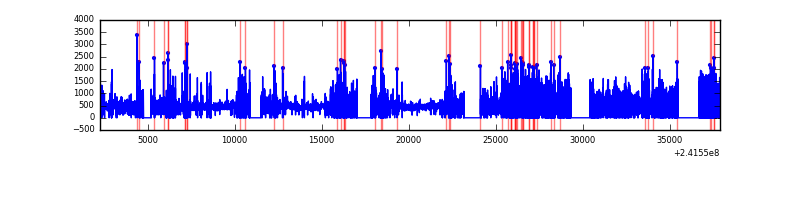 |
Top three noisy pixels from each quadrant. If the there are fewer than three noisy pixels in the level2.evt file, extra rows are filled as -1
| Pixel properties | Quadrant properties | ||||||
|---|---|---|---|---|---|---|---|
| Quadrant | DetID | PixID | Counts | Sigma | Mean | Median | Sigma |
| A | 0 | 226 | 26831 | 40.3 | 2947 | 2886 | 594.2 |
| A | 12 | 194 | 24218 | 35.9 | 2947 | 2886 | 594.2 |
| A | 13 | 253 | 14109 | 18.89 | 2947 | 2886 | 594.2 |
| B | 4 | 239 | 513350 | 965.18 | 2814 | 2747 | 529.0 |
| B | 0 | 214 | 173324 | 322.44 | 2814 | 2747 | 529.0 |
| B | 11 | 51 | 137286 | 254.32 | 2814 | 2747 | 529.0 |
| C | 14 | 234 | 34012 | 46.59 | 2881 | 2901 | 667.7 |
| C | 13 | 61 | 21481 | 27.83 | 2881 | 2901 | 667.7 |
| C | 14 | 67 | 11956 | 13.56 | 2881 | 2901 | 667.7 |
| D | 8 | 195 | 1819870 | 2610.88 | 2934 | 2857 | 695.9 |
| D | 1 | 20 | 1389387 | 1992.32 | 2934 | 2857 | 695.9 |
| D | 1 | 52 | 1157499 | 1659.11 | 2934 | 2857 | 695.9 |
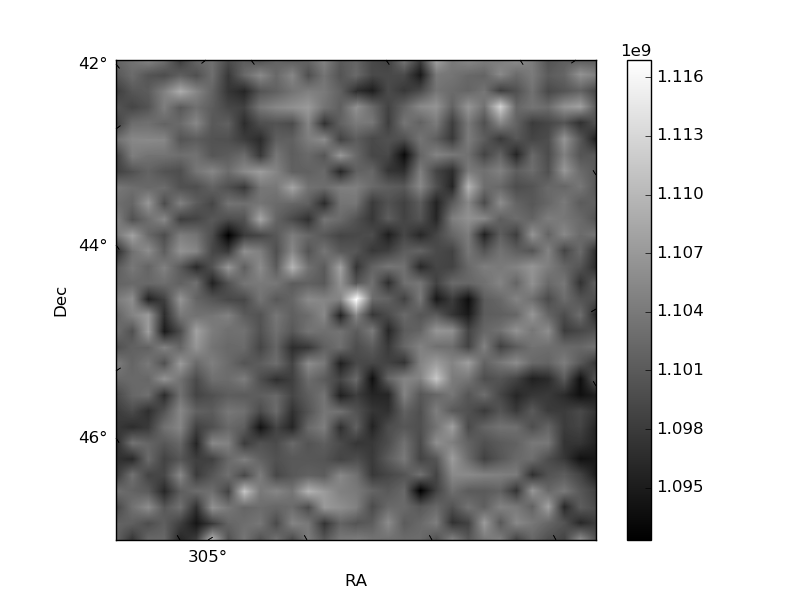
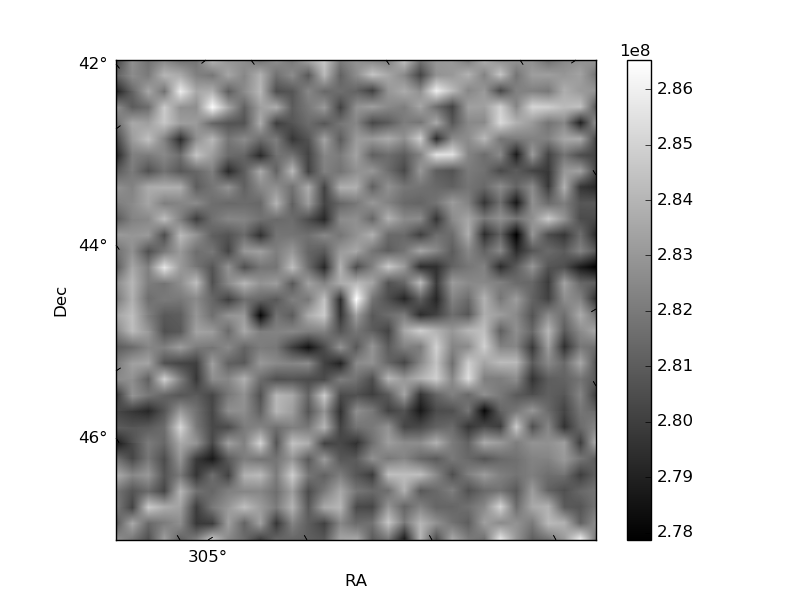
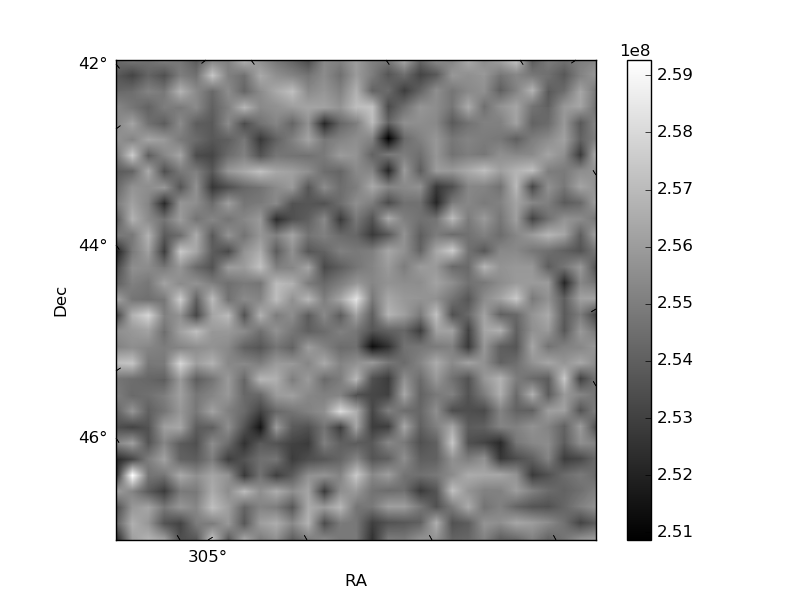
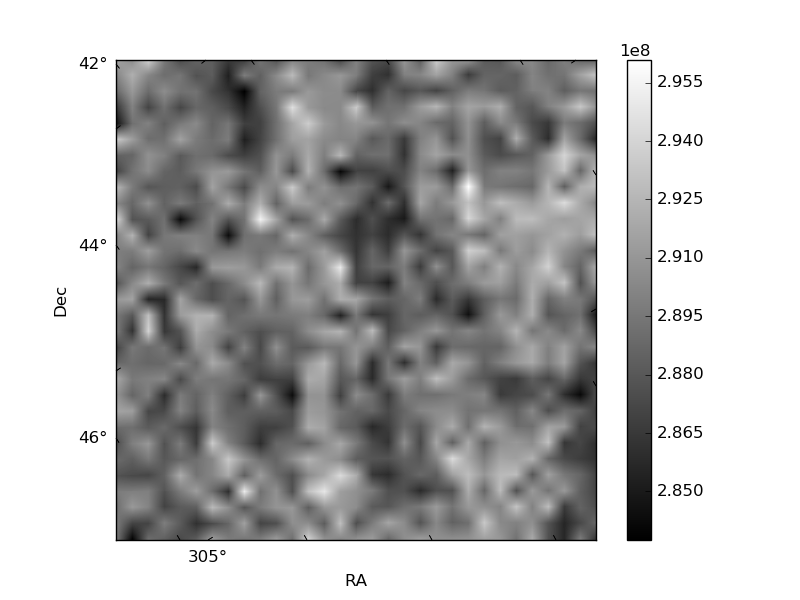
Histogram calculated using DETX and DETY for each event in the final _common_clean file
| Quadrant A | 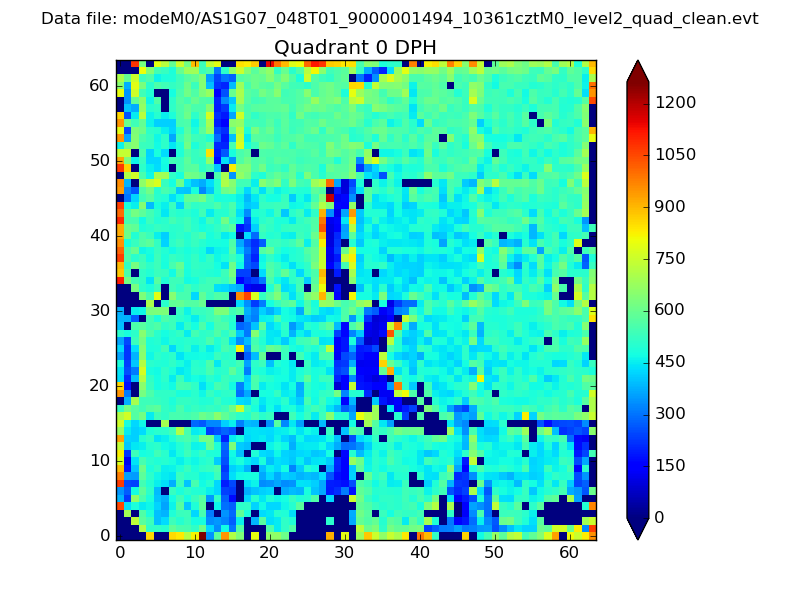 |
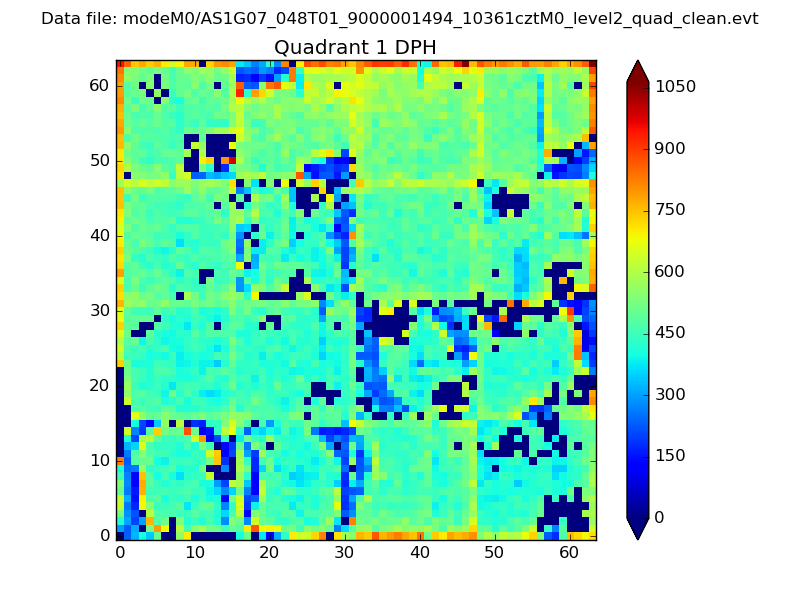 |
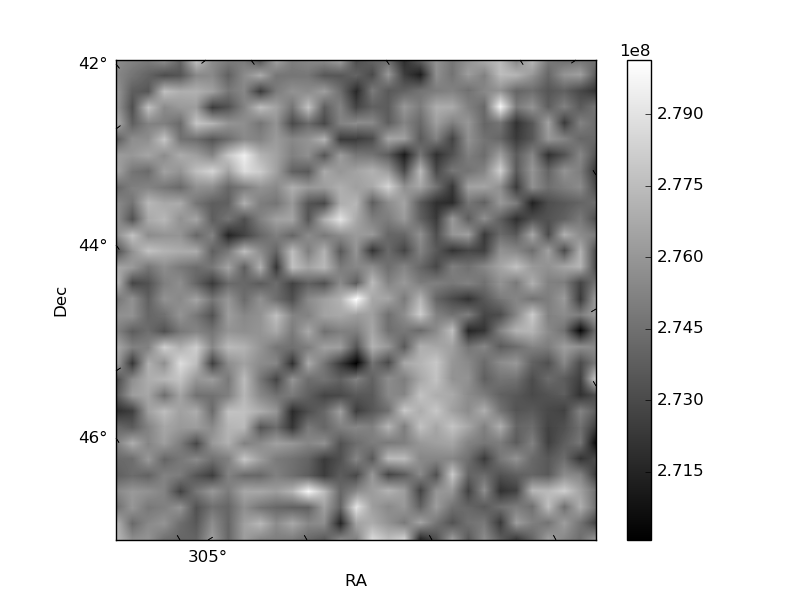
Quadrant B |
|---|---|---|---|
| Quadrant D | 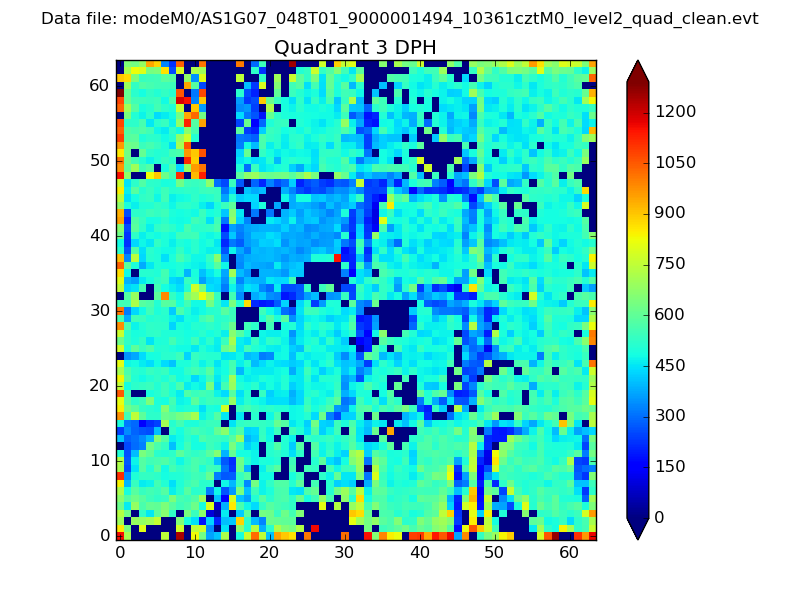 |
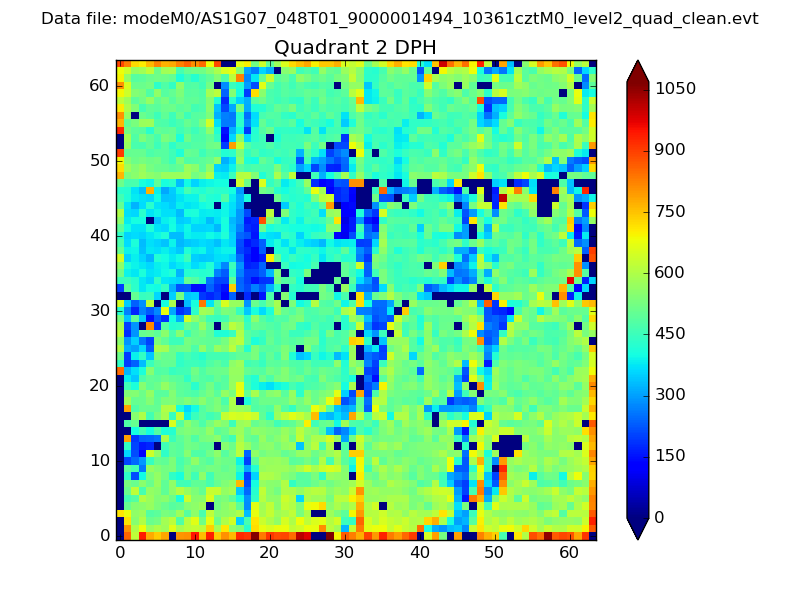 |
Quadrant C |
| Plot type | Count rate plots | Images |
|---|---|---|
| Comparison with Poisson distribution Blue bars denote a histogram of data divided into 1 sec bins. Red curve is a Poisson curve with rate = median count rate of data. |
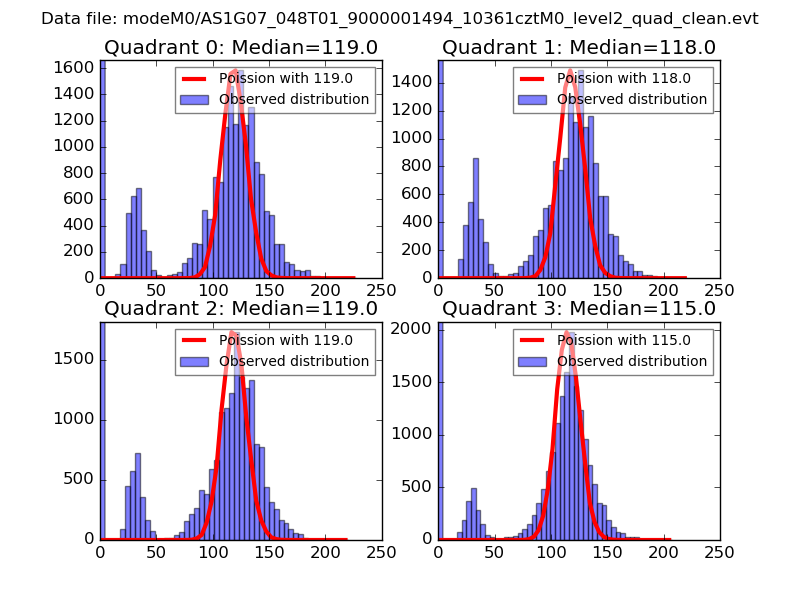 |
 |
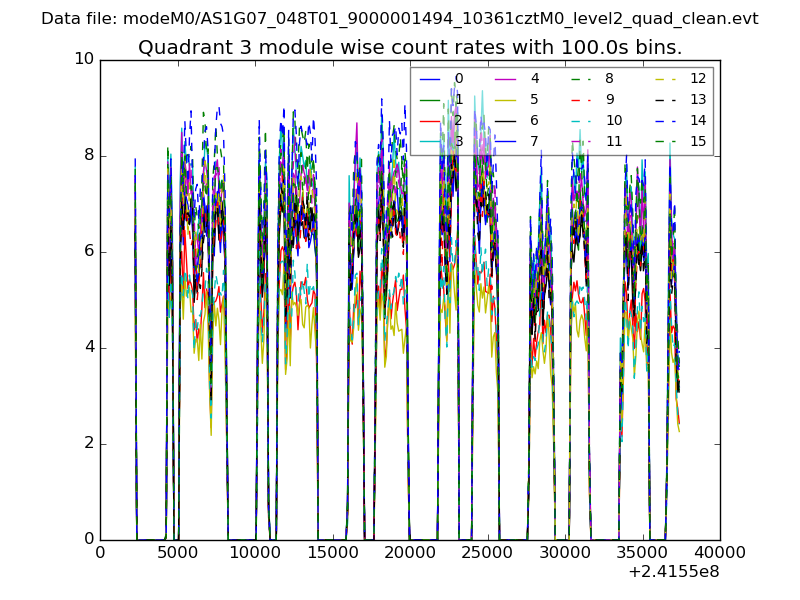
| Quadrant-wise count rates Data is divided into 100 sec bins |
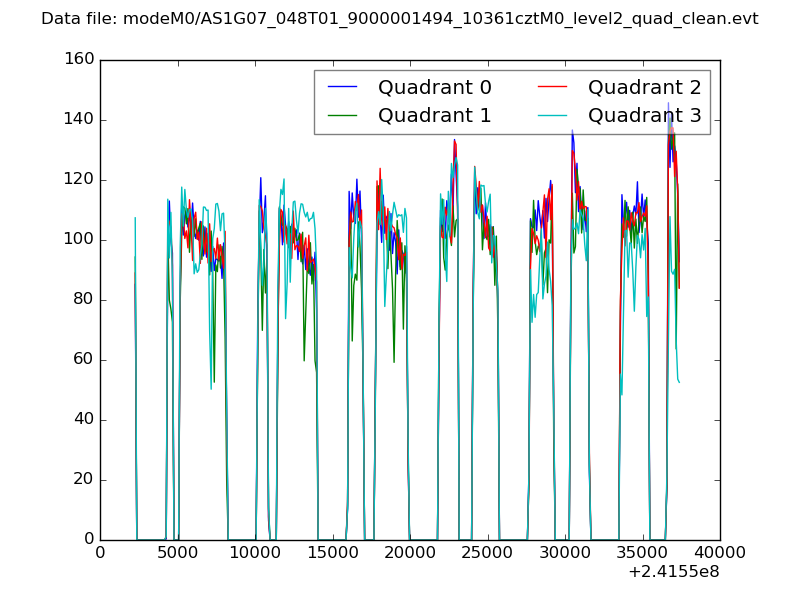 |
|
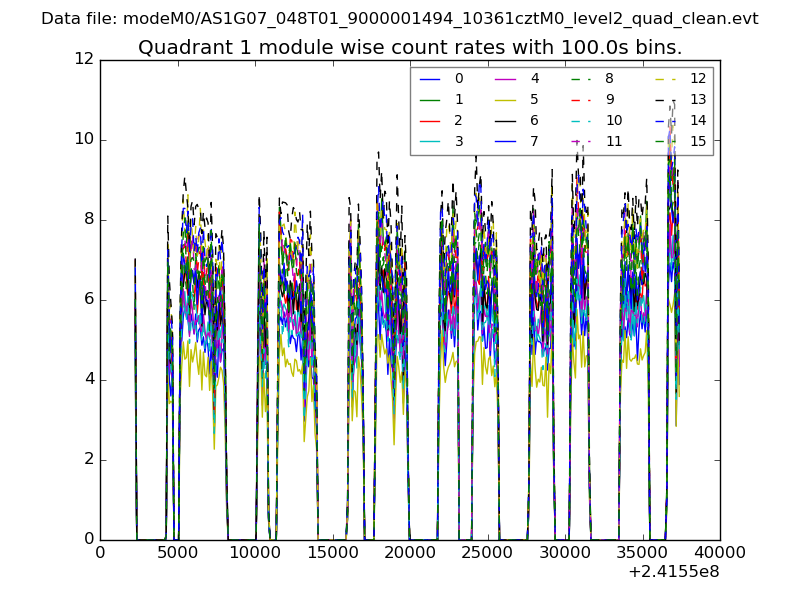
| Module-wise count rates for Quadrant A Data is divided into 100 sec bins |
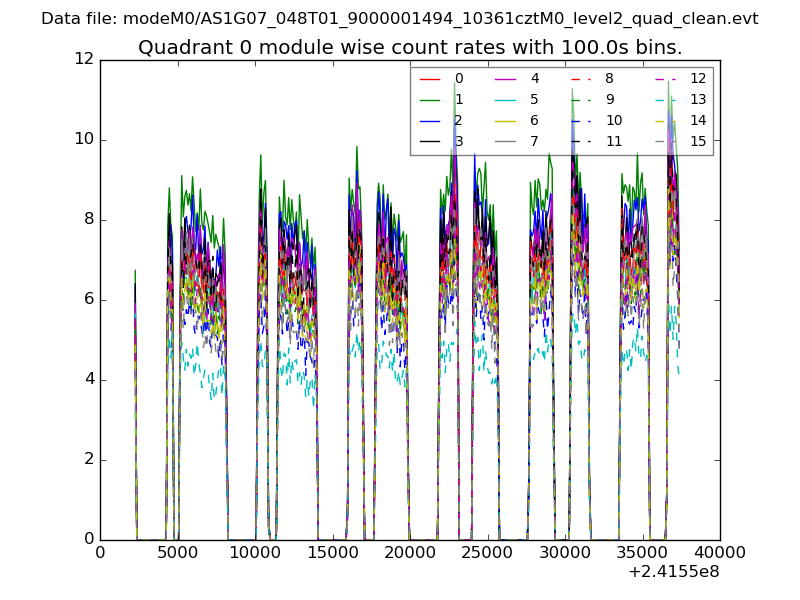 |
 |
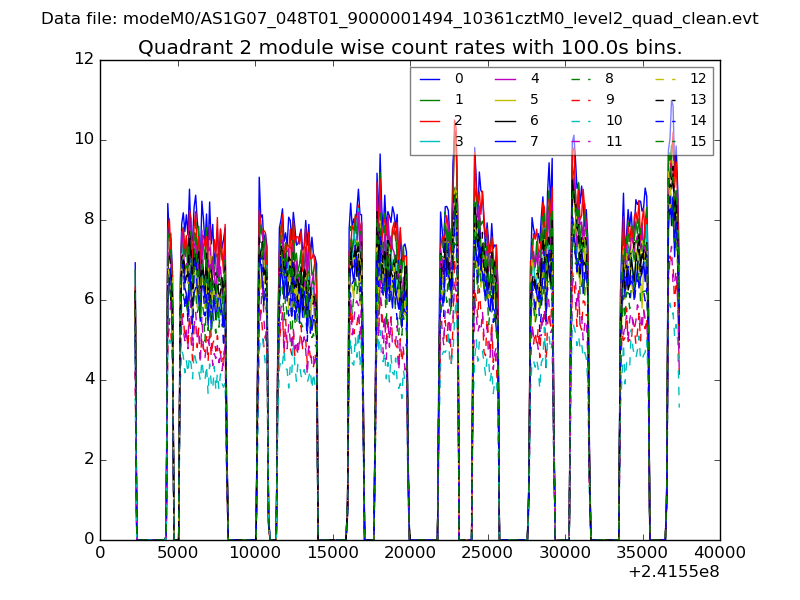
| Module-wise count rates for Quadrant B Data is divided into 100 sec bins |
 |
 |
| Module-wise count rates for Quadrant C Data is divided into 100 sec bins |
 |
 |
| Module-wise count rates for Quadrant D Data is divided into 100 sec bins |
 |
 |
| Parameter | Plot |
|---|---|
| CZT HV Monitor | 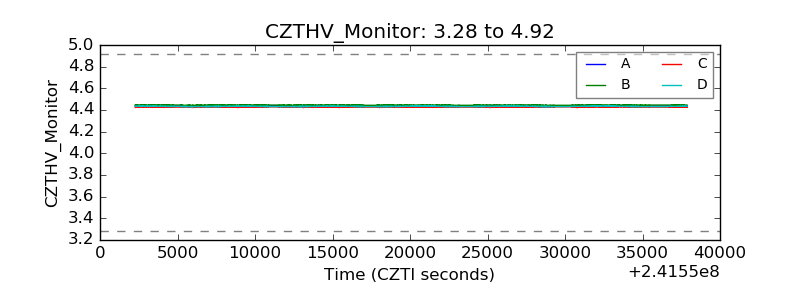 |
| D_VDD | 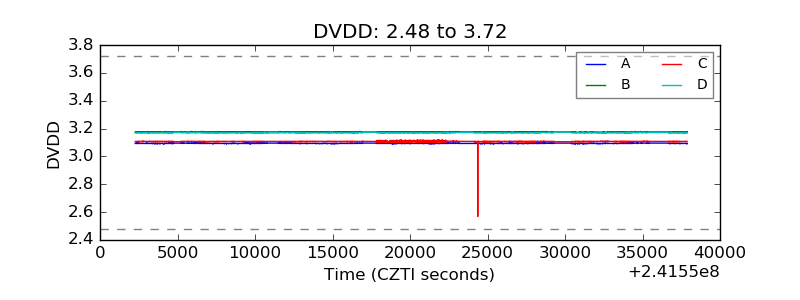 |
| Temperature 1 | 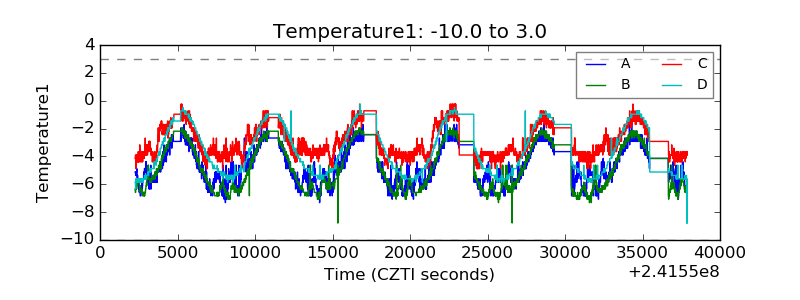 |
| Veto HV Monitor | 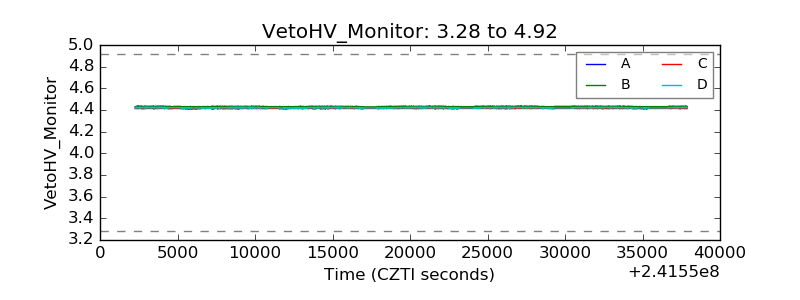 |
| Veto LLD | 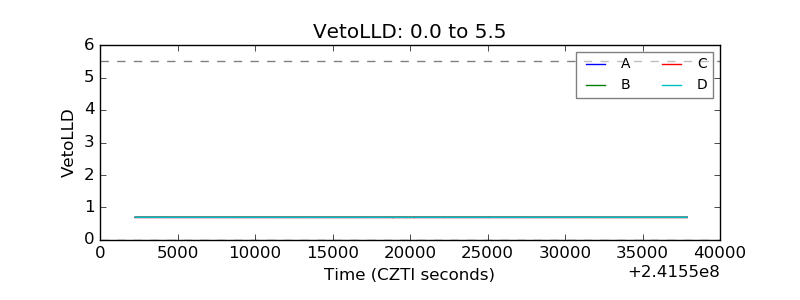 |
| Alpha Counter | 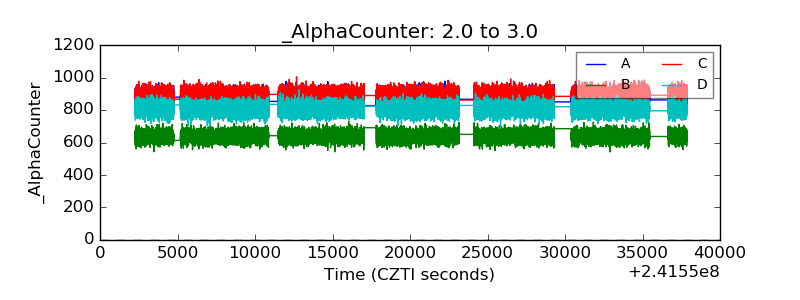 |
| _CPM_Rate | 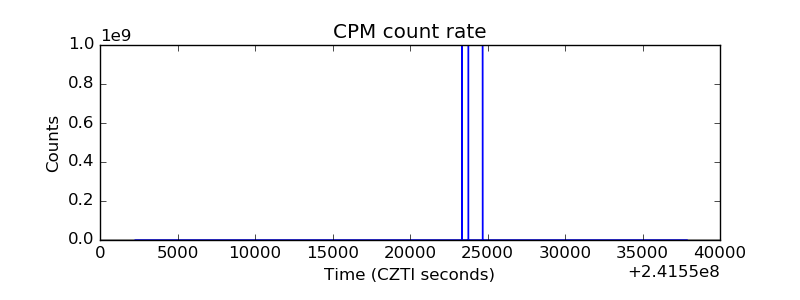 |
| CZT Counter | 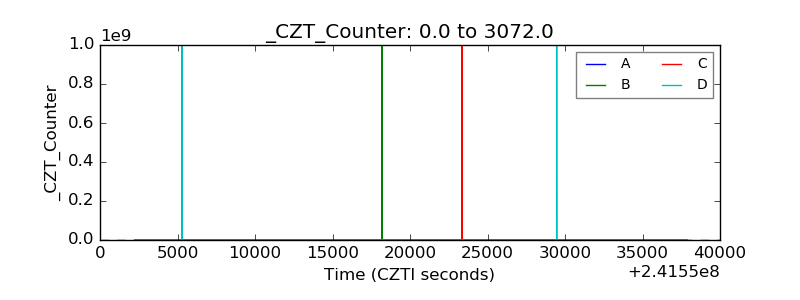 |
| +2.5 Volts monitor |  |
| +5 Volts monitor |  |
| _ROLL_ROT | 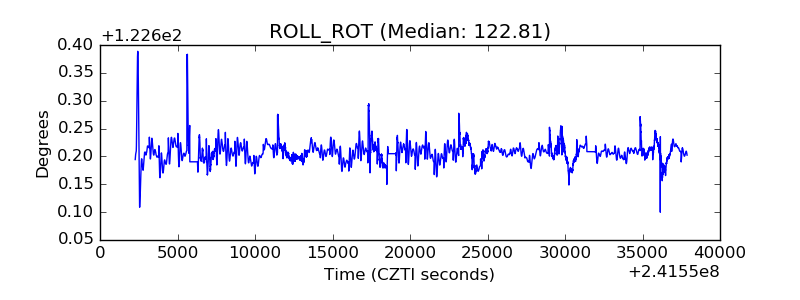 |
| _Roll_DEC | 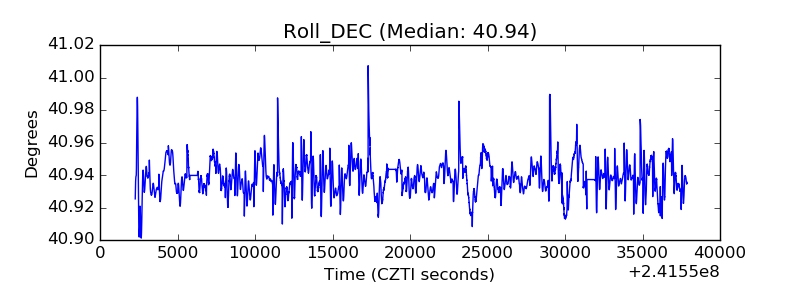 |
| _Roll_RA | 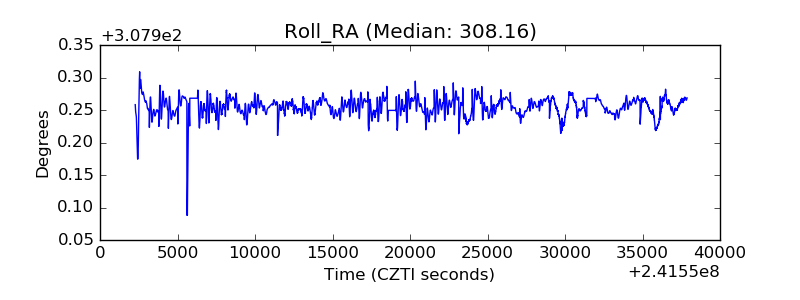 |
| Veto Counter | 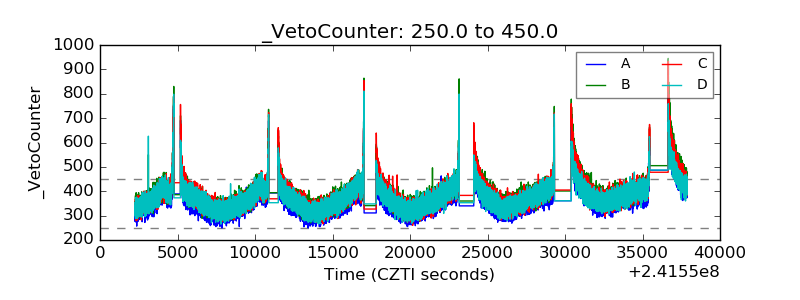 |