| Param | Original file | Final file |
|---|---|---|
| Filename | modeM0/AS1G07_048T01_9000001494_10363cztM0_level2.evt | modeM0/AS1G07_048T01_9000001494_10363cztM0_level2_quad_clean.evt |
| Size (bytes) | 533,975,040 | 67,636,800 |
| Size | 509.2 MB | 64.5 MB |
| Events in quadrant A | 3,181,968 | 415,457 |
| Events in quadrant B | 3,541,203 | 418,062 |
| Events in quadrant C | 3,095,149 | 404,087 |
| Events in quadrant D | 5,925,147 | 369,324 |
| Mode M0 | |||
|---|---|---|---|
| Quadrant | BADHDUFLAG | Total packets | Discarded packets |
| A | 0 | 13214 | 3 |
| B | 0 | 14337 | 2 |
| C | 0 | 13162 | 2 |
| D | 0 | 22010 | 2 |
| Mode M9 | |||
|---|---|---|---|
| Quadrant | BADHDUFLAG | Total packets | Discarded packets |
| A | 0 | 14 | 0 |
| B | 0 | 14 | 0 |
| C | 0 | 14 | 0 |
| D | 0 | 15 | 0 |
| Mode SS | |||
|---|---|---|---|
| Quadrant | BADHDUFLAG | Total packets | Discarded packets |
| A | 0 | 128 | 0 |
| B | 0 | 128 | 0 |
| C | 0 | 128 | 0 |
| D | 0 | 128 | 0 |
| Quadrant | Total seconds | Saturated seconds | Saturation percentage |
|---|---|---|---|
| A | 6317 | 77 | 1.218933% |
| B | 6317 | 168 | 2.659490% |
| C | 6317 | 65 | 1.028969% |
| D | 6317 | 270 | 4.274181% |
Noise dominated data is calculated using 1-second bins in cleaned event files. If a bin has >2000 counts, and if more than 50% of those come from <1% of pixels, then it is considered to be noise-dominated and hence unusable.
| Quadrant | # 1 sec bins | Bins with >0 counts | Bins with >2000 counts | High rate bins dominated by noise | Noise dominated (total time) | Noise dominated (detector-on time) | Marked lightcurve |
|---|---|---|---|---|---|---|---|
| A | 7612 | 6318 | 0 | 0 | 0.00% | 0.00% | 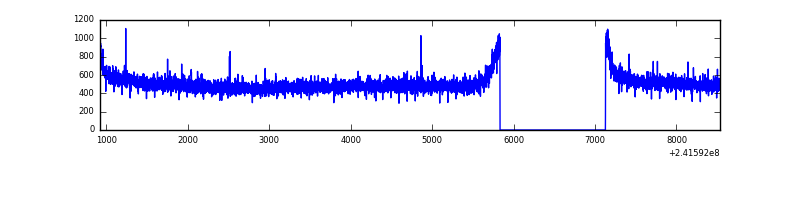 |
| B | 7612 | 6317 | 39 | 39 | 0.51% | 0.62% | 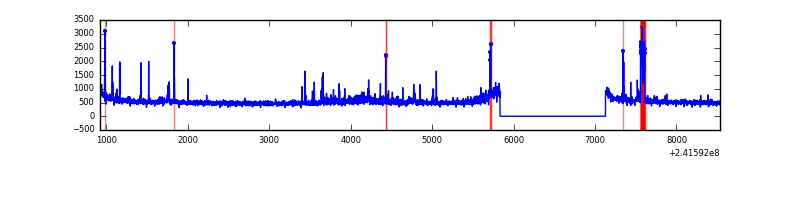 |
| C | 7612 | 6318 | 1 | 1 | 0.01% | 0.02% | 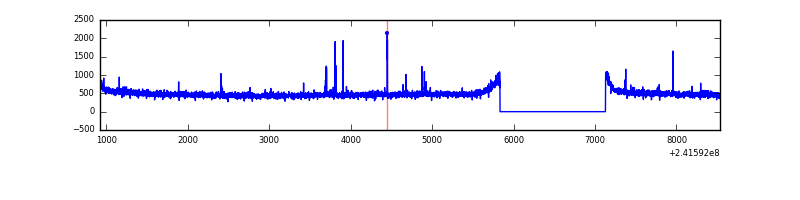 |
| D | 7612 | 6318 | 214 | 214 | 2.81% | 3.39% | 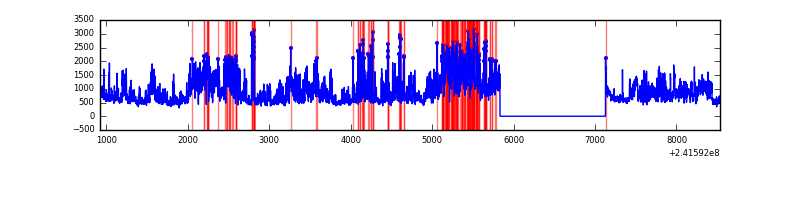 |
Top three noisy pixels from each quadrant. If the there are fewer than three noisy pixels in the level2.evt file, extra rows are filled as -1
| Pixel properties | Quadrant properties | ||||||
|---|---|---|---|---|---|---|---|
| Quadrant | DetID | PixID | Counts | Sigma | Mean | Median | Sigma |
| A | 3 | 1 | 9709 | 53.82 | 821 | 807 | 165.4 |
| A | 0 | 226 | 7633 | 41.27 | 821 | 807 | 165.4 |
| A | 12 | 194 | 6618 | 35.13 | 821 | 807 | 165.4 |
| B | 4 | 239 | 192428 | 1249.1 | 817 | 800 | 153.4 |
| B | 0 | 214 | 58961 | 379.11 | 817 | 800 | 153.4 |
| B | 11 | 51 | 57667 | 370.68 | 817 | 800 | 153.4 |
| C | 14 | 234 | 31452 | 171.4 | 785 | 790 | 178.9 |
| C | 13 | 61 | 5886 | 28.49 | 785 | 790 | 178.9 |
| C | 12 | 4 | 2592 | 10.07 | 785 | 790 | 178.9 |
| D | 1 | 20 | 2270924 | 12384.64 | 769 | 748 | 183.3 |
| D | 8 | 195 | 248949 | 1354.03 | 769 | 748 | 183.3 |
| D | 1 | 52 | 226993 | 1234.25 | 769 | 748 | 183.3 |
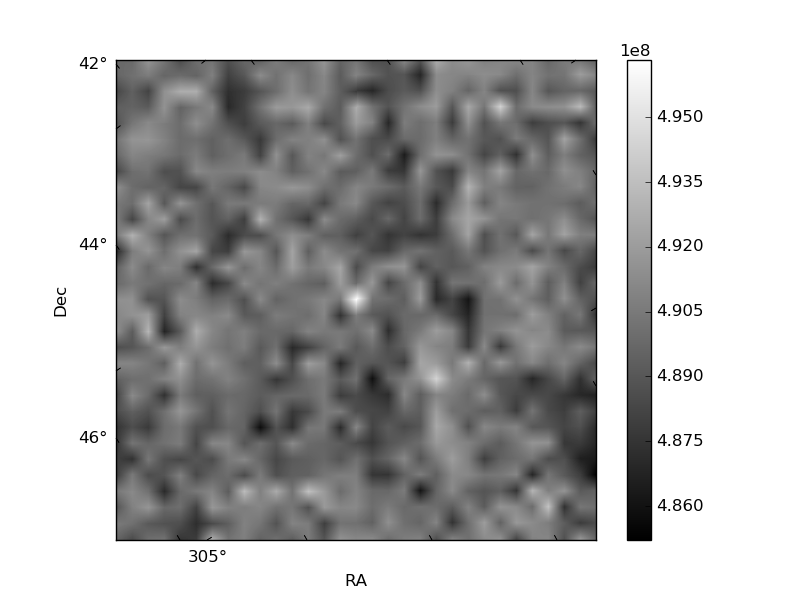
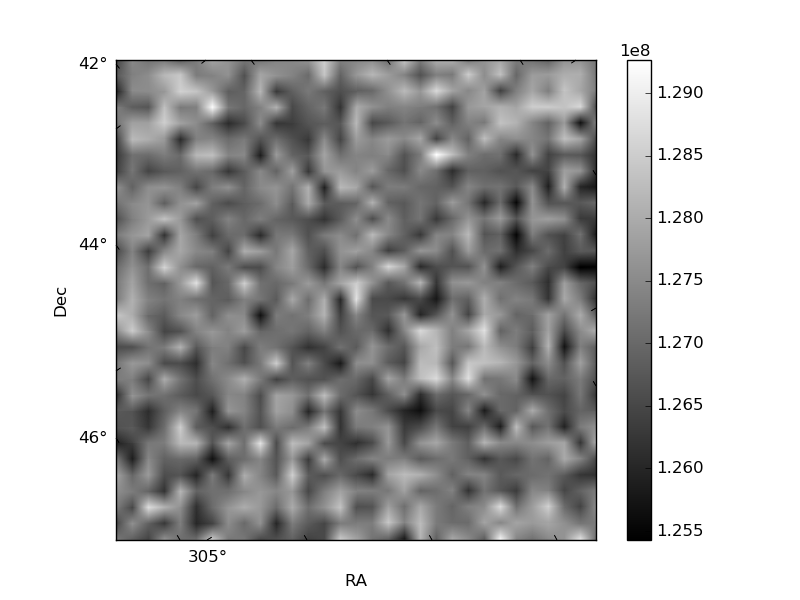
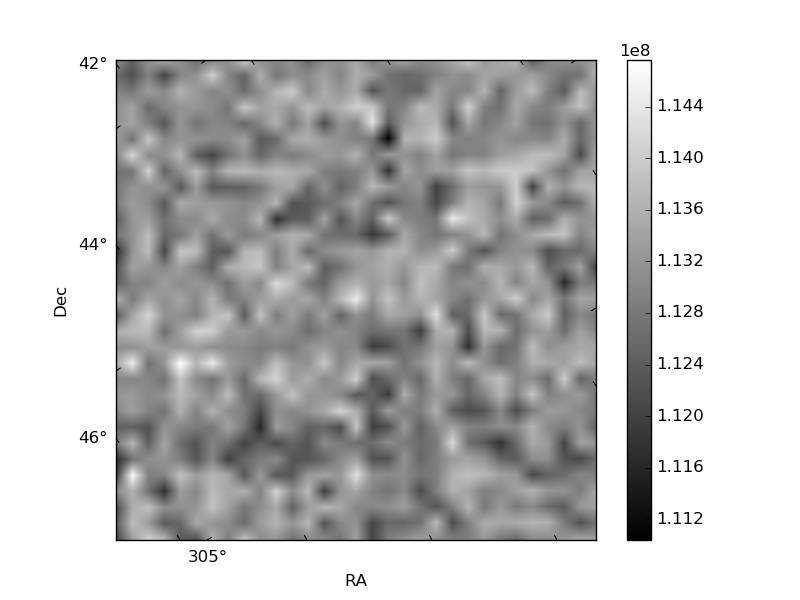
Histogram calculated using DETX and DETY for each event in the final _common_clean file
| Quadrant A | 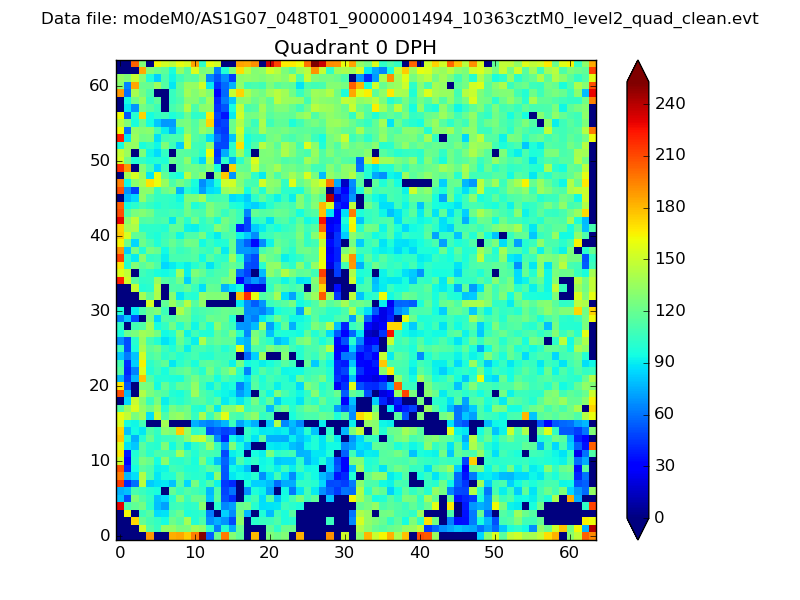 |
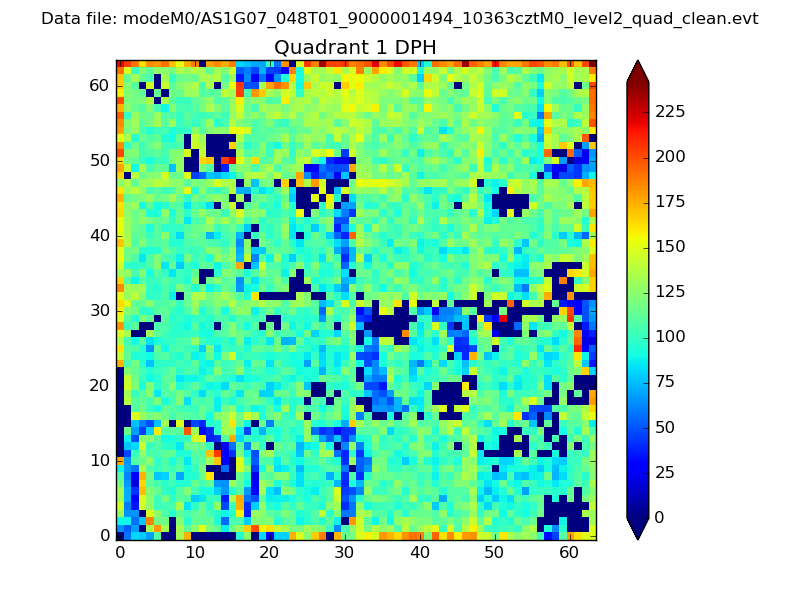 |
Quadrant B |
|---|---|---|---|
| Quadrant D | 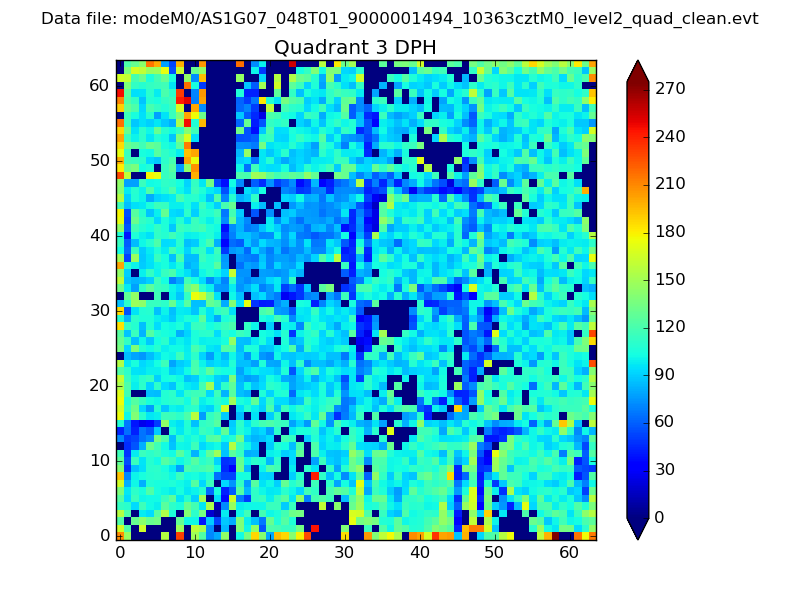 |
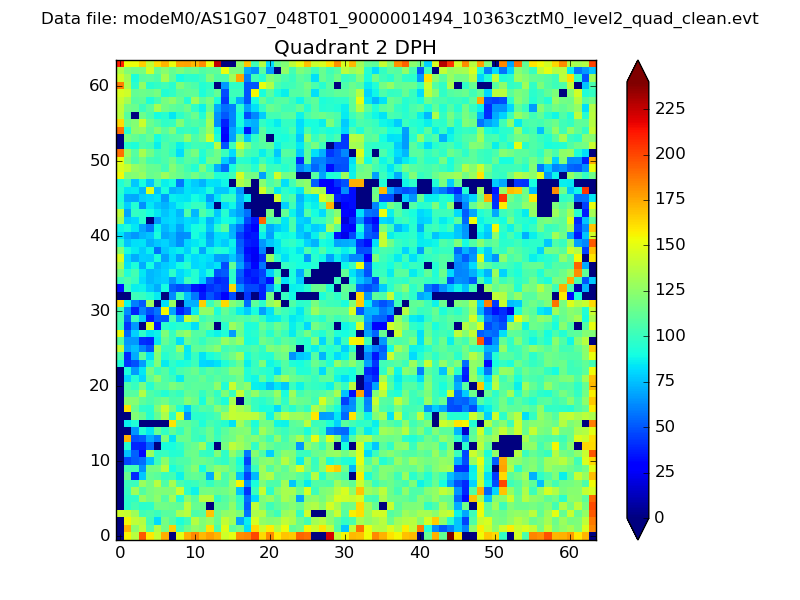 |
Quadrant C |
| Plot type | Count rate plots | Images |
|---|---|---|
| Comparison with Poisson distribution Blue bars denote a histogram of data divided into 1 sec bins. Red curve is a Poisson curve with rate = median count rate of data. |
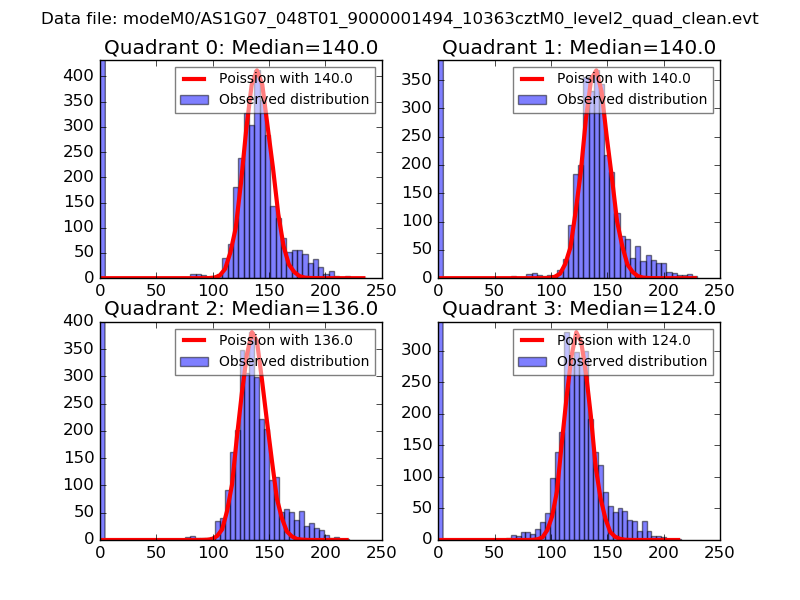 |
 |
| Quadrant-wise count rates Data is divided into 100 sec bins |
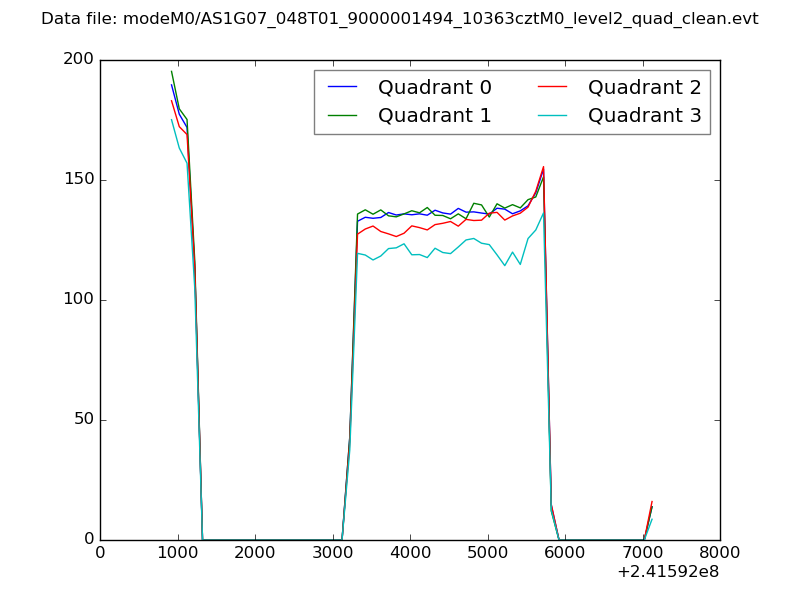 |
|
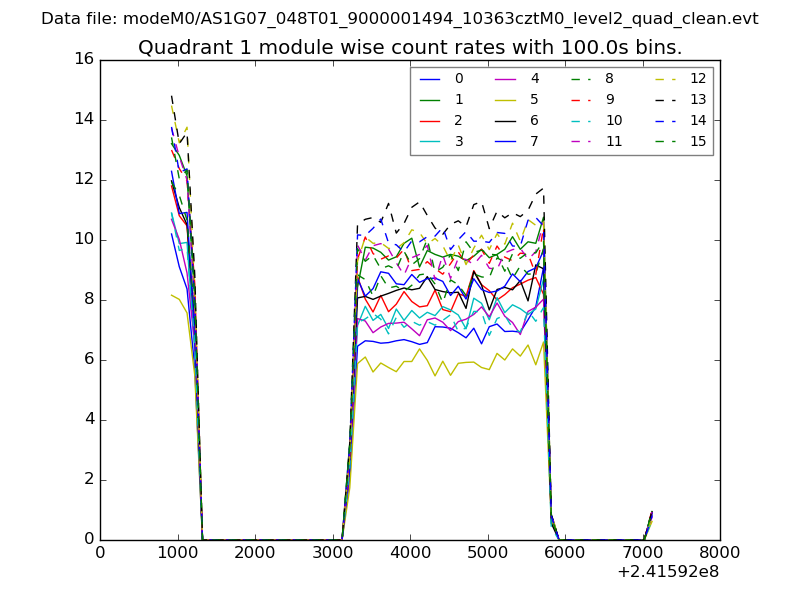
| Module-wise count rates for Quadrant A Data is divided into 100 sec bins |
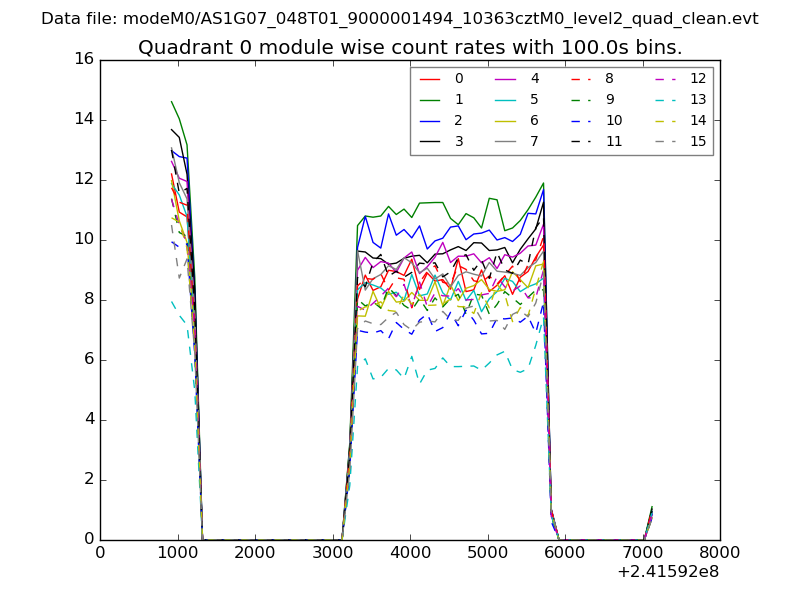 |
 |
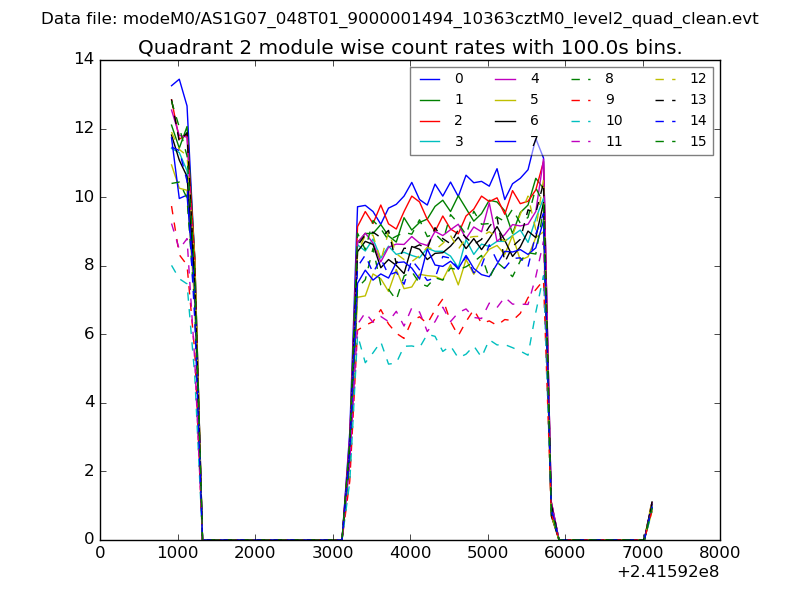
| Module-wise count rates for Quadrant B Data is divided into 100 sec bins |
 |
 |
| Module-wise count rates for Quadrant C Data is divided into 100 sec bins |
 |
 |
| Module-wise count rates for Quadrant D Data is divided into 100 sec bins |
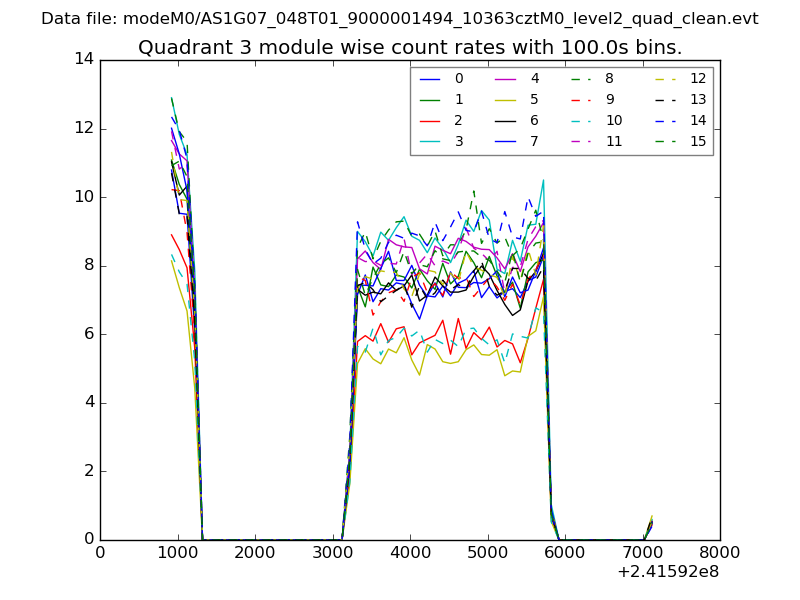 |
 |
| Parameter | Plot |
|---|---|
| CZT HV Monitor | 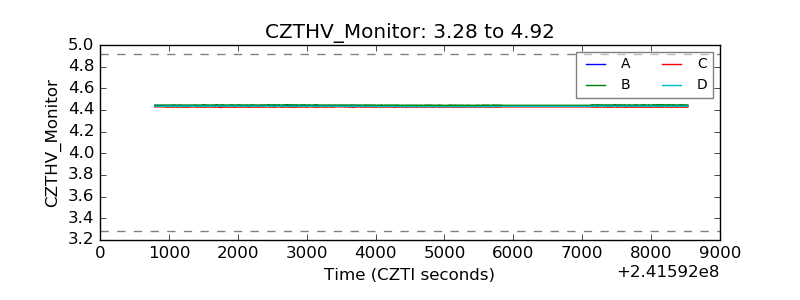 |
| D_VDD | 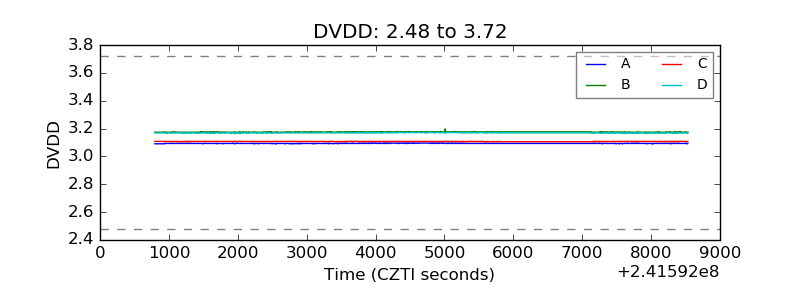 |
| Temperature 1 |  |
| Veto HV Monitor | 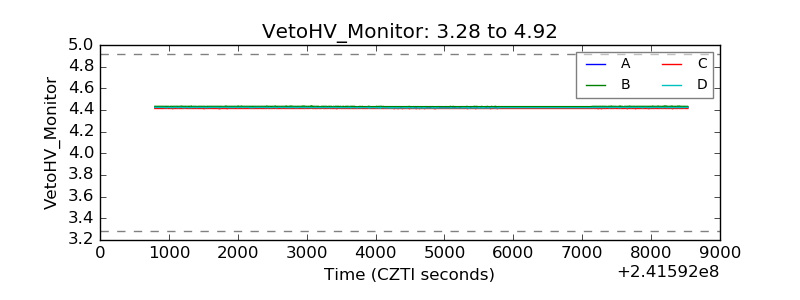 |
| Veto LLD | 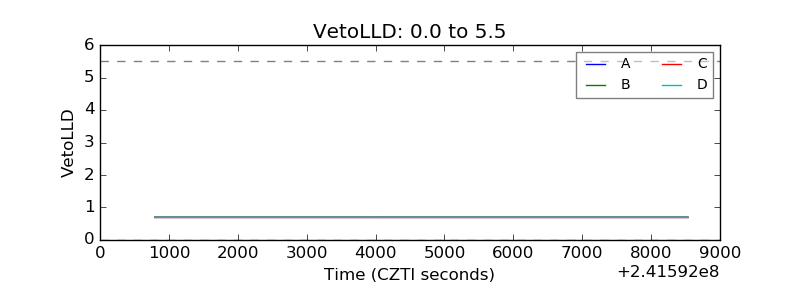 |
| Alpha Counter | 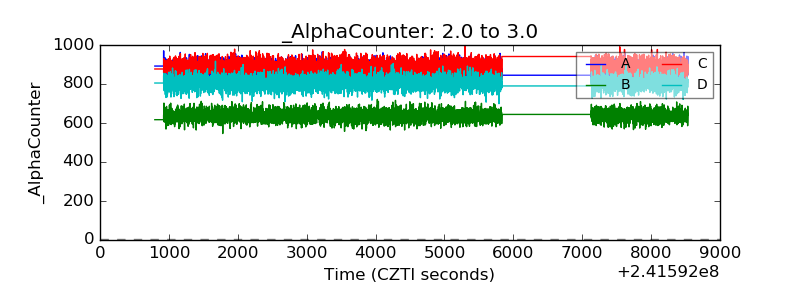 |
| _CPM_Rate | 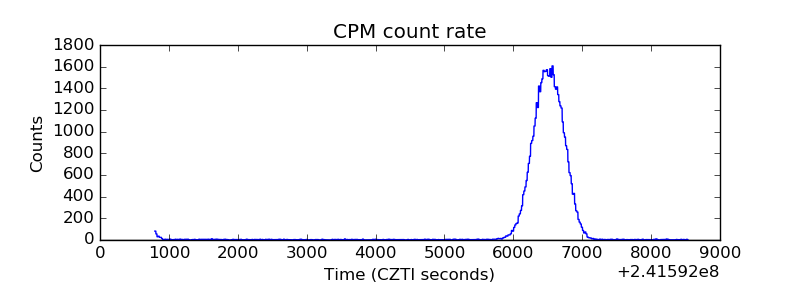 |
| CZT Counter | 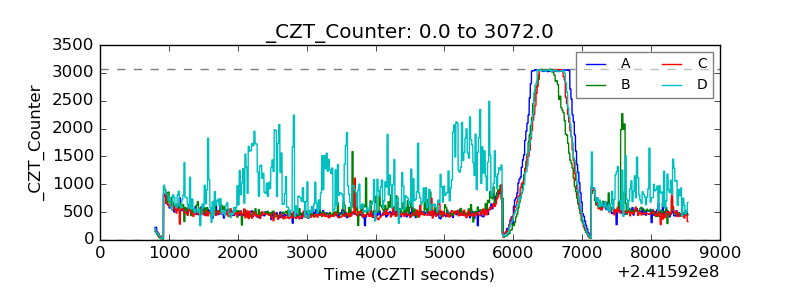 |
| +2.5 Volts monitor |  |
| +5 Volts monitor |  |
| _ROLL_ROT | 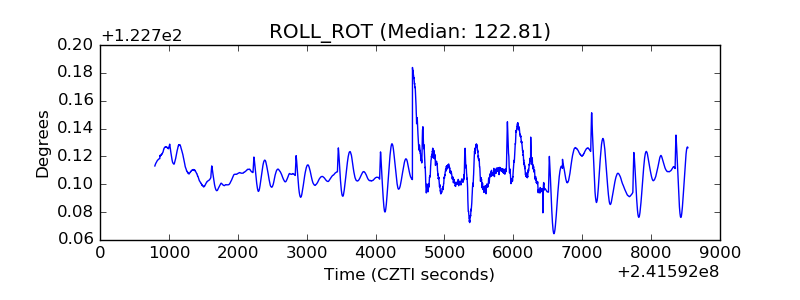 |
| _Roll_DEC | 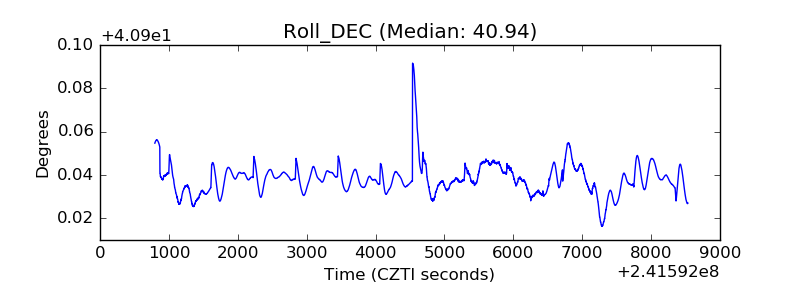 |
| _Roll_RA | 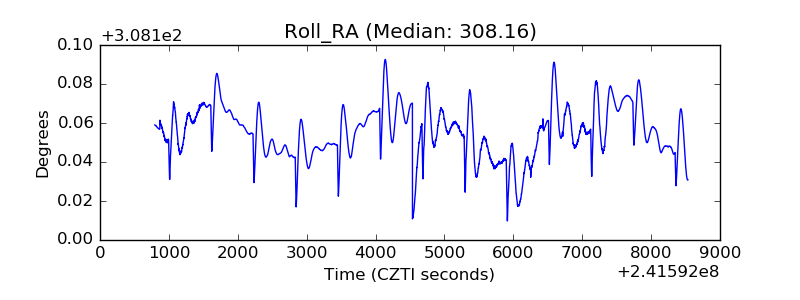 |
| Veto Counter | 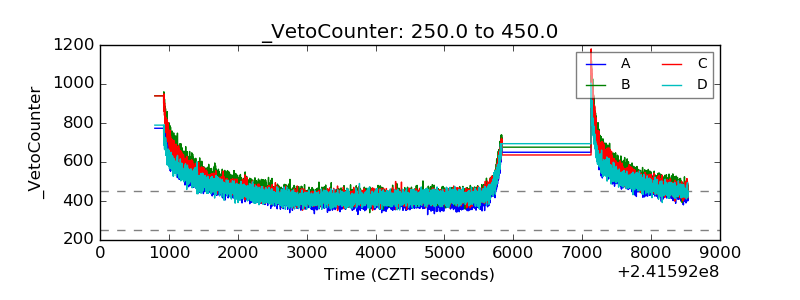 |