| Param | Original file | Final file |
|---|---|---|
| Filename | modeM0/AS1G07_048T01_9000001494_10364cztM0_level2.evt | modeM0/AS1G07_048T01_9000001494_10364cztM0_level2_quad_clean.evt |
| Size (bytes) | 540,221,760 | 66,631,680 |
| Size | 515.2 MB | 63.5 MB |
| Events in quadrant A | 3,096,777 | 411,523 |
| Events in quadrant B | 3,467,606 | 412,709 |
| Events in quadrant C | 3,016,618 | 400,907 |
| Events in quadrant D | 6,363,256 | 362,852 |
| Mode M0 | |||
|---|---|---|---|
| Quadrant | BADHDUFLAG | Total packets | Discarded packets |
| A | 0 | 12899 | 3 |
| B | 0 | 14027 | 13 |
| C | 0 | 12855 | 8 |
| D | 0 | 23186 | 11 |
| Mode M9 | |||
|---|---|---|---|
| Quadrant | BADHDUFLAG | Total packets | Discarded packets |
| A | 0 | 15 | 0 |
| B | 0 | 15 | 0 |
| C | 0 | 15 | 0 |
| D | 0 | 16 | 0 |
| Mode SS | |||
|---|---|---|---|
| Quadrant | BADHDUFLAG | Total packets | Discarded packets |
| A | 0 | 124 | 0 |
| B | 0 | 124 | 0 |
| C | 0 | 124 | 0 |
| D | 0 | 124 | 0 |
| Quadrant | Total seconds | Saturated seconds | Saturation percentage |
|---|---|---|---|
| A | 6155 | 113 | 1.835906% |
| B | 6152 | 216 | 3.511053% |
| C | 6152 | 68 | 1.105332% |
| D | 6153 | 419 | 6.809686% |
Noise dominated data is calculated using 1-second bins in cleaned event files. If a bin has >2000 counts, and if more than 50% of those come from <1% of pixels, then it is considered to be noise-dominated and hence unusable.
| Quadrant | # 1 sec bins | Bins with >0 counts | Bins with >2000 counts | High rate bins dominated by noise | Noise dominated (total time) | Noise dominated (detector-on time) | Marked lightcurve |
|---|---|---|---|---|---|---|---|
| A | 7455 | 6155 | 0 | 0 | 0.00% | 0.00% | 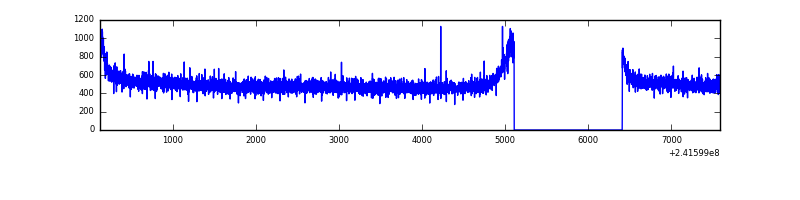 |
| B | 7455 | 6155 | 55 | 55 | 0.74% | 0.89% | 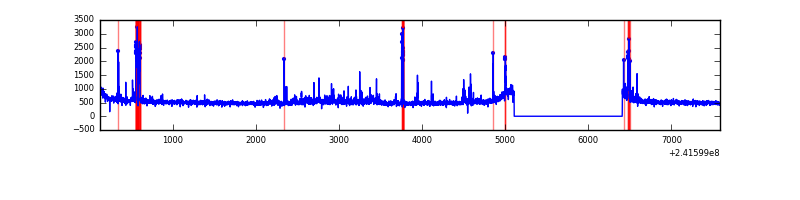 |
| C | 7455 | 6155 | 1 | 1 | 0.01% | 0.02% | 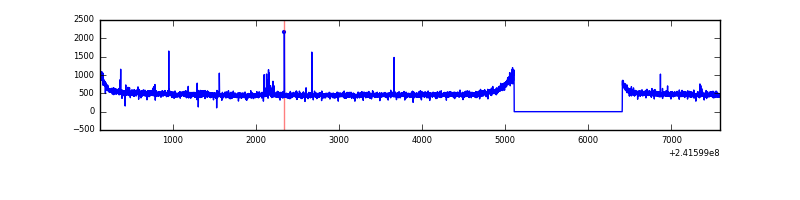 |
| D | 7455 | 6155 | 301 | 301 | 4.04% | 4.89% | 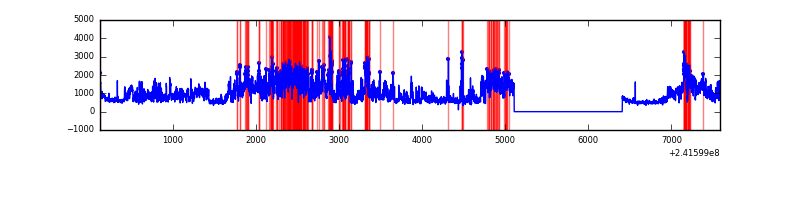 |
Top three noisy pixels from each quadrant. If the there are fewer than three noisy pixels in the level2.evt file, extra rows are filled as -1
| Pixel properties | Quadrant properties | ||||||
|---|---|---|---|---|---|---|---|
| Quadrant | DetID | PixID | Counts | Sigma | Mean | Median | Sigma |
| A | 0 | 226 | 7486 | 41.62 | 801 | 784 | 161.0 |
| A | 12 | 194 | 6323 | 34.4 | 801 | 784 | 161.0 |
| A | 8 | 5 | 6036 | 32.62 | 801 | 784 | 161.0 |
| B | 4 | 239 | 245389 | 1641.99 | 794 | 777 | 149.0 |
| B | 0 | 214 | 59164 | 391.93 | 794 | 777 | 149.0 |
| B | 0 | 219 | 48405 | 319.71 | 794 | 777 | 149.0 |
| C | 14 | 234 | 28620 | 158.69 | 765 | 770 | 175.5 |
| C | 13 | 61 | 5870 | 29.06 | 765 | 770 | 175.5 |
| C | 12 | 4 | 1910 | 6.5 | 765 | 770 | 175.5 |
| D | 1 | 20 | 2895043 | 16298.4 | 749 | 729 | 177.6 |
| D | 1 | 52 | 276520 | 1553.03 | 749 | 729 | 177.6 |
| D | 8 | 195 | 171290 | 960.46 | 749 | 729 | 177.6 |
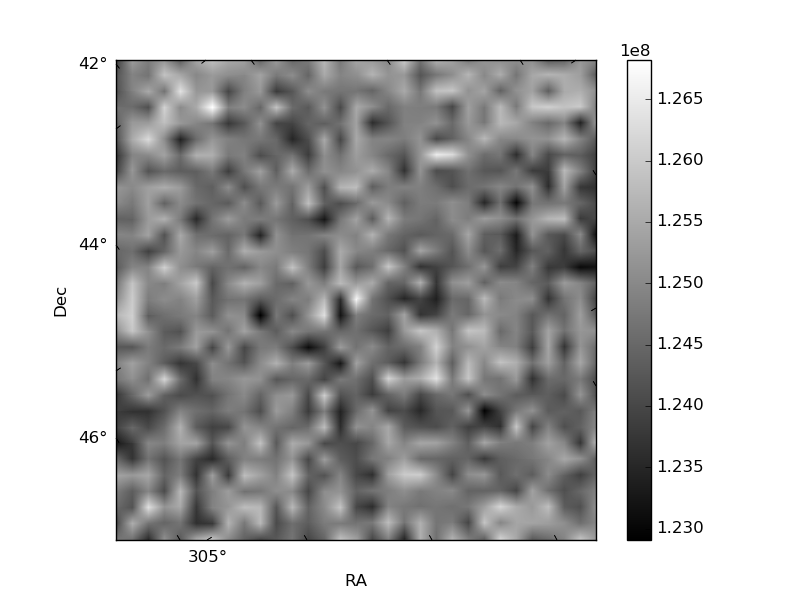
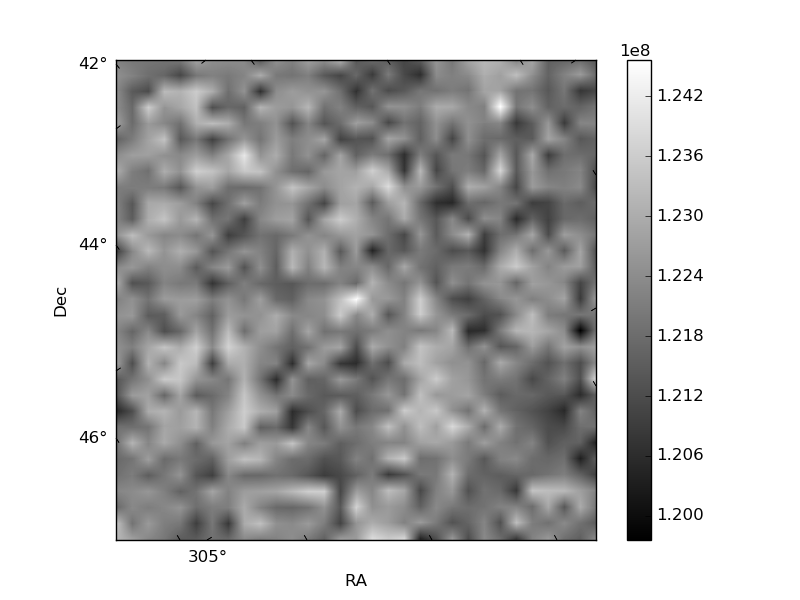
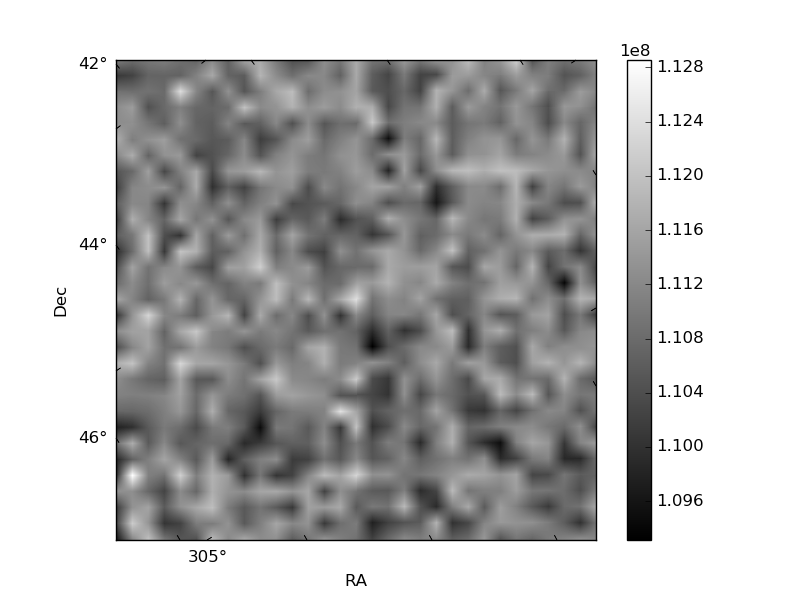
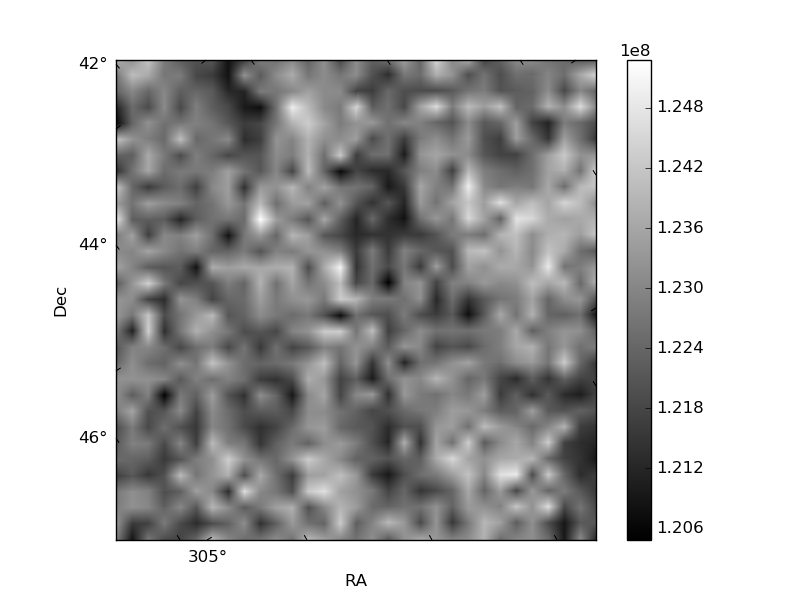
Histogram calculated using DETX and DETY for each event in the final _common_clean file
| Quadrant A | 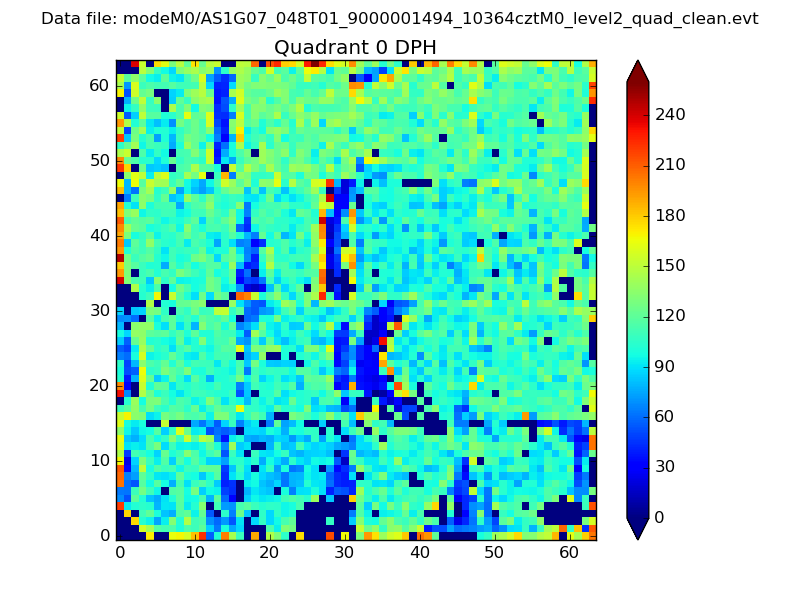 |
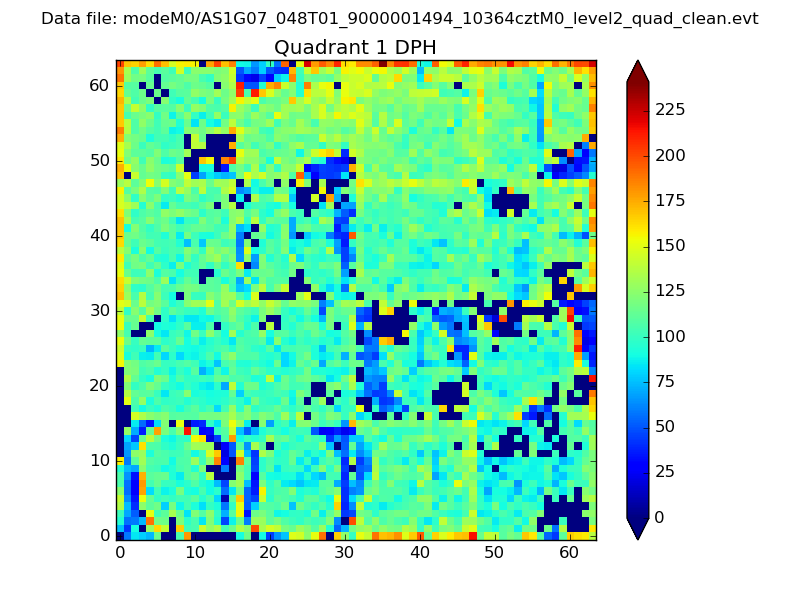 |
Quadrant B |
|---|---|---|---|
| Quadrant D | 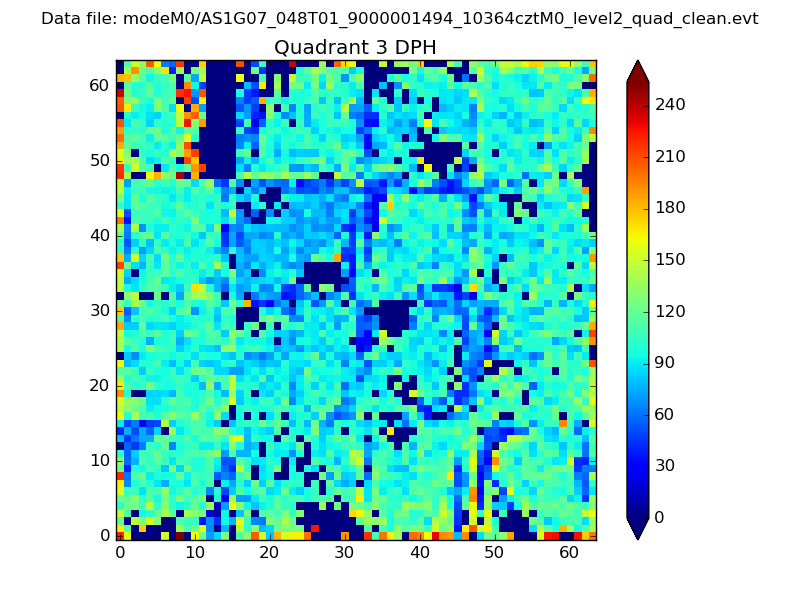 |
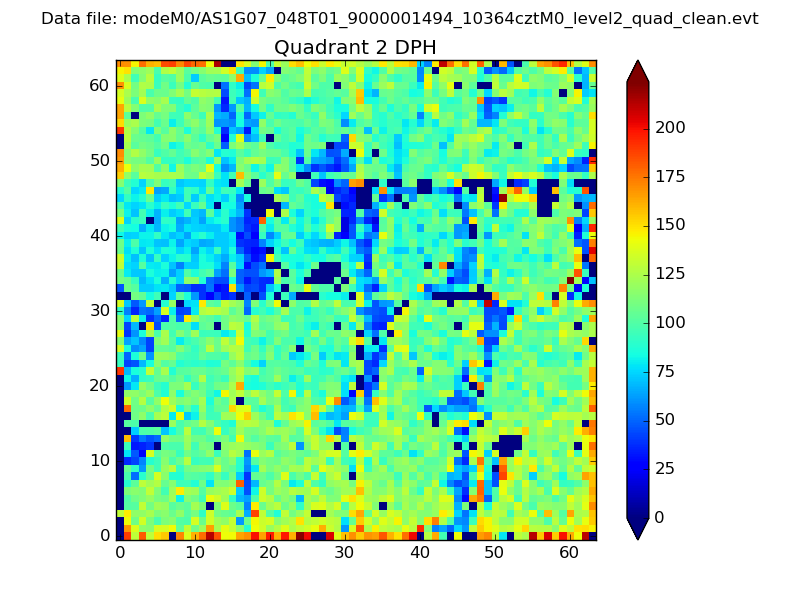 |
Quadrant C |
| Plot type | Count rate plots | Images |
|---|---|---|
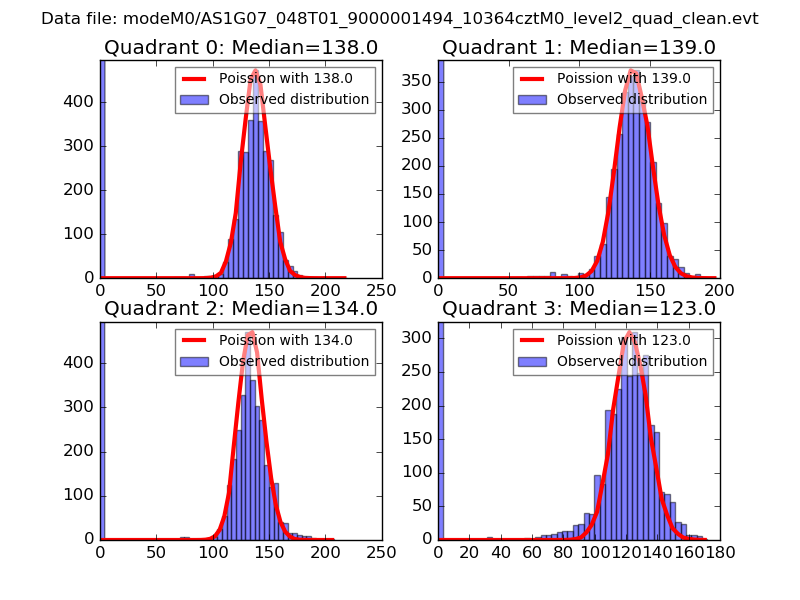
| Comparison with Poisson distribution Blue bars denote a histogram of data divided into 1 sec bins. Red curve is a Poisson curve with rate = median count rate of data. |
 |
 |
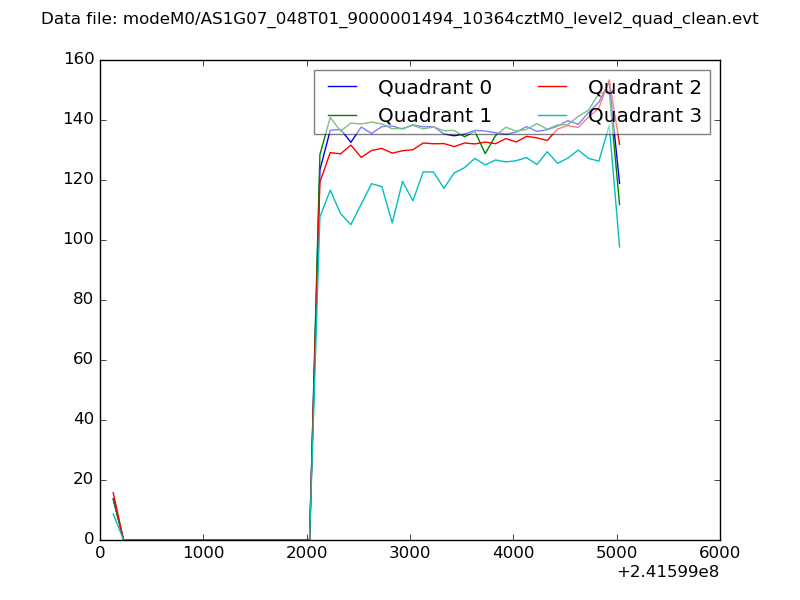
| Quadrant-wise count rates Data is divided into 100 sec bins |
 |
|
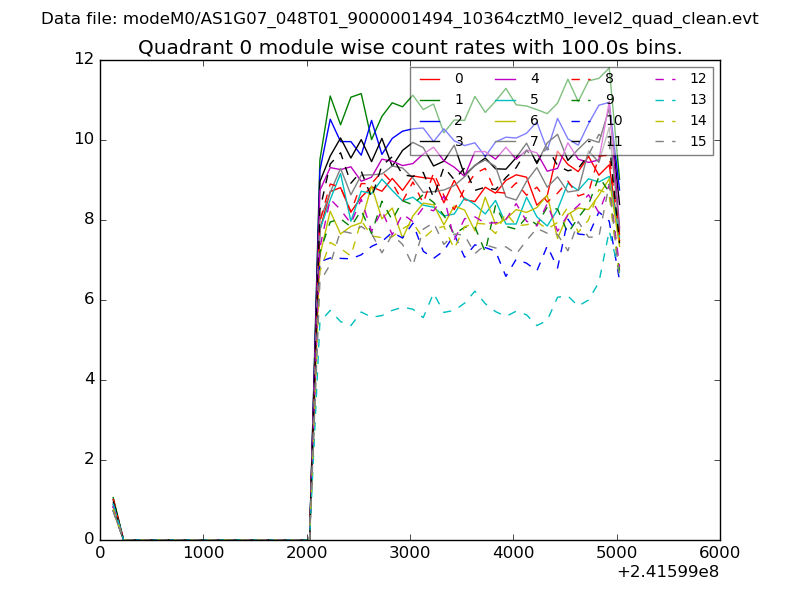
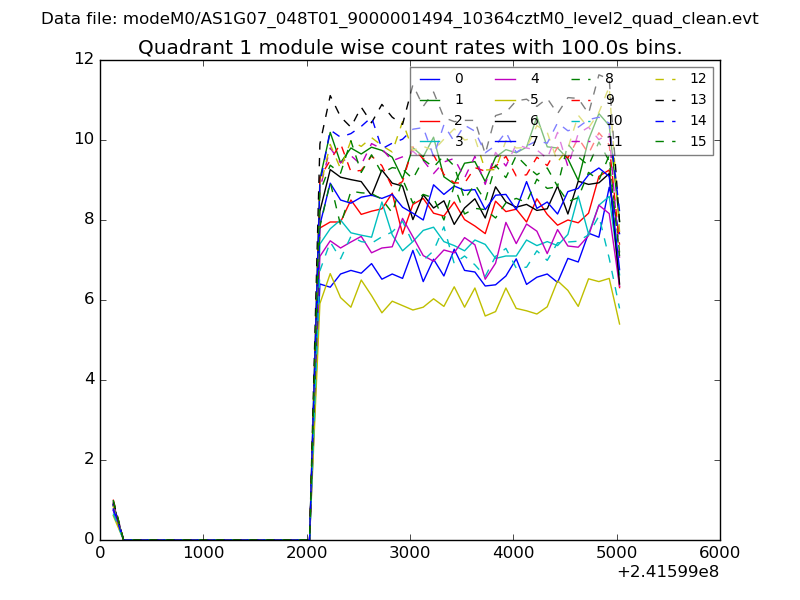
| Module-wise count rates for Quadrant A Data is divided into 100 sec bins |
 |
 |
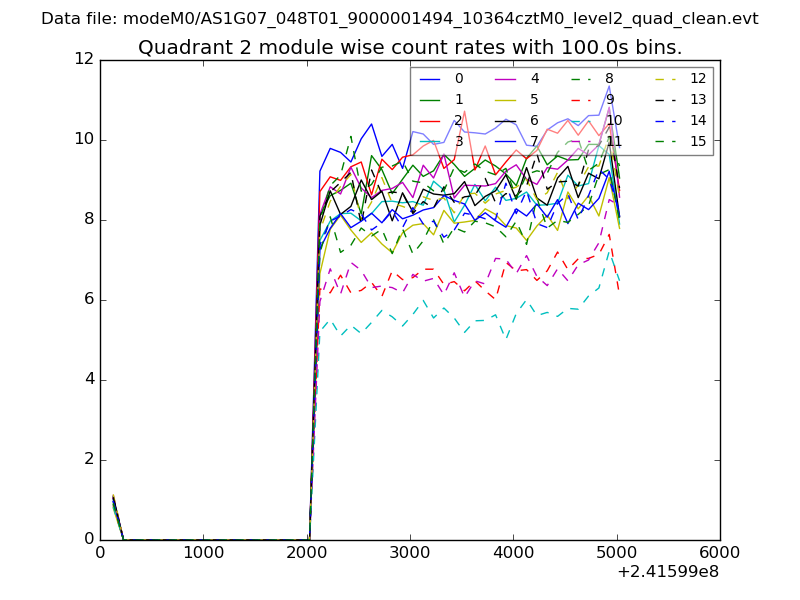
| Module-wise count rates for Quadrant B Data is divided into 100 sec bins |
 |
 |
| Module-wise count rates for Quadrant C Data is divided into 100 sec bins |
 |
 |
| Module-wise count rates for Quadrant D Data is divided into 100 sec bins |
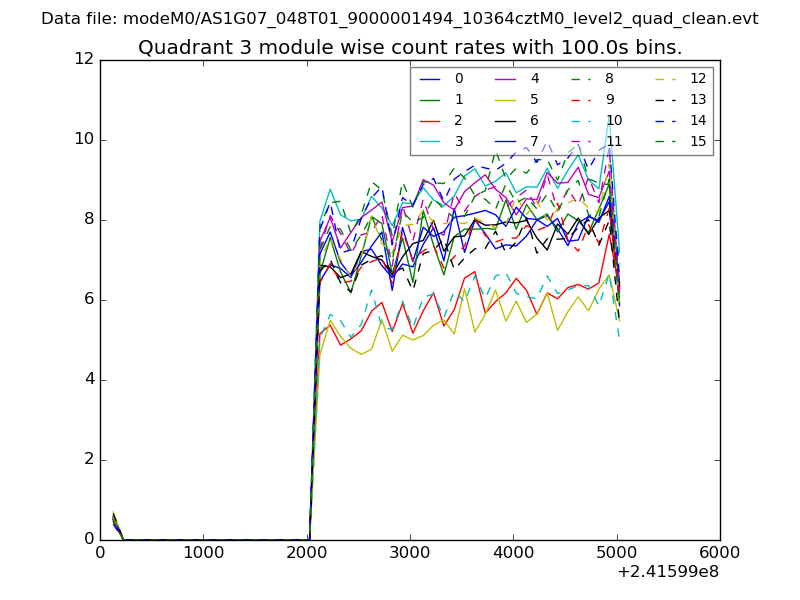 |
 |
| Parameter | Plot |
|---|---|
| CZT HV Monitor | 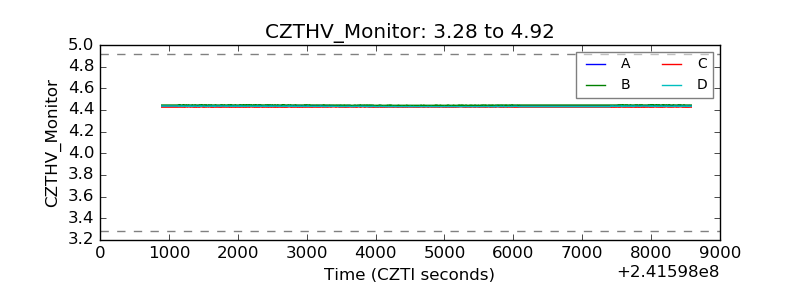 |
| D_VDD |  |
| Temperature 1 | 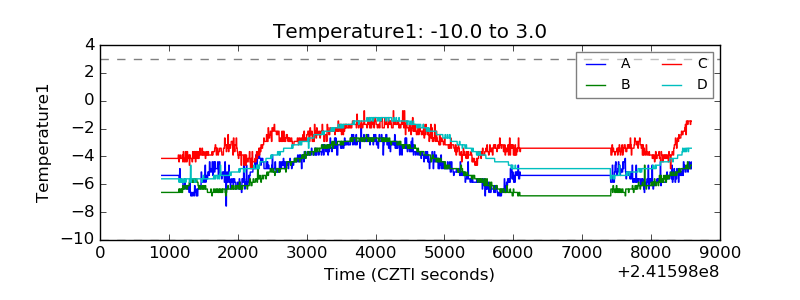 |
| Veto HV Monitor | 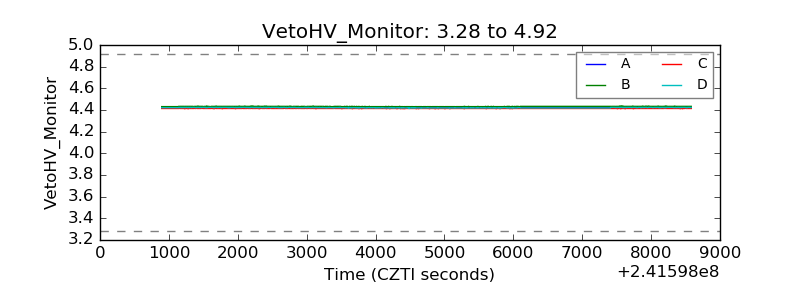 |
| Veto LLD | 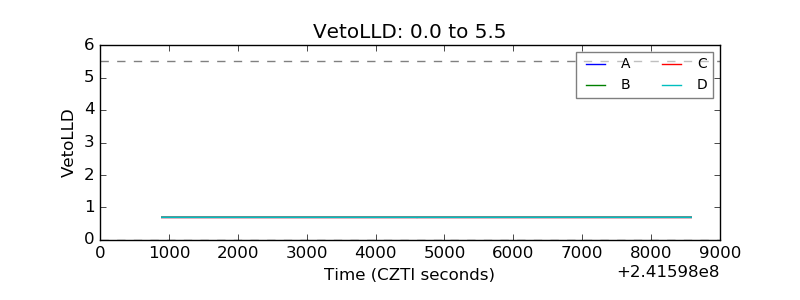 |
| Alpha Counter | 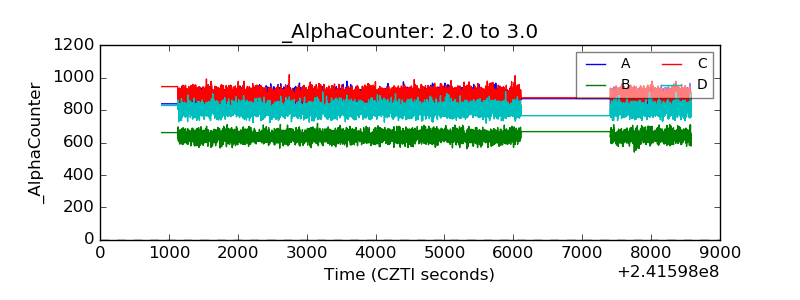 |
| _CPM_Rate | 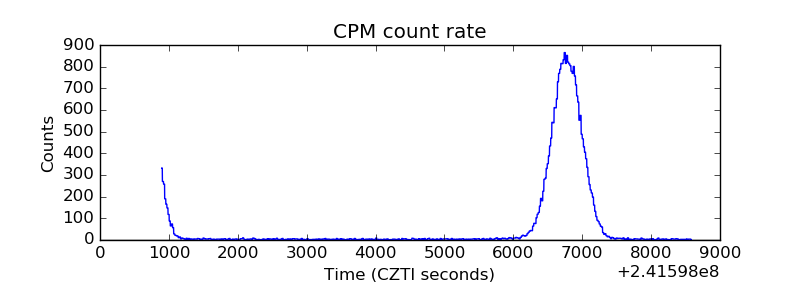 |
| CZT Counter | 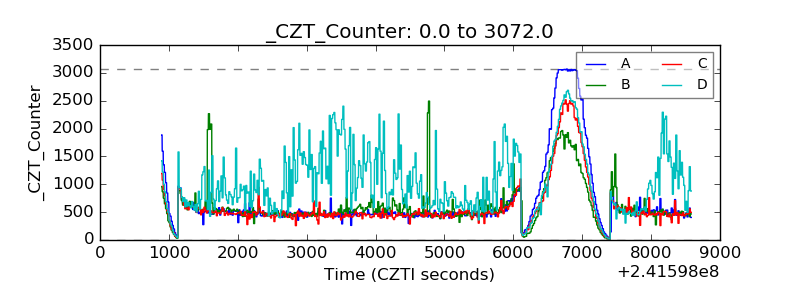 |
| +2.5 Volts monitor |  |
| +5 Volts monitor |  |
| _ROLL_ROT | 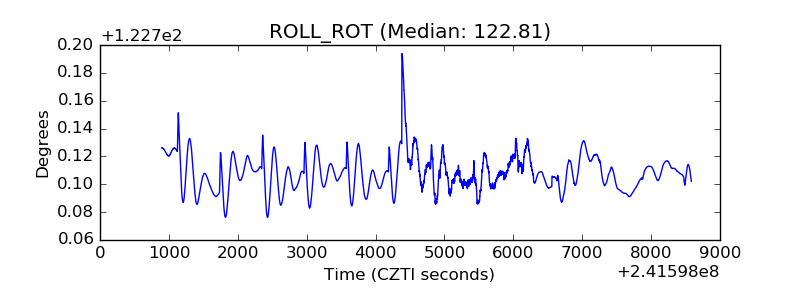 |
| _Roll_DEC | 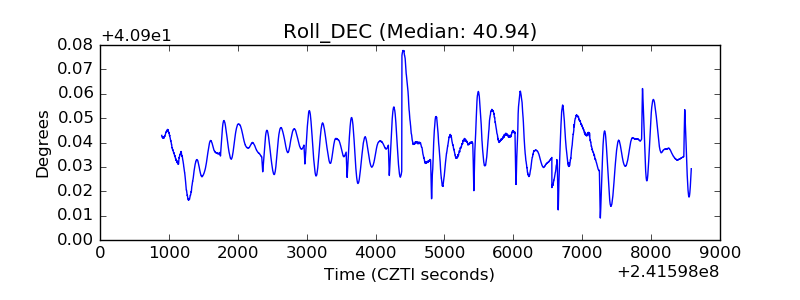 |
| _Roll_RA | 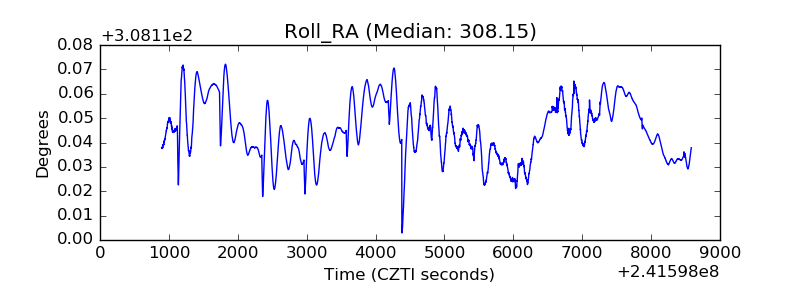 |
| Veto Counter | 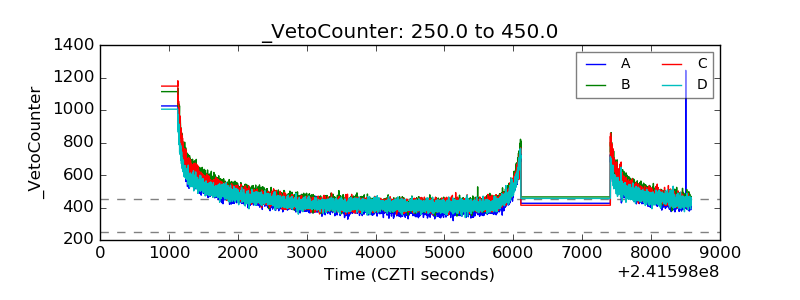 |