| Param | Original file | Final file |
|---|---|---|
| Filename | modeM0/AS1G07_048T01_9000001494_10365cztM0_level2.evt | modeM0/AS1G07_048T01_9000001494_10365cztM0_level2_quad_clean.evt |
| Size (bytes) | 730,177,920 | 115,778,880 |
| Size | 696.4 MB | 110.4 MB |
| Events in quadrant A | 4,758,157 | 787,167 |
| Events in quadrant B | 4,931,585 | 763,137 |
| Events in quadrant C | 4,634,532 | 762,135 |
| Events in quadrant D | 7,154,832 | 545,717 |
| Mode M0 | |||
|---|---|---|---|
| Quadrant | BADHDUFLAG | Total packets | Discarded packets |
| A | 0 | 61153 | 41066 |
| B | 0 | 69269 | 49023 |
| C | 0 | 64210 | 44108 |
| D | 0 | 117272 | 90512 |
| Mode M9 | |||
|---|---|---|---|
| Quadrant | BADHDUFLAG | Total packets | Discarded packets |
| A | 0 | 74 | 44 |
| B | 0 | 88 | 57 |
| C | 0 | 87 | 56 |
| D | 0 | 74 | 43 |
| Mode SS | |||
|---|---|---|---|
| Quadrant | BADHDUFLAG | Total packets | Discarded packets |
| A | 0 | 630 | 411 |
| B | 0 | 632 | 412 |
| C | 0 | 629 | 409 |
| D | 0 | 607 | 383 |
| Quadrant | Total seconds | Saturated seconds | Saturation percentage |
|---|---|---|---|
| A | 9743 | 136 | 1.395874% |
| B | 9441 | 161 | 1.705328% |
| C | 9774 | 81 | 0.828729% |
| D | 8146 | 273 | 3.351338% |
Noise dominated data is calculated using 1-second bins in cleaned event files. If a bin has >2000 counts, and if more than 50% of those come from <1% of pixels, then it is considered to be noise-dominated and hence unusable.
| Quadrant | # 1 sec bins | Bins with >0 counts | Bins with >2000 counts | High rate bins dominated by noise | Noise dominated (total time) | Noise dominated (detector-on time) | Marked lightcurve |
|---|---|---|---|---|---|---|---|
| A | 14235 | 11409 | 0 | 0 | 0.00% | 0.00% | 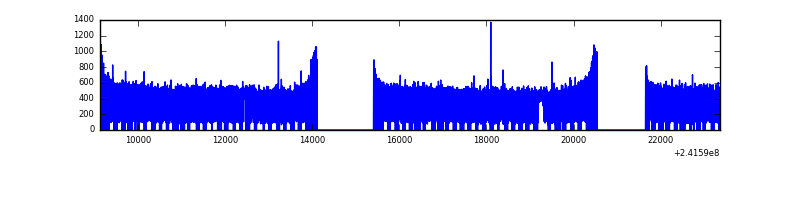 |
| B | 14235 | 11153 | 1 | 1 | 0.01% | 0.01% | 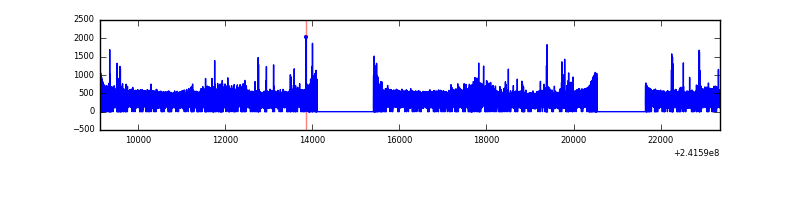 |
| C | 14234 | 11415 | 0 | 0 | 0.00% | 0.00% |  |
| D | 14235 | 9800 | 53 | 53 | 0.37% | 0.54% | 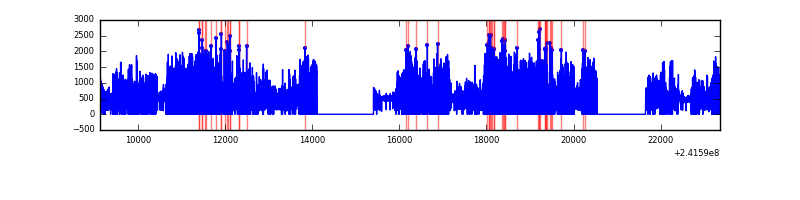 |
Top three noisy pixels from each quadrant. If the there are fewer than three noisy pixels in the level2.evt file, extra rows are filled as -1
| Pixel properties | Quadrant properties | ||||||
|---|---|---|---|---|---|---|---|
| Quadrant | DetID | PixID | Counts | Sigma | Mean | Median | Sigma |
| A | 0 | 226 | 11381 | 41.31 | 1233 | 1209 | 246.3 |
| A | 12 | 194 | 9991 | 35.66 | 1233 | 1209 | 246.3 |
| A | 13 | 253 | 6527 | 21.59 | 1233 | 1209 | 246.3 |
| B | 0 | 214 | 118118 | 524.98 | 1186 | 1161 | 222.8 |
| B | 4 | 239 | 85107 | 376.81 | 1186 | 1161 | 222.8 |
| B | 11 | 51 | 79804 | 353.0 | 1186 | 1161 | 222.8 |
| C | 14 | 234 | 23724 | 83.51 | 1181 | 1186 | 269.9 |
| C | 13 | 61 | 8924 | 28.67 | 1181 | 1186 | 269.9 |
| C | 11 | 7 | 3718 | 9.38 | 1181 | 1186 | 269.9 |
| D | 1 | 20 | 2902852 | 12611.08 | 981 | 954 | 230.1 |
| D | 1 | 52 | 196982 | 851.9 | 981 | 954 | 230.1 |
| D | 8 | 195 | 150967 | 651.93 | 981 | 954 | 230.1 |
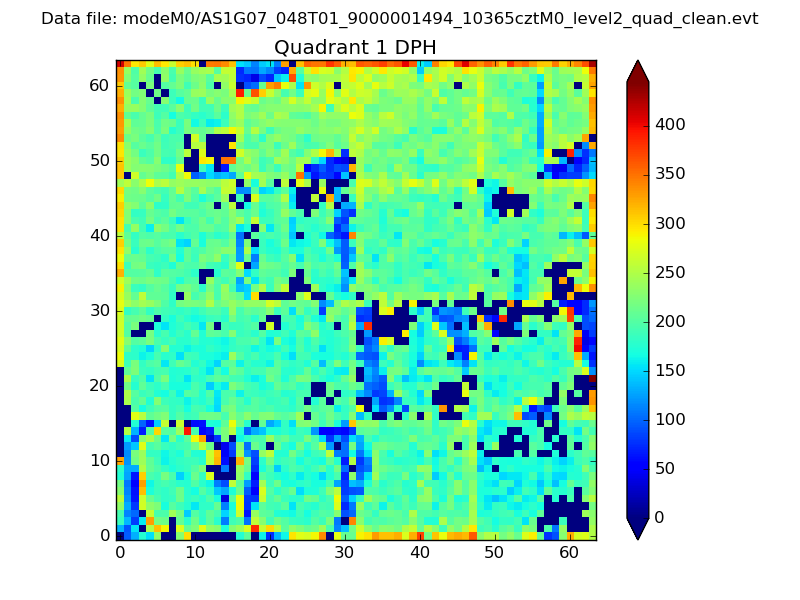
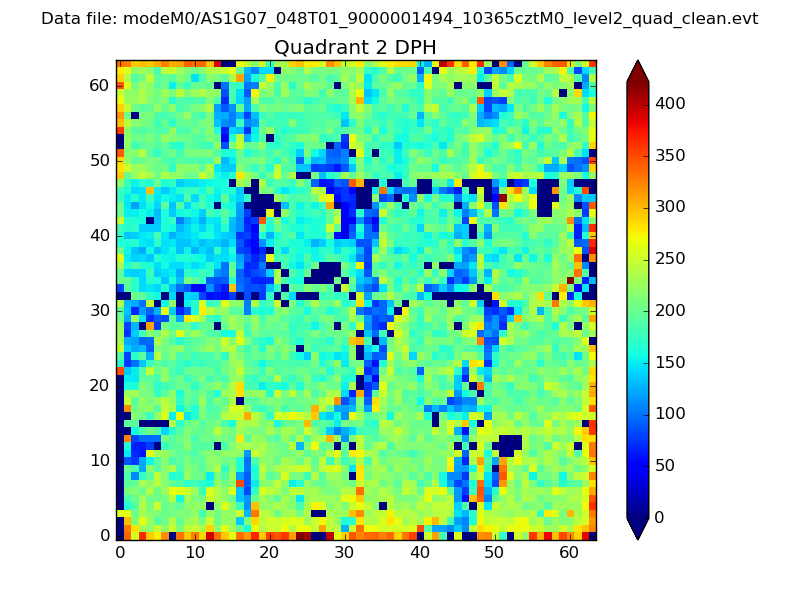
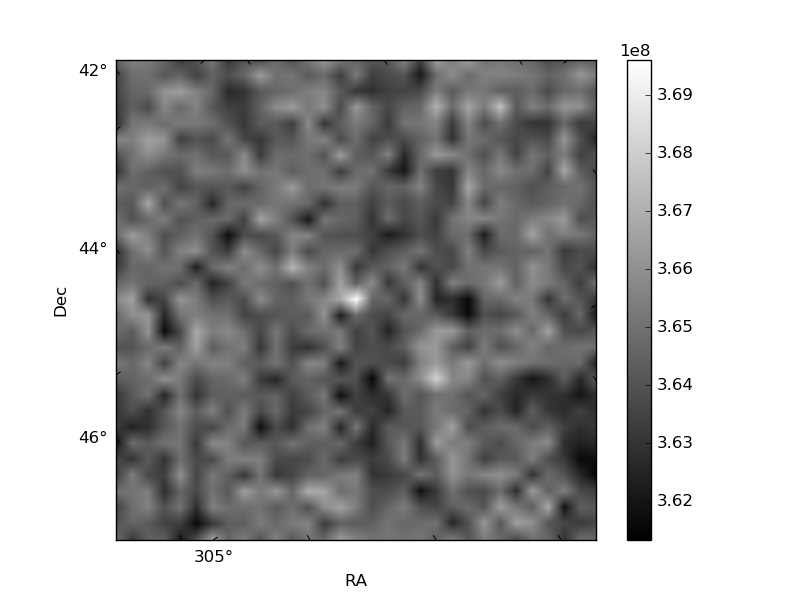
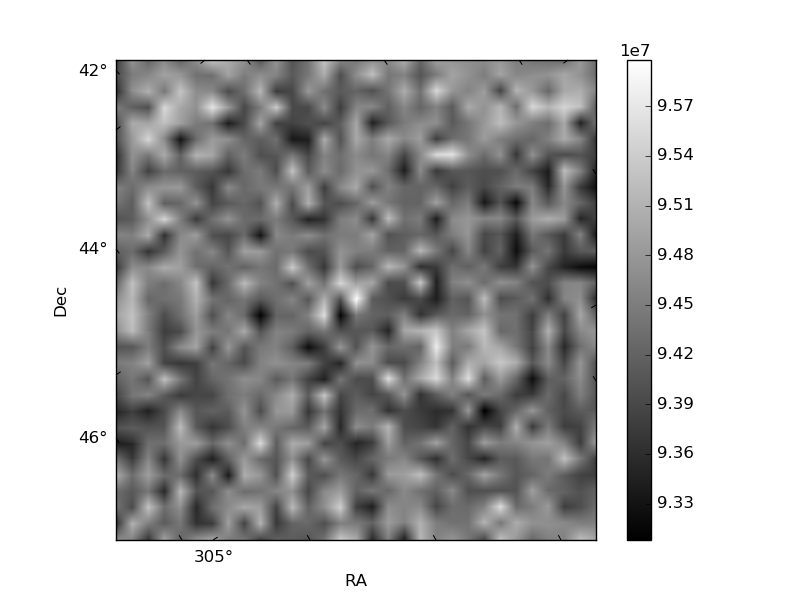
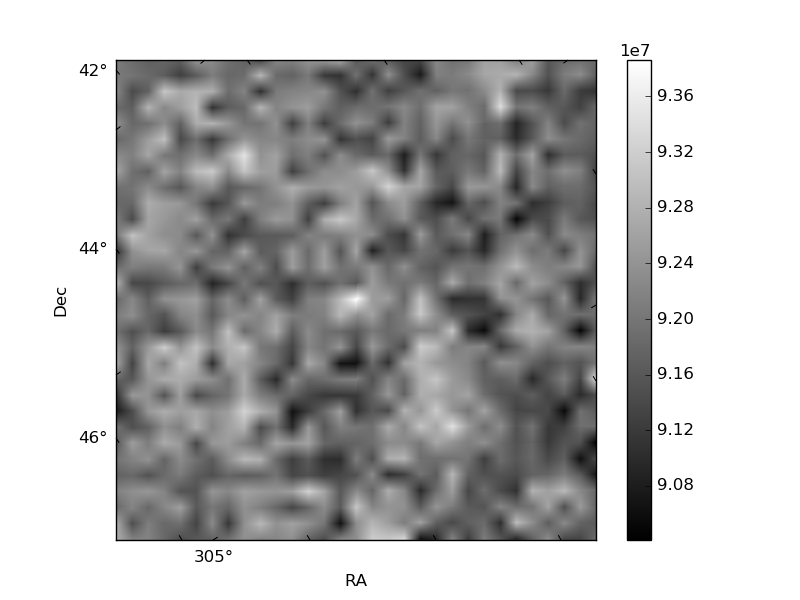
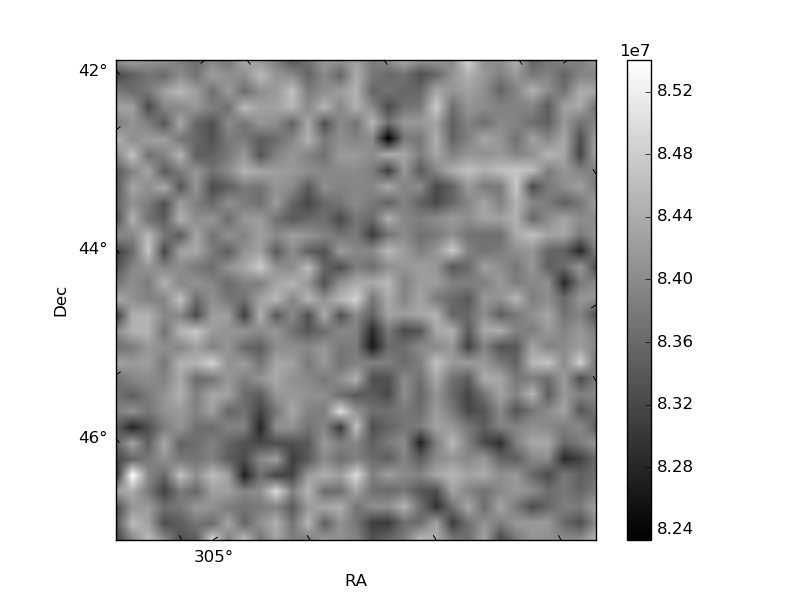
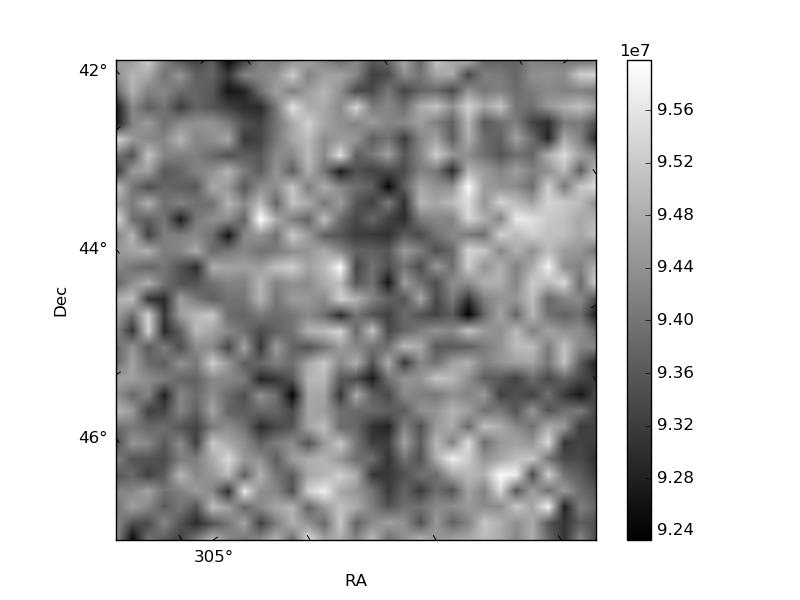
Histogram calculated using DETX and DETY for each event in the final _common_clean file
| Quadrant A | 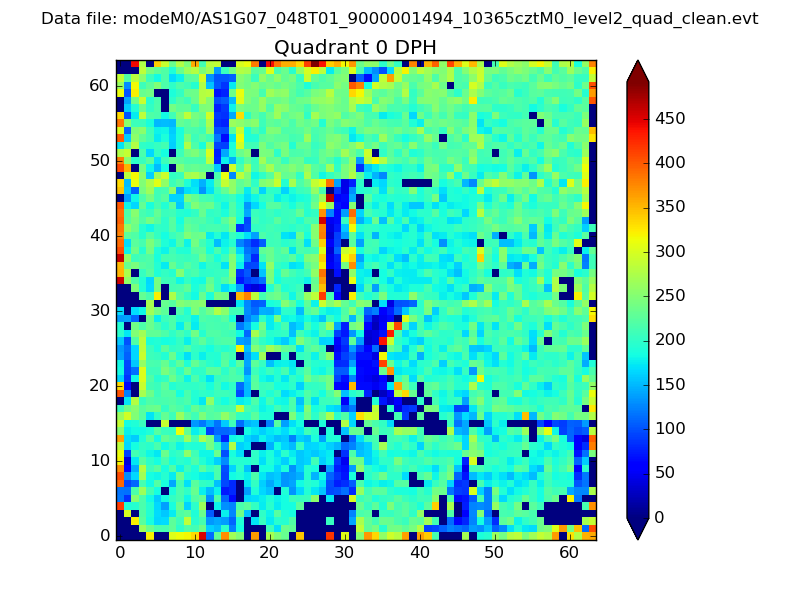 |
 |
Quadrant B |
|---|---|---|---|
| Quadrant D | 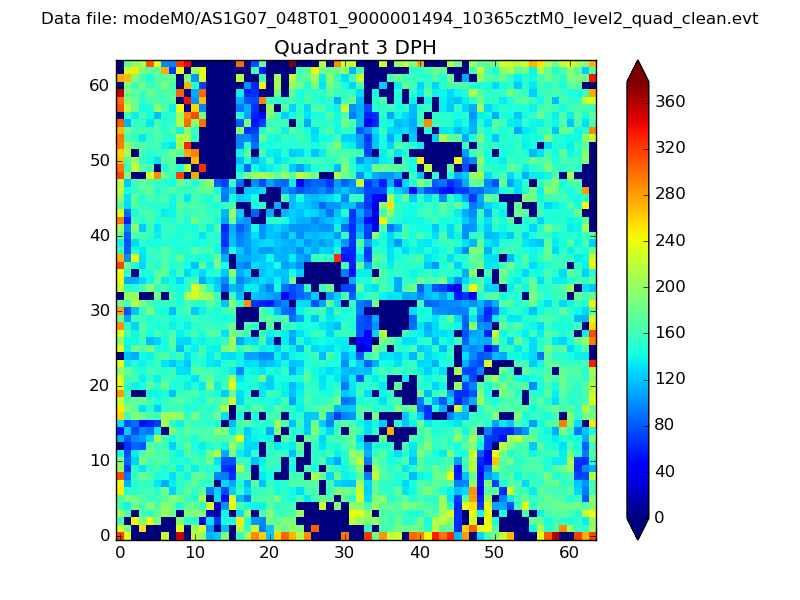 |
 |
Quadrant C |
| Plot type | Count rate plots | Images |
|---|---|---|
| Comparison with Poisson distribution Blue bars denote a histogram of data divided into 1 sec bins. Red curve is a Poisson curve with rate = median count rate of data. |
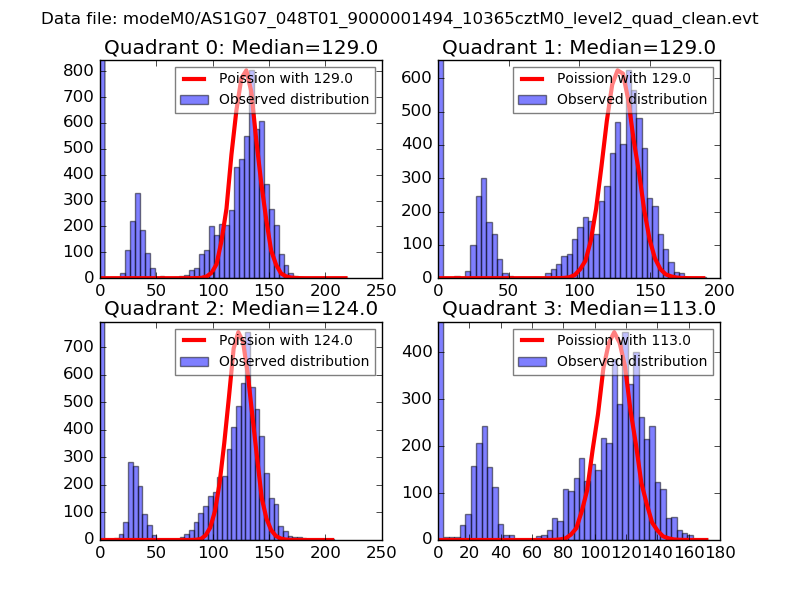 |
 |
| Quadrant-wise count rates Data is divided into 100 sec bins |
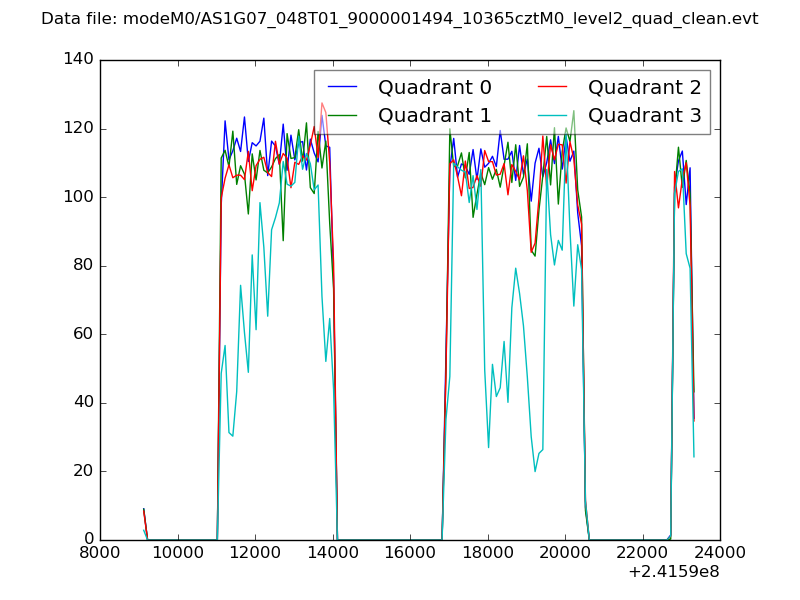 |
|
| Module-wise count rates for Quadrant A Data is divided into 100 sec bins |
 |
 |
| Module-wise count rates for Quadrant B Data is divided into 100 sec bins |
 |
 |
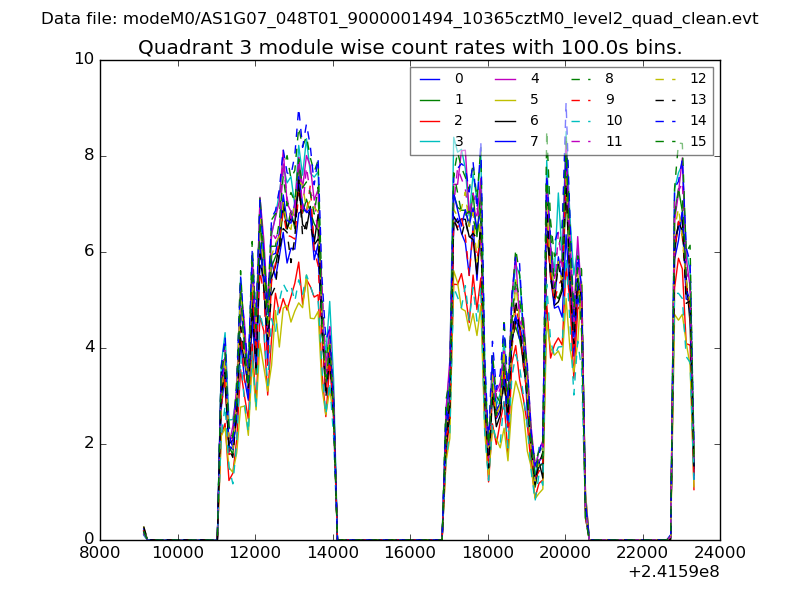
| Module-wise count rates for Quadrant C Data is divided into 100 sec bins |
 |
 |
| Module-wise count rates for Quadrant D Data is divided into 100 sec bins |
 |
 |
| Parameter | Plot |
|---|---|
| CZT HV Monitor | 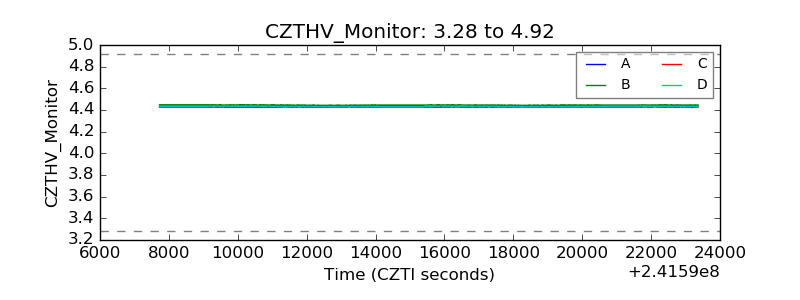 |
| D_VDD | 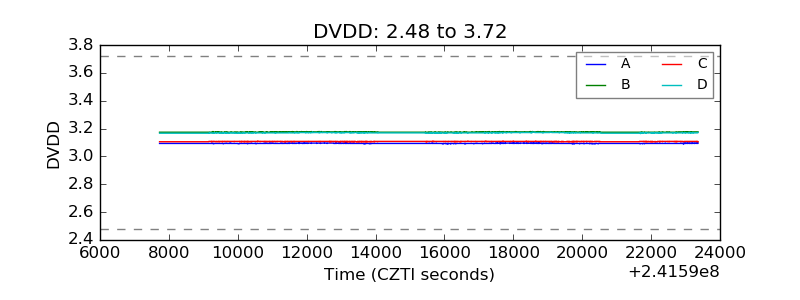 |
| Temperature 1 | 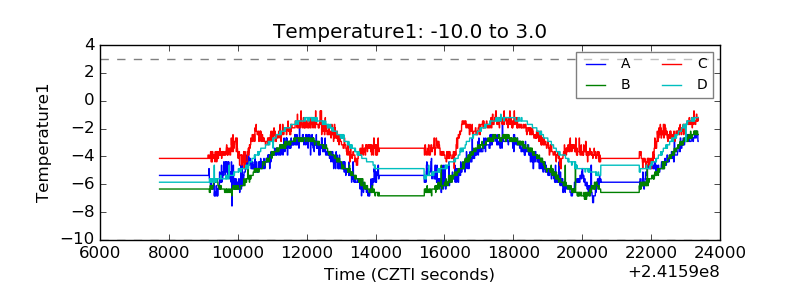 |
| Veto HV Monitor | 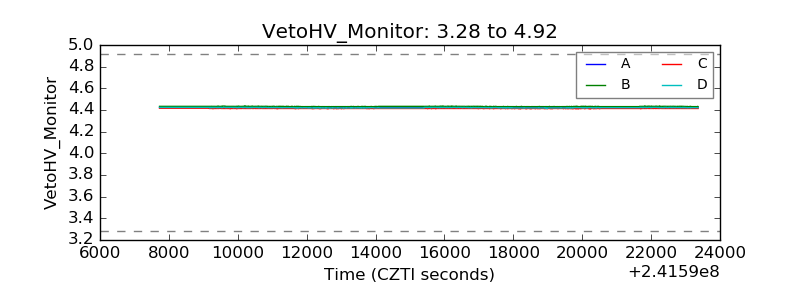 |
| Veto LLD | 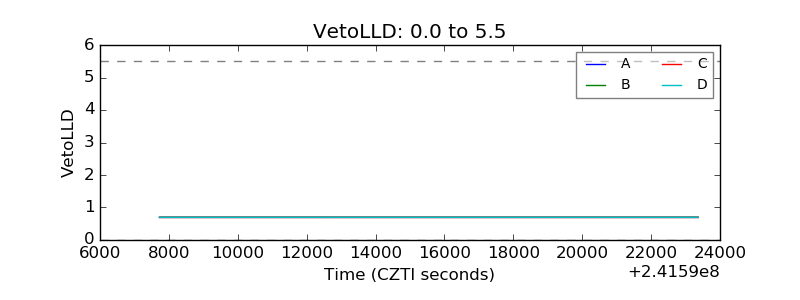 |
| Alpha Counter | 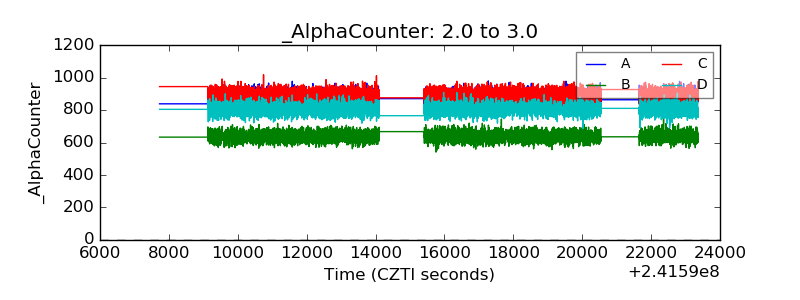 |
| _CPM_Rate | 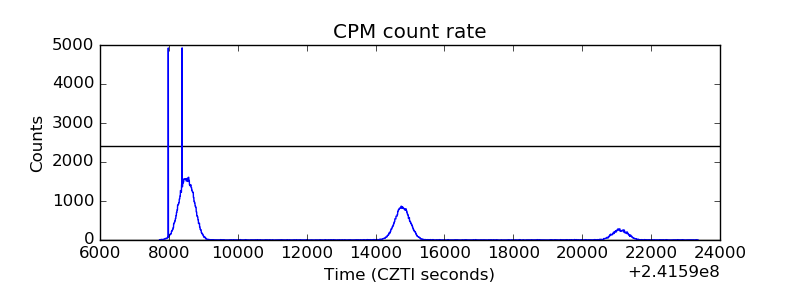 |
| CZT Counter | 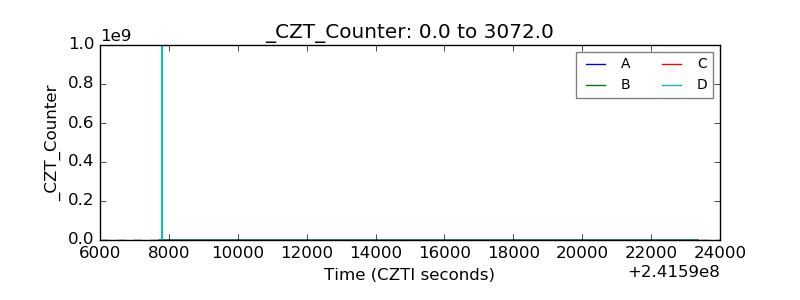 |
| +2.5 Volts monitor |  |
| +5 Volts monitor |  |
| _ROLL_ROT | 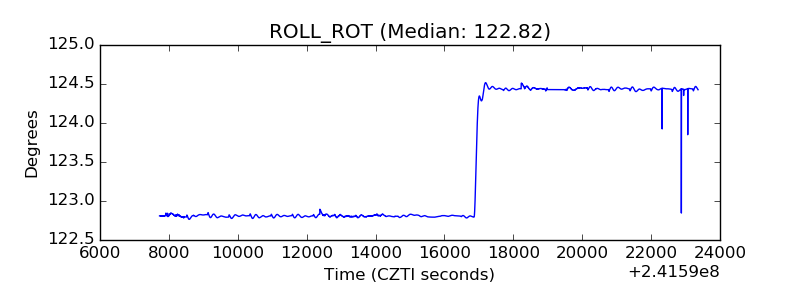 |
| _Roll_DEC | 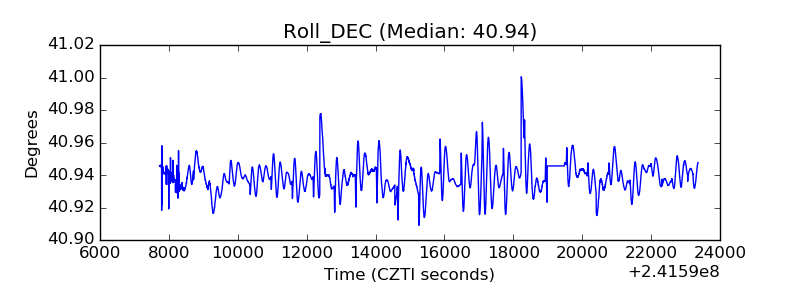 |
| _Roll_RA | 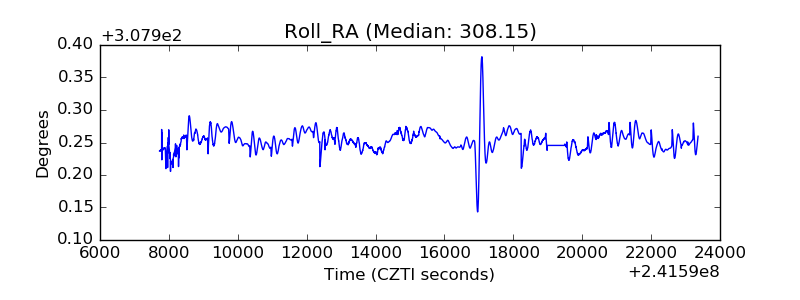 |
| Veto Counter |  |