| Param | Original file | Final file |
|---|---|---|
| Filename | modeM0/AS1G07_048T01_9000001494_10366cztM0_level2.evt | modeM0/AS1G07_048T01_9000001494_10366cztM0_level2_quad_clean.evt |
| Size (bytes) | 555,557,760 | 91,532,160 |
| Size | 529.8 MB | 87.3 MB |
| Events in quadrant A | 3,373,051 | 586,173 |
| Events in quadrant B | 3,737,117 | 586,509 |
| Events in quadrant C | 3,267,953 | 570,359 |
| Events in quadrant D | 5,965,798 | 534,694 |
| Mode M0 | |||
|---|---|---|---|
| Quadrant | BADHDUFLAG | Total packets | Discarded packets |
| A | 0 | 14581 | 3 |
| B | 0 | 15555 | 2 |
| C | 0 | 14594 | 4 |
| D | 0 | 22714 | 5 |
| Mode M9 | |||
|---|---|---|---|
| Quadrant | BADHDUFLAG | Total packets | Discarded packets |
| A | 0 | 13 | 0 |
| B | 0 | 13 | 0 |
| C | 0 | 13 | 0 |
| D | 0 | 14 | 0 |
| Mode SS | |||
|---|---|---|---|
| Quadrant | BADHDUFLAG | Total packets | Discarded packets |
| A | 0 | 144 | 0 |
| B | 0 | 144 | 0 |
| C | 0 | 144 | 0 |
| D | 0 | 144 | 0 |
| Quadrant | Total seconds | Saturated seconds | Saturation percentage |
|---|---|---|---|
| A | 7096 | 155 | 2.184329% |
| B | 7096 | 210 | 2.959414% |
| C | 7095 | 113 | 1.592671% |
| D | 7095 | 212 | 2.988020% |
Noise dominated data is calculated using 1-second bins in cleaned event files. If a bin has >2000 counts, and if more than 50% of those come from <1% of pixels, then it is considered to be noise-dominated and hence unusable.
| Quadrant | # 1 sec bins | Bins with >0 counts | Bins with >2000 counts | High rate bins dominated by noise | Noise dominated (total time) | Noise dominated (detector-on time) | Marked lightcurve |
|---|---|---|---|---|---|---|---|
| A | 7801 | 7096 | 0 | 0 | 0.00% | 0.00% | 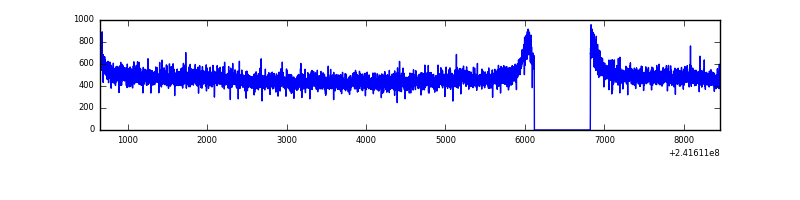 |
| B | 7801 | 7096 | 33 | 33 | 0.42% | 0.47% | 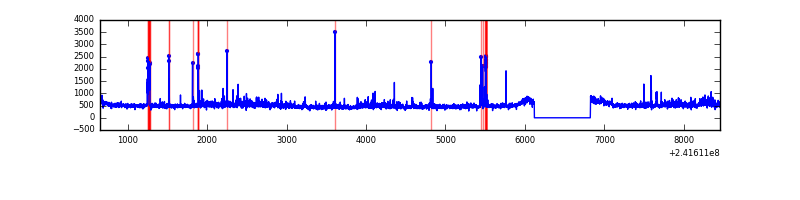 |
| C | 7801 | 7096 | 3 | 3 | 0.04% | 0.04% | 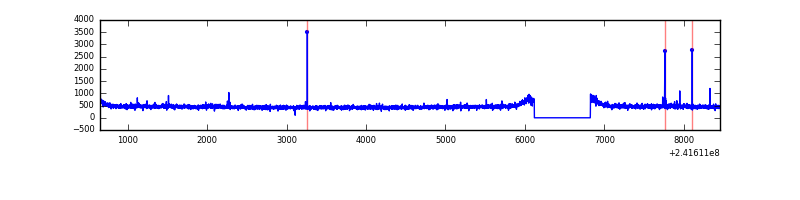 |
| D | 7801 | 7096 | 99 | 99 | 1.27% | 1.40% | 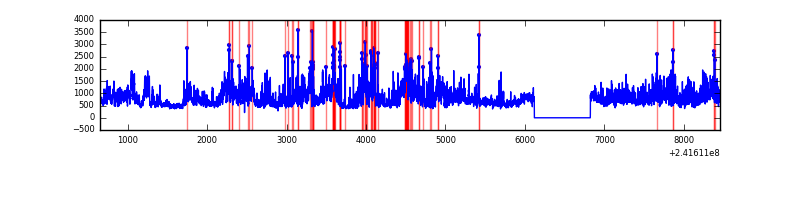 |
Top three noisy pixels from each quadrant. If the there are fewer than three noisy pixels in the level2.evt file, extra rows are filled as -1
| Pixel properties | Quadrant properties | ||||||
|---|---|---|---|---|---|---|---|
| Quadrant | DetID | PixID | Counts | Sigma | Mean | Median | Sigma |
| A | 8 | 15 | 49402 | 278.3 | 862 | 845 | 174.5 |
| A | 0 | 226 | 7970 | 40.84 | 862 | 845 | 174.5 |
| A | 12 | 194 | 7194 | 36.39 | 862 | 845 | 174.5 |
| B | 0 | 214 | 184782 | 1130.84 | 856 | 836 | 162.7 |
| B | 4 | 239 | 88507 | 538.97 | 856 | 836 | 162.7 |
| B | 11 | 51 | 75173 | 457.0 | 856 | 836 | 162.7 |
| C | 14 | 234 | 27108 | 137.01 | 830 | 834 | 191.8 |
| C | 13 | 61 | 6201 | 27.99 | 830 | 834 | 191.8 |
| C | 12 | 4 | 2542 | 8.91 | 830 | 834 | 191.8 |
| D | 1 | 20 | 1672805 | 8570.31 | 822 | 800 | 195.1 |
| D | 5 | 222 | 815908 | 4178.06 | 822 | 800 | 195.1 |
| D | 1 | 52 | 135261 | 689.22 | 822 | 800 | 195.1 |
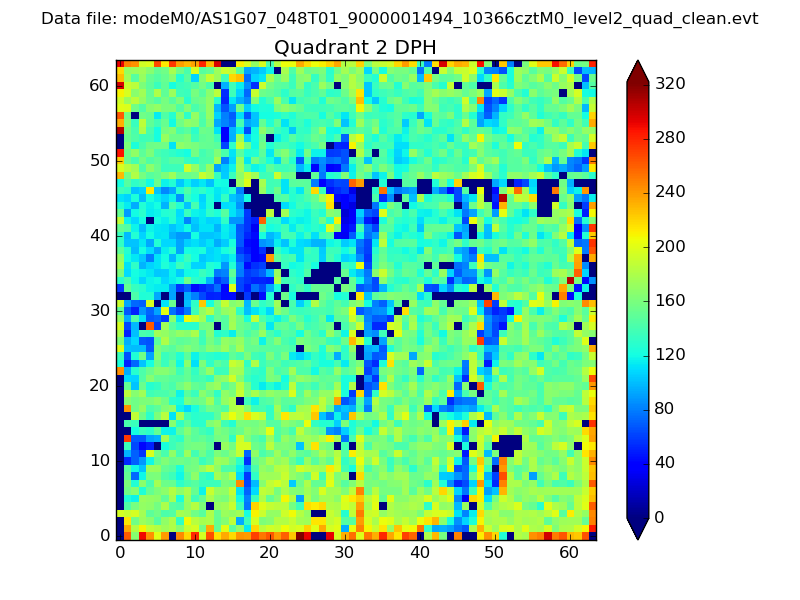
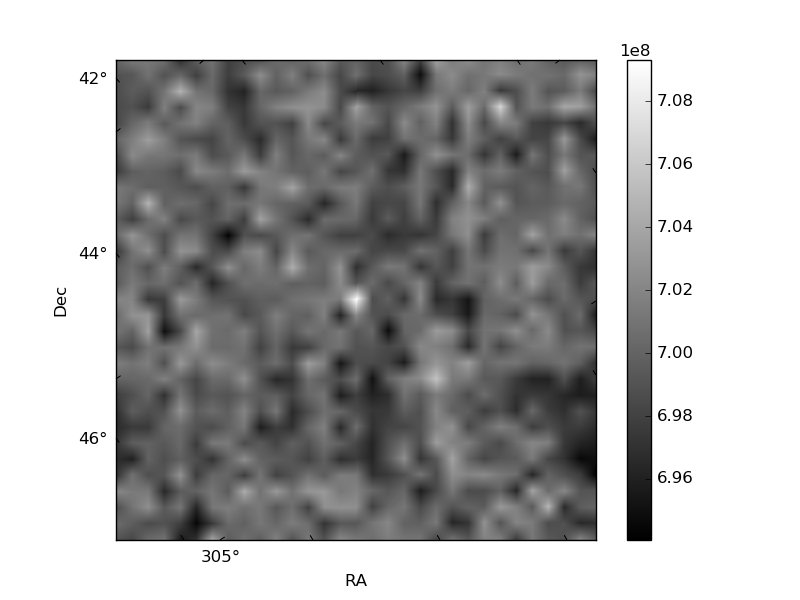
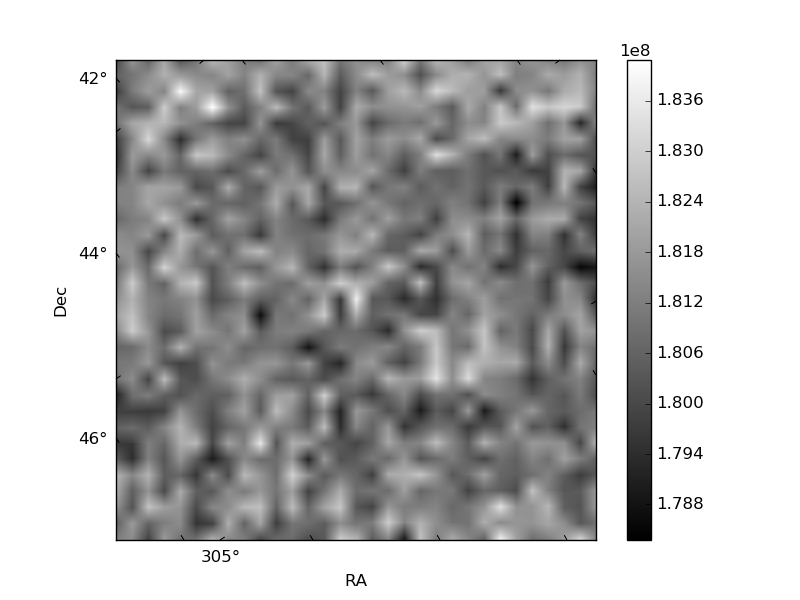
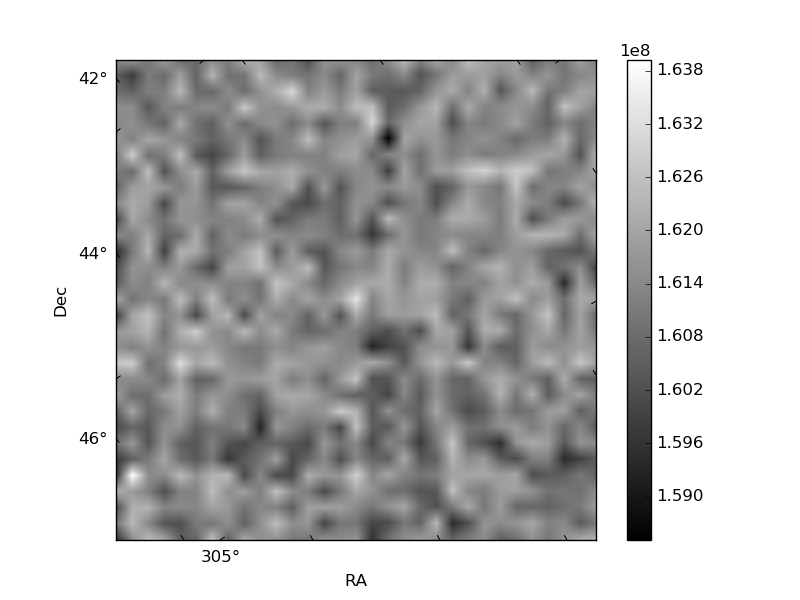
Histogram calculated using DETX and DETY for each event in the final _common_clean file
| Quadrant A | 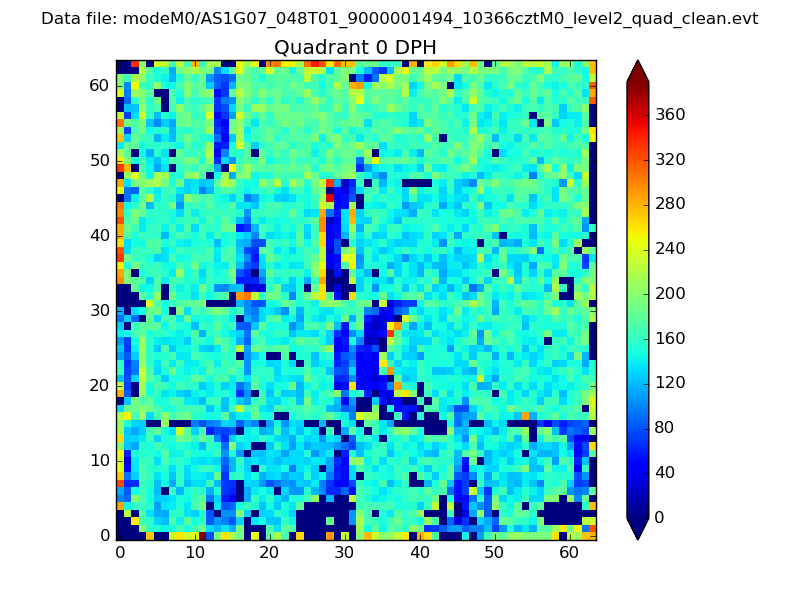 |
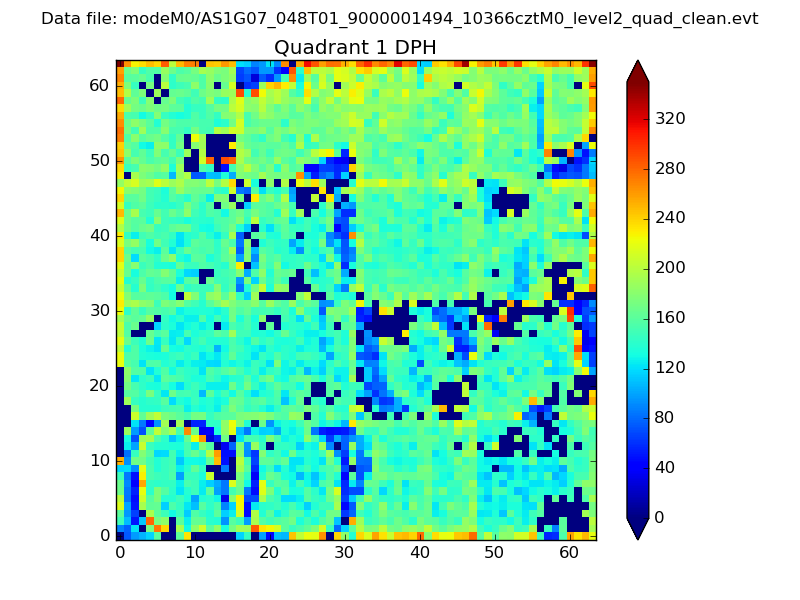 |
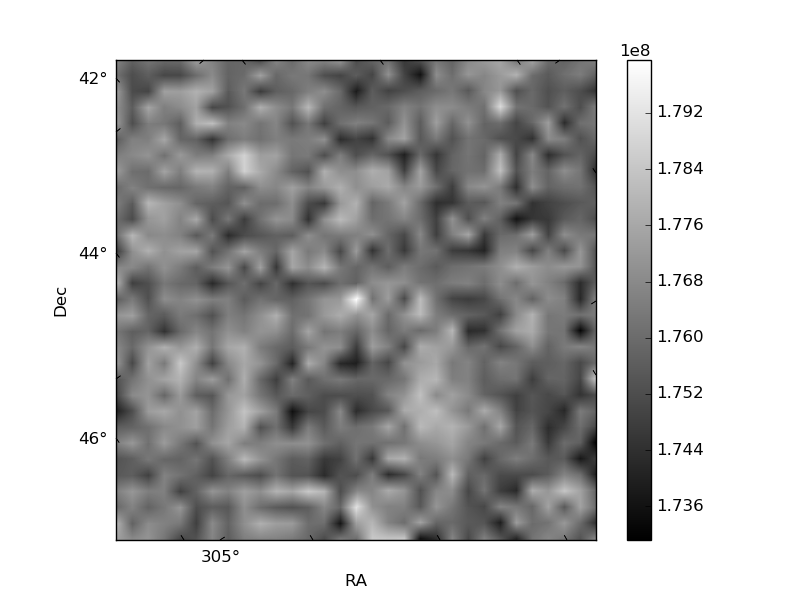
Quadrant B |
|---|---|---|---|
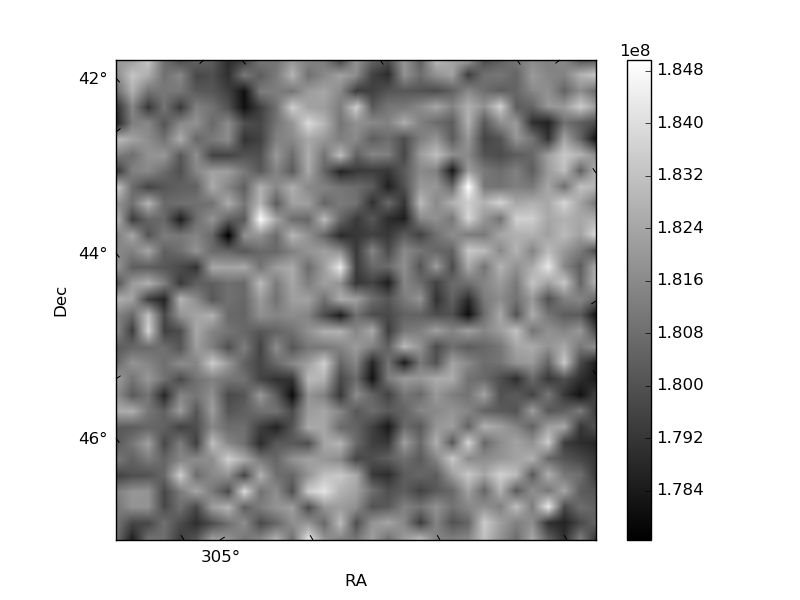
| Quadrant D | 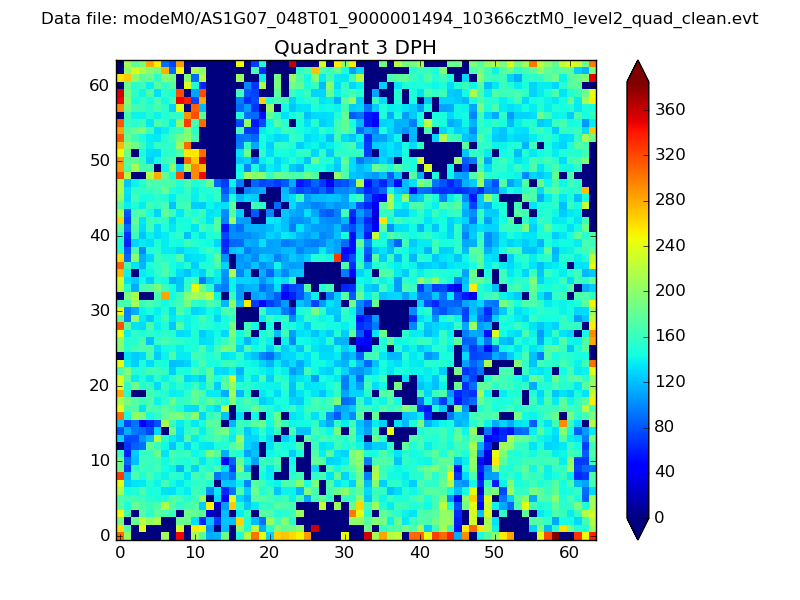 |
 |
Quadrant C |
| Plot type | Count rate plots | Images |
|---|---|---|
| Comparison with Poisson distribution Blue bars denote a histogram of data divided into 1 sec bins. Red curve is a Poisson curve with rate = median count rate of data. |
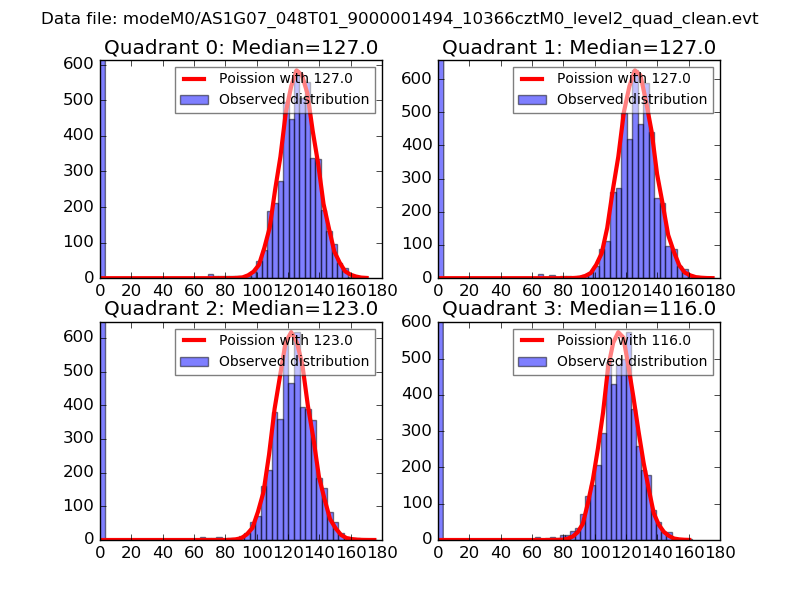 |
 |
| Quadrant-wise count rates Data is divided into 100 sec bins |
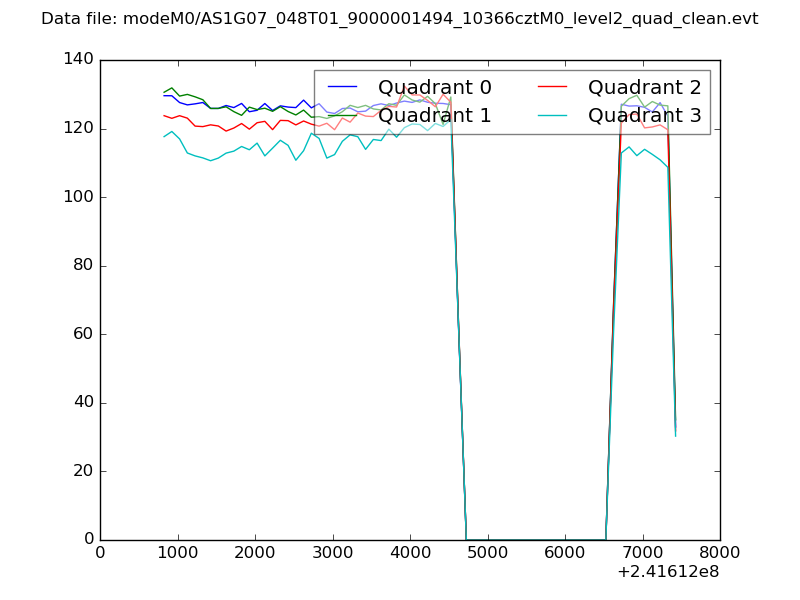 |
|
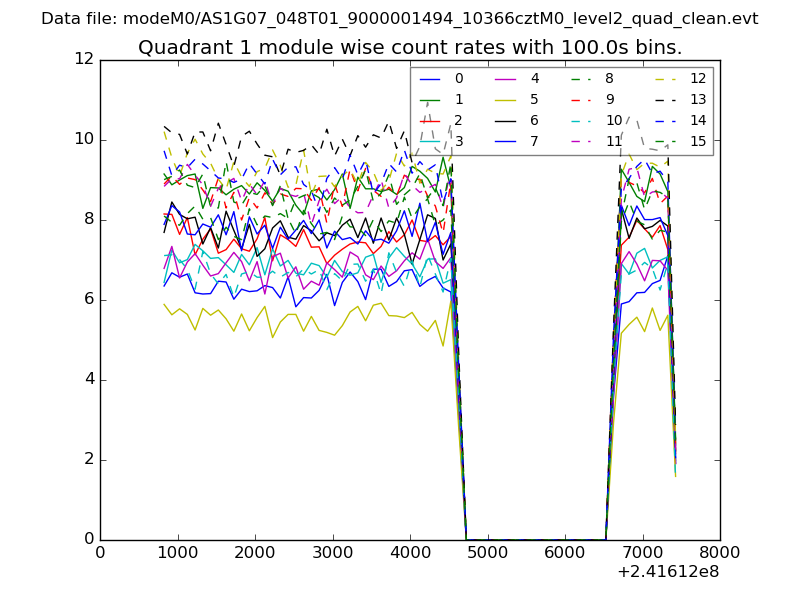
| Module-wise count rates for Quadrant A Data is divided into 100 sec bins |
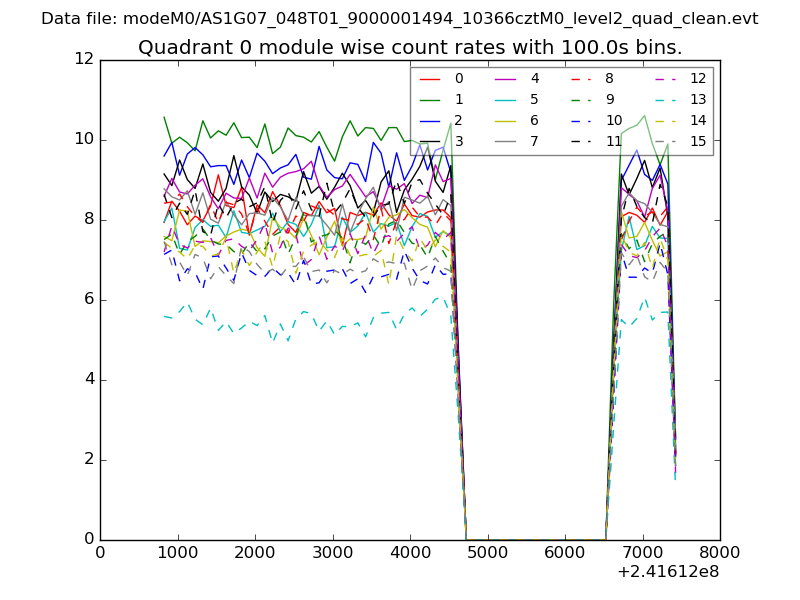 |
 |
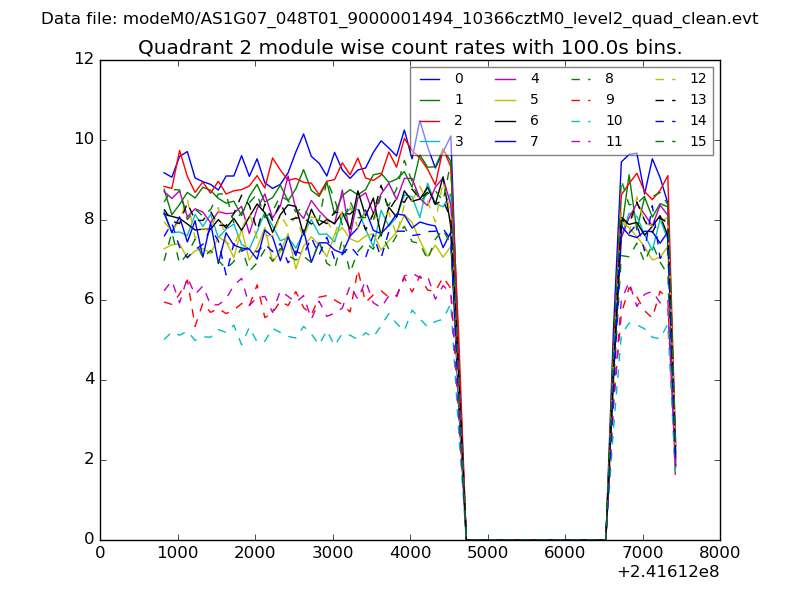
| Module-wise count rates for Quadrant B Data is divided into 100 sec bins |
 |
 |
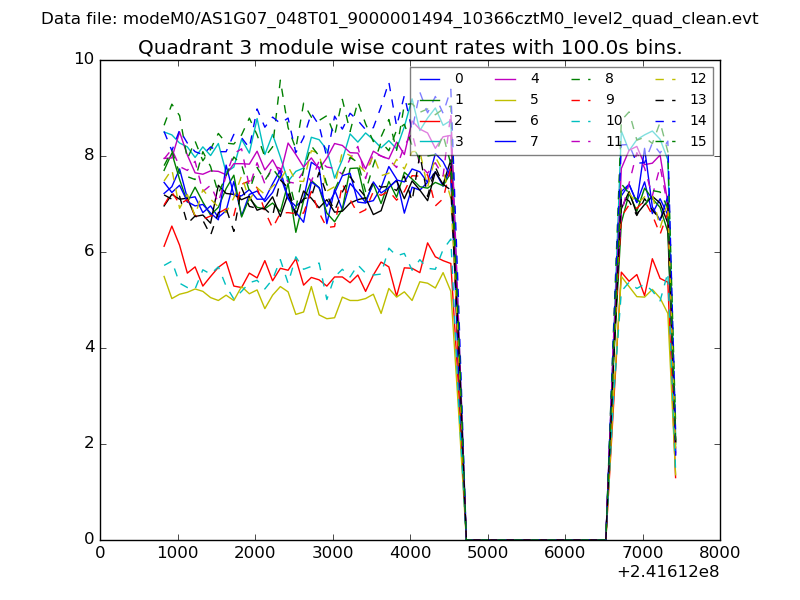
| Module-wise count rates for Quadrant C Data is divided into 100 sec bins |
 |
 |
| Module-wise count rates for Quadrant D Data is divided into 100 sec bins |
 |
 |
| Parameter | Plot |
|---|---|
| CZT HV Monitor | 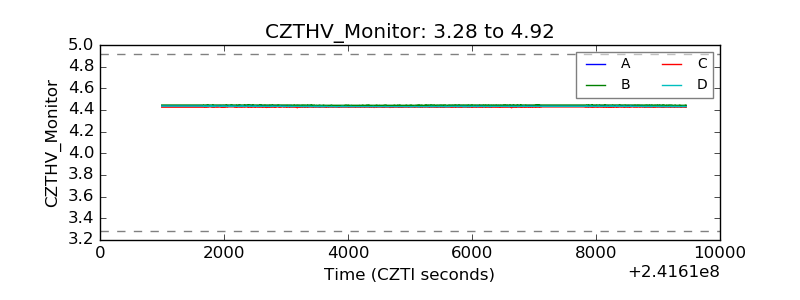 |
| D_VDD | 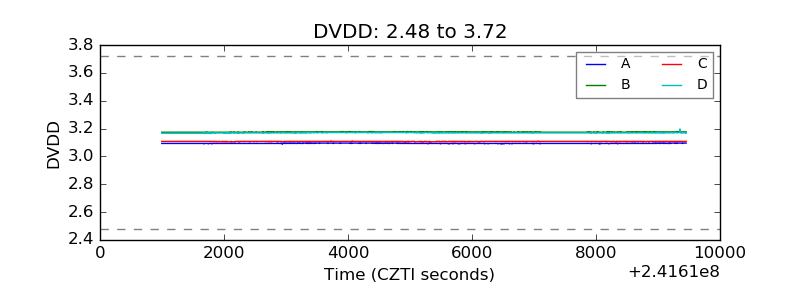 |
| Temperature 1 | 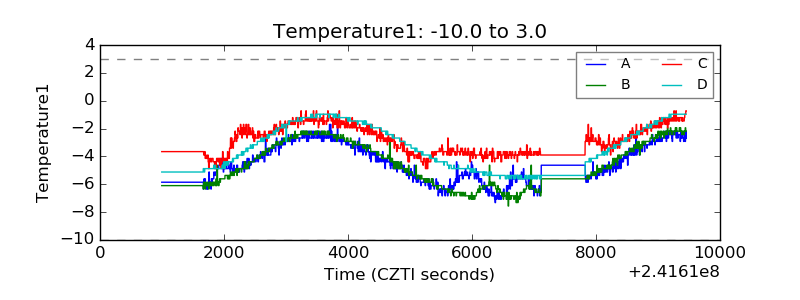 |
| Veto HV Monitor | 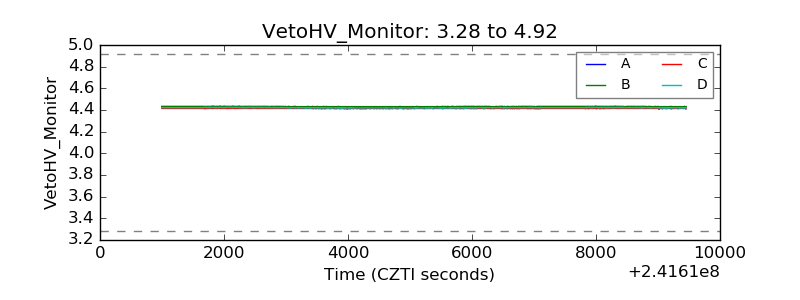 |
| Veto LLD | 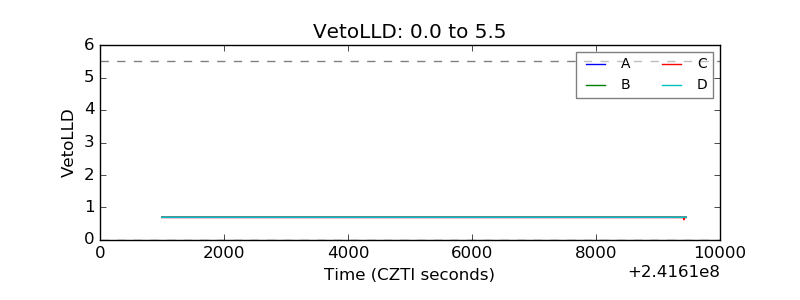 |
| Alpha Counter | 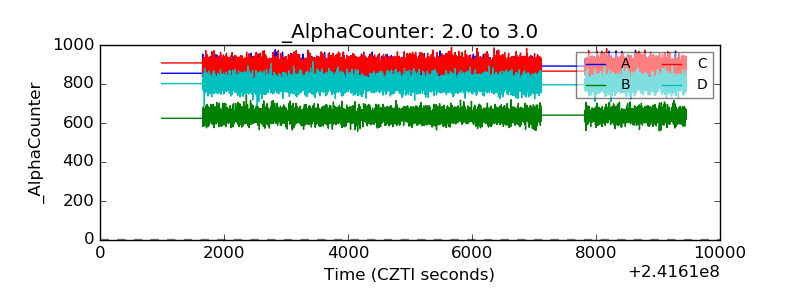 |
| _CPM_Rate | 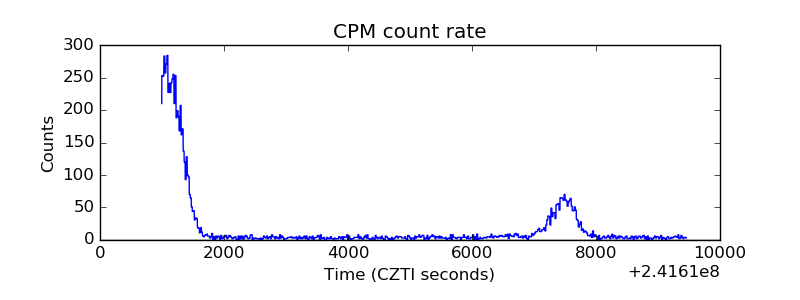 |
| CZT Counter | 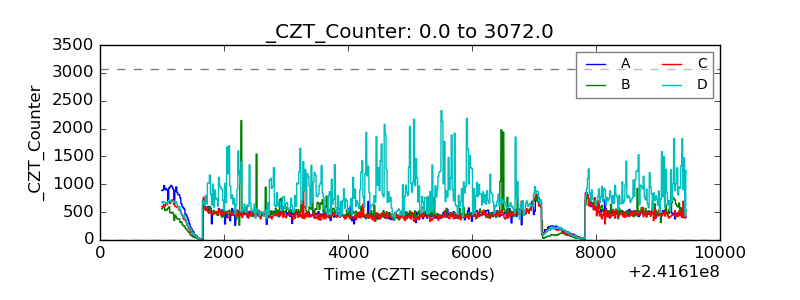 |
| +2.5 Volts monitor |  |
| +5 Volts monitor |  |
| _ROLL_ROT | 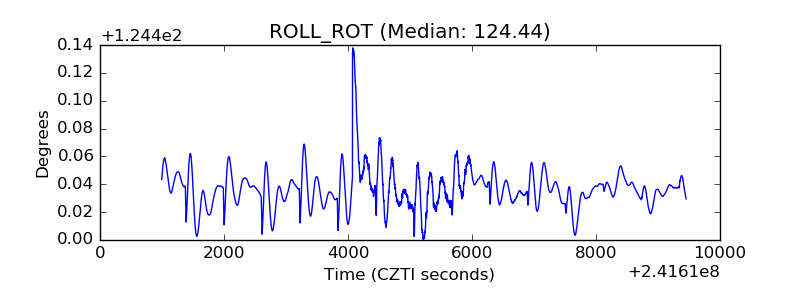 |
| _Roll_DEC | 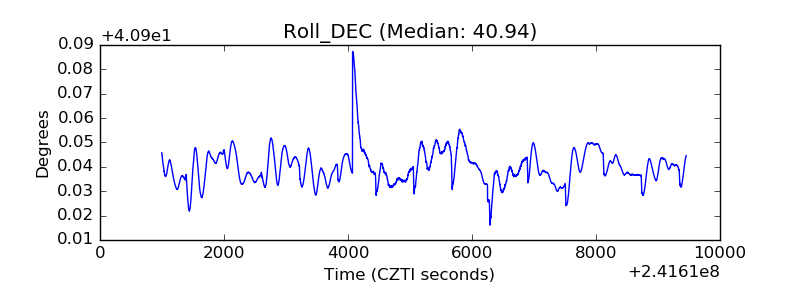 |
| _Roll_RA | 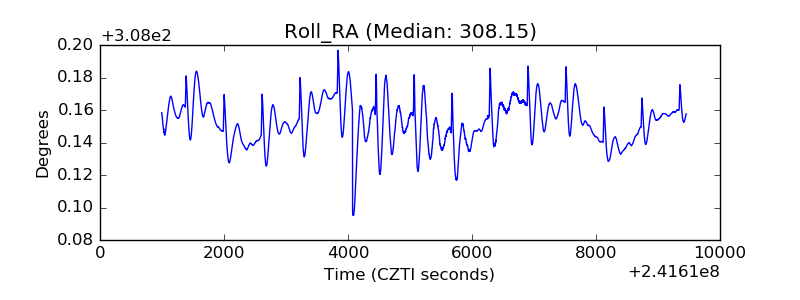 |
| Veto Counter | 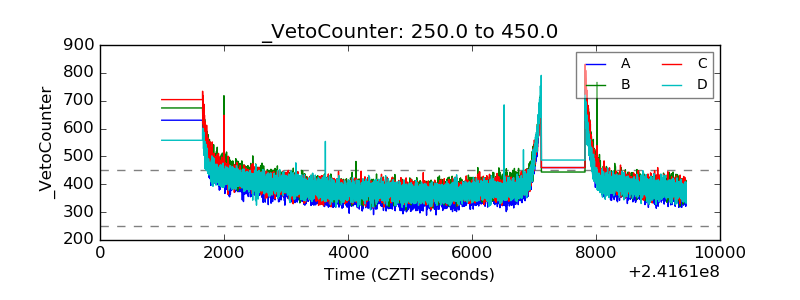 |