| Param | Original file | Final file |
|---|---|---|
| Filename | modeM0/AS1G07_048T01_9000001494_10367cztM0_level2.evt | modeM0/AS1G07_048T01_9000001494_10367cztM0_level2_quad_clean.evt |
| Size (bytes) | 408,686,400 | 68,192,640 |
| Size | 389.8 MB | 65.0 MB |
| Events in quadrant A | 2,727,948 | 457,127 |
| Events in quadrant B | 2,806,550 | 443,698 |
| Events in quadrant C | 2,647,728 | 441,936 |
| Events in quadrant D | 3,815,064 | 332,505 |
| Mode M0 | |||
|---|---|---|---|
| Quadrant | BADHDUFLAG | Total packets | Discarded packets |
| A | 0 | 28530 | 16573 |
| B | 0 | 32034 | 20135 |
| C | 0 | 29898 | 18024 |
| D | 0 | 47929 | 33238 |
| Mode M9 | |||
|---|---|---|---|
| Quadrant | BADHDUFLAG | Total packets | Discarded packets |
| A | 0 | 6 | 3 |
| B | 0 | 6 | 3 |
| C | 0 | 6 | 3 |
| D | 0 | 5 | 2 |
| Mode SS | |||
|---|---|---|---|
| Quadrant | BADHDUFLAG | Total packets | Discarded packets |
| A | 0 | 291 | 177 |
| B | 0 | 292 | 166 |
| C | 0 | 292 | 178 |
| D | 0 | 282 | 154 |
| Quadrant | Total seconds | Saturated seconds | Saturation percentage |
|---|---|---|---|
| A | 5833 | 103 | 1.765815% |
| B | 5584 | 83 | 1.486390% |
| C | 5775 | 75 | 1.298701% |
| D | 5035 | 105 | 2.085402% |
Noise dominated data is calculated using 1-second bins in cleaned event files. If a bin has >2000 counts, and if more than 50% of those come from <1% of pixels, then it is considered to be noise-dominated and hence unusable.
| Quadrant | # 1 sec bins | Bins with >0 counts | Bins with >2000 counts | High rate bins dominated by noise | Noise dominated (total time) | Noise dominated (detector-on time) | Marked lightcurve |
|---|---|---|---|---|---|---|---|
| A | 7693 | 7007 | 0 | 0 | 0.00% | 0.00% | 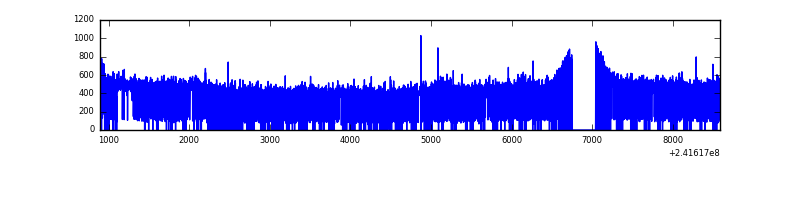 |
| B | 7693 | 6784 | 2 | 2 | 0.03% | 0.03% | 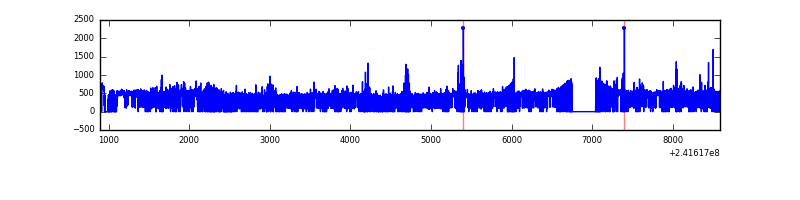 |
| C | 7691 | 6945 | 0 | 0 | 0.00% | 0.00% | 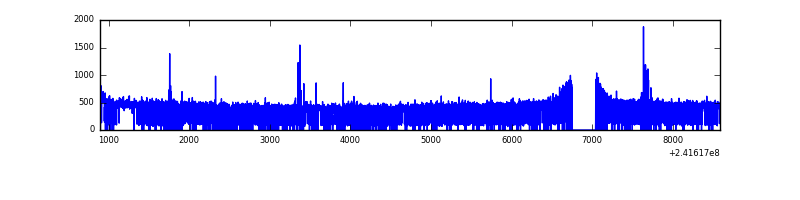 |
| D | 7693 | 6072 | 8 | 8 | 0.10% | 0.13% | 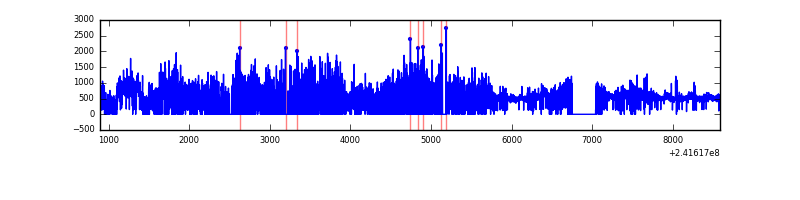 |
Top three noisy pixels from each quadrant. If the there are fewer than three noisy pixels in the level2.evt file, extra rows are filled as -1
| Pixel properties | Quadrant properties | ||||||
|---|---|---|---|---|---|---|---|
| Quadrant | DetID | PixID | Counts | Sigma | Mean | Median | Sigma |
| A | 8 | 15 | 31412 | 212.61 | 699 | 682 | 144.5 |
| A | 0 | 226 | 6590 | 40.88 | 699 | 682 | 144.5 |
| A | 12 | 194 | 5699 | 34.71 | 699 | 682 | 144.5 |
| B | 0 | 214 | 73251 | 562.64 | 667 | 651 | 129.0 |
| B | 4 | 239 | 60949 | 467.3 | 667 | 651 | 129.0 |
| B | 11 | 51 | 49071 | 375.25 | 667 | 651 | 129.0 |
| C | 14 | 234 | 30589 | 192.03 | 670 | 671 | 155.8 |
| C | 13 | 61 | 5041 | 28.05 | 670 | 671 | 155.8 |
| C | 5 | 33 | 2537 | 11.98 | 670 | 671 | 155.8 |
| D | 1 | 20 | 637503 | 4506.91 | 586 | 568 | 141.3 |
| D | 5 | 222 | 604011 | 4269.92 | 586 | 568 | 141.3 |
| D | 8 | 195 | 197437 | 1393.03 | 586 | 568 | 141.3 |
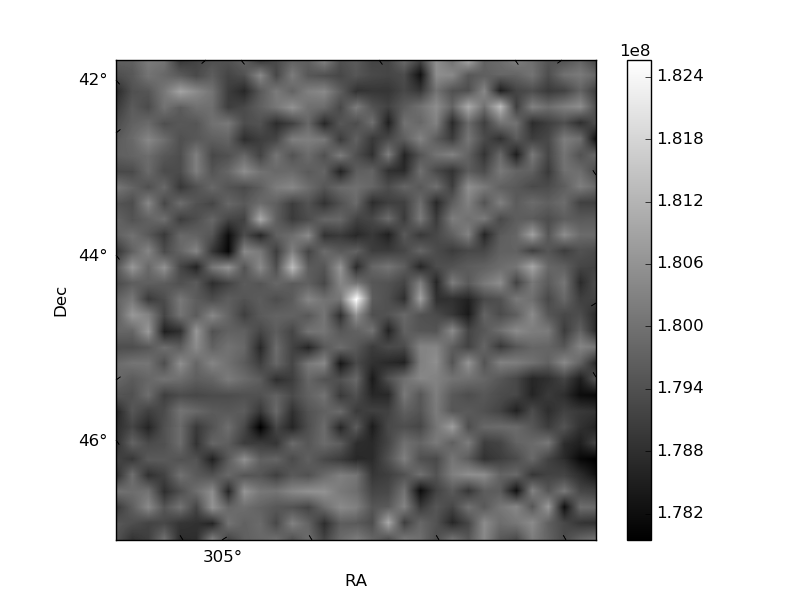
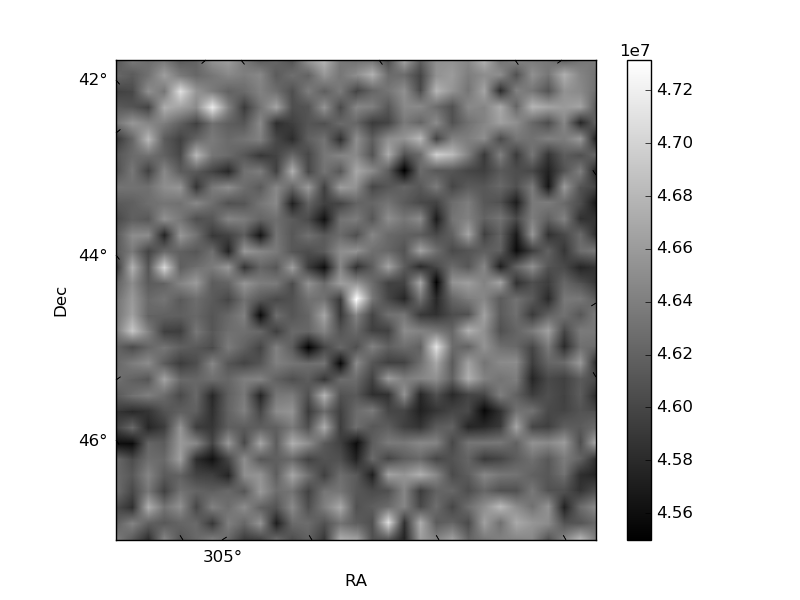
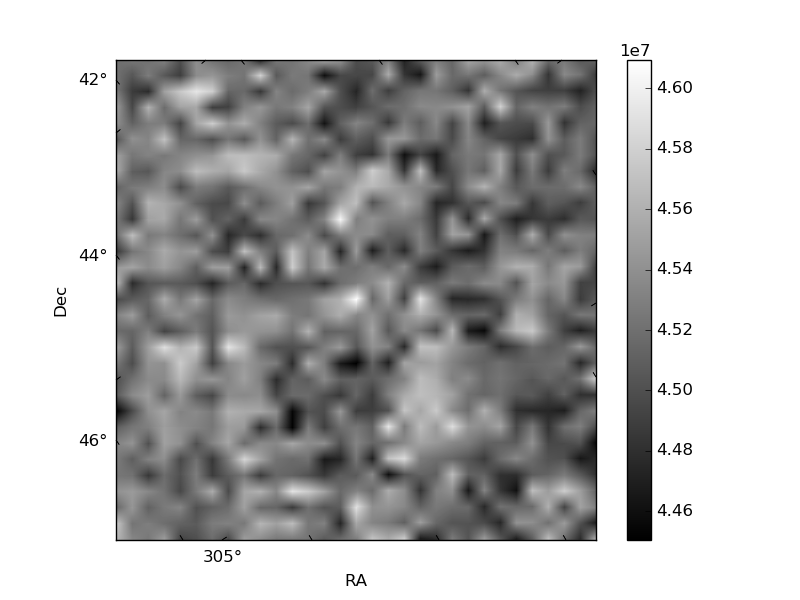
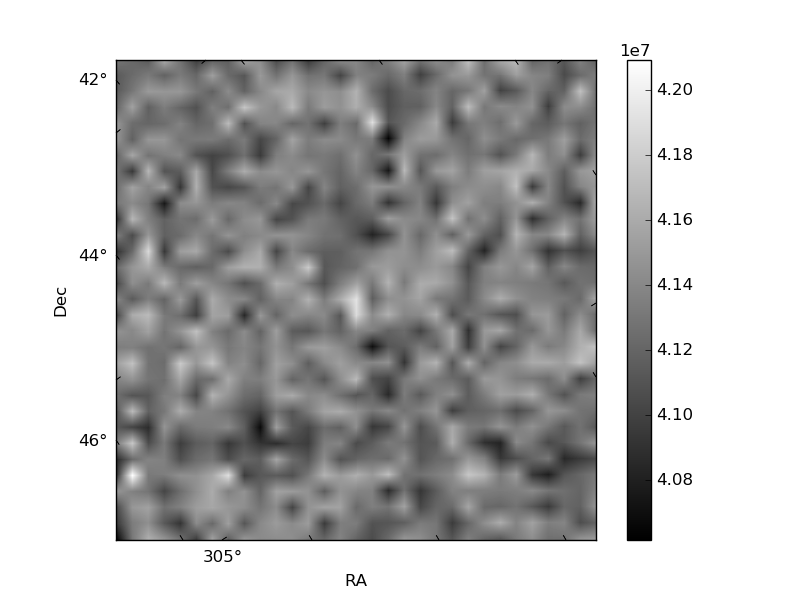
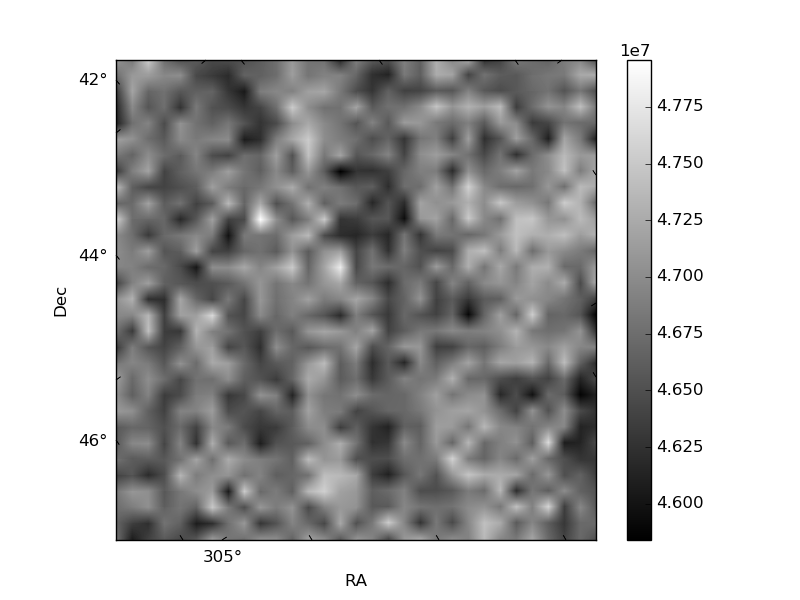
Histogram calculated using DETX and DETY for each event in the final _common_clean file
| Quadrant A | 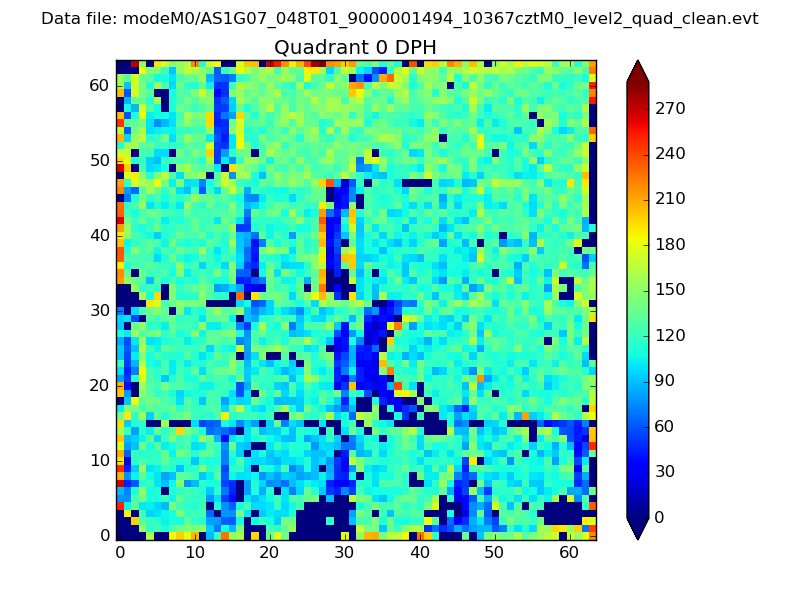 |
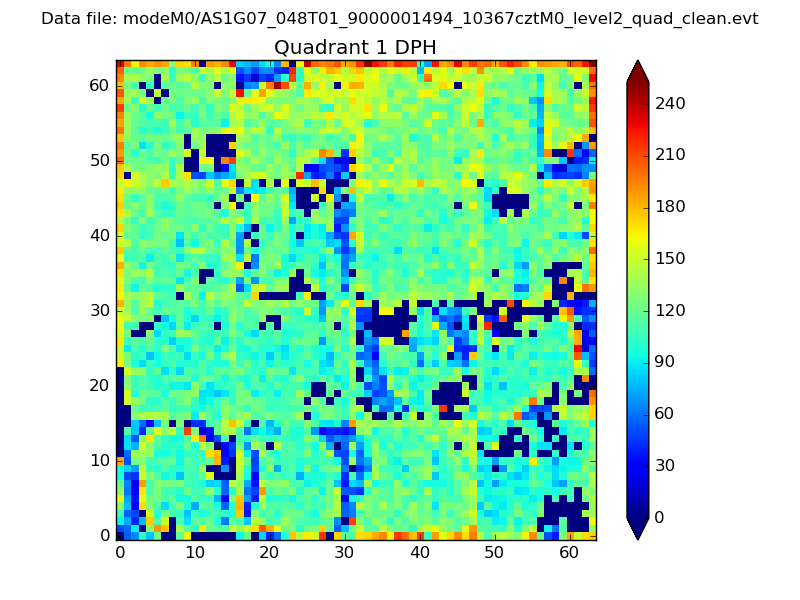 |
Quadrant B |
|---|---|---|---|
| Quadrant D | 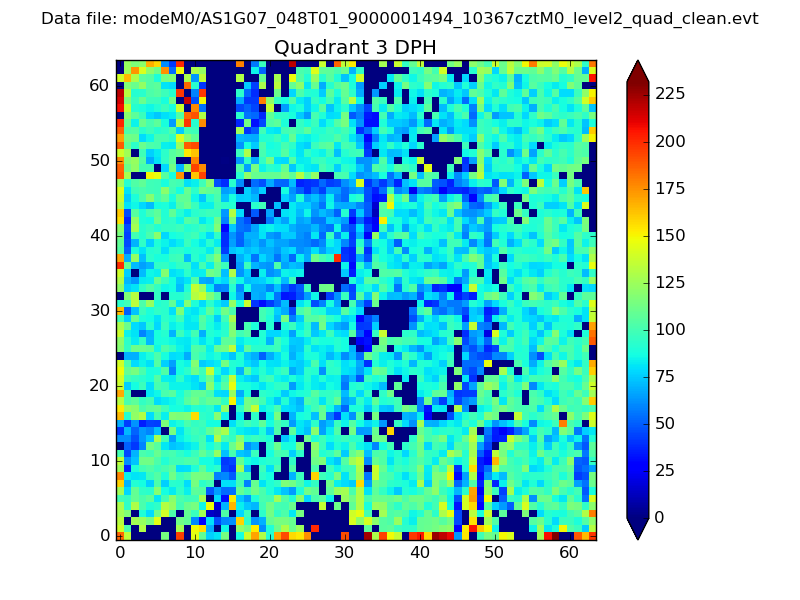 |
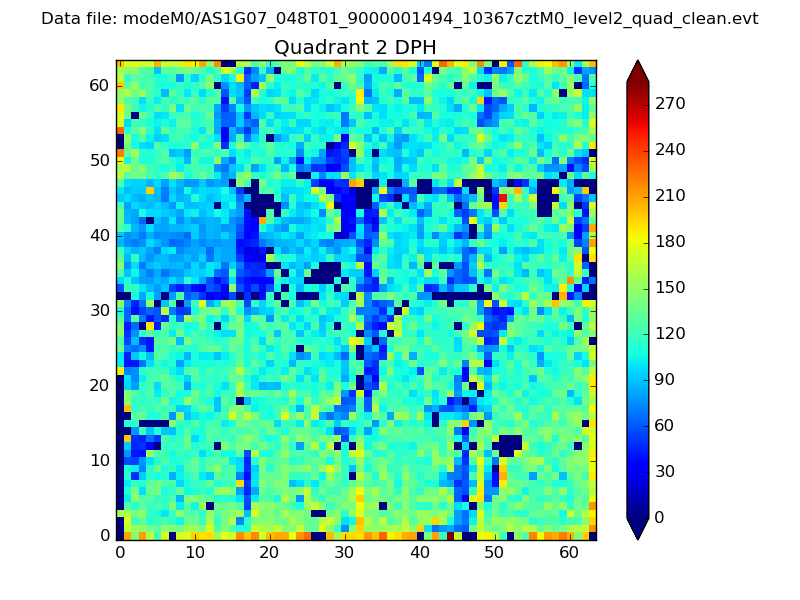 |
Quadrant C |
| Plot type | Count rate plots | Images |
|---|---|---|
| Comparison with Poisson distribution Blue bars denote a histogram of data divided into 1 sec bins. Red curve is a Poisson curve with rate = median count rate of data. |
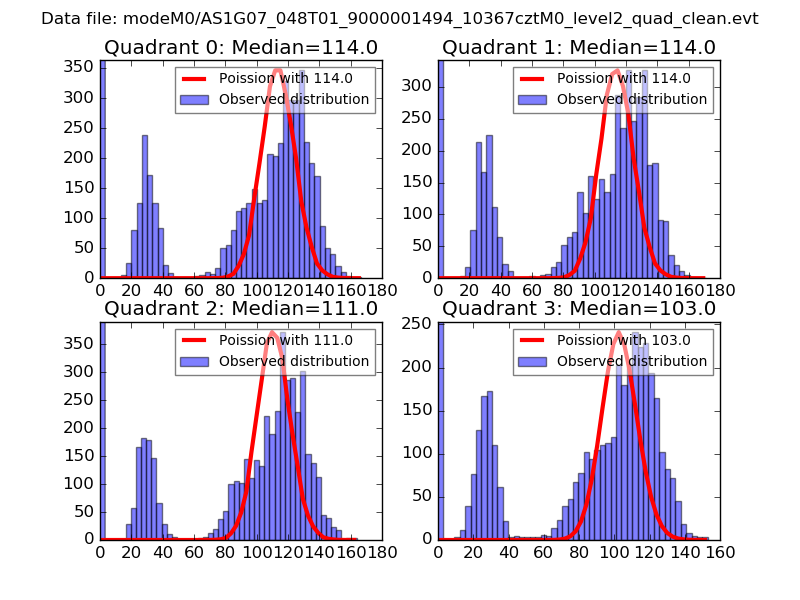 |
 |
| Quadrant-wise count rates Data is divided into 100 sec bins |
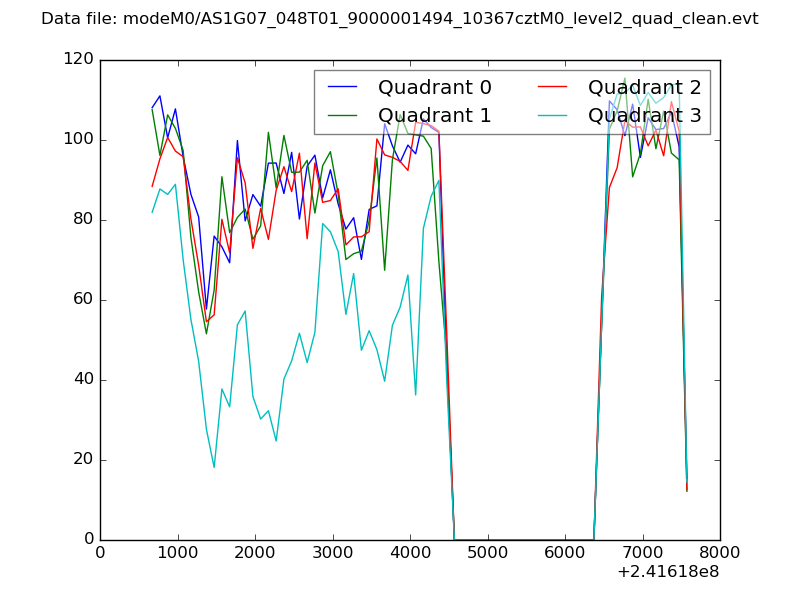 |
|
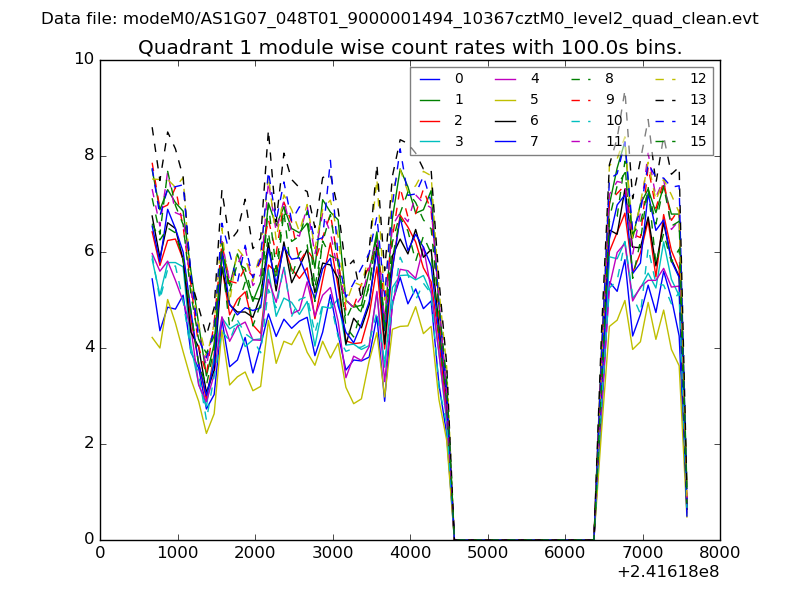
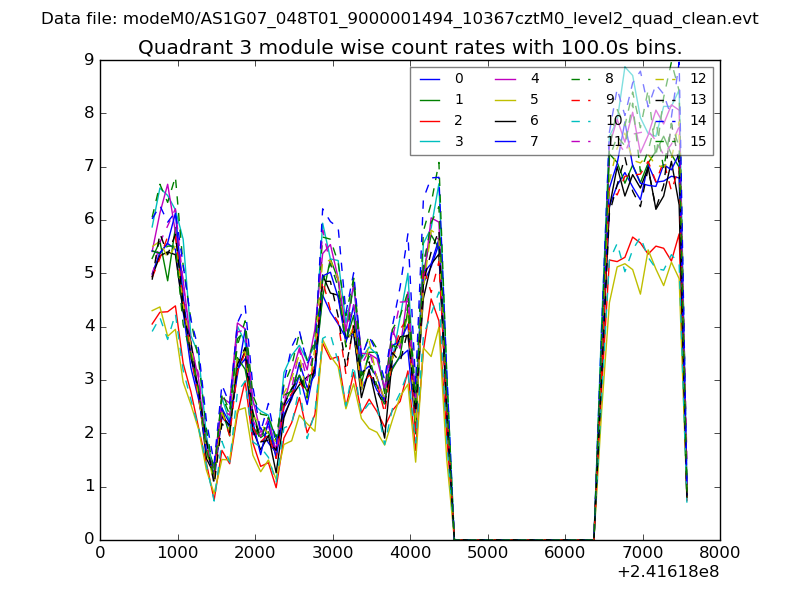
| Module-wise count rates for Quadrant A Data is divided into 100 sec bins |
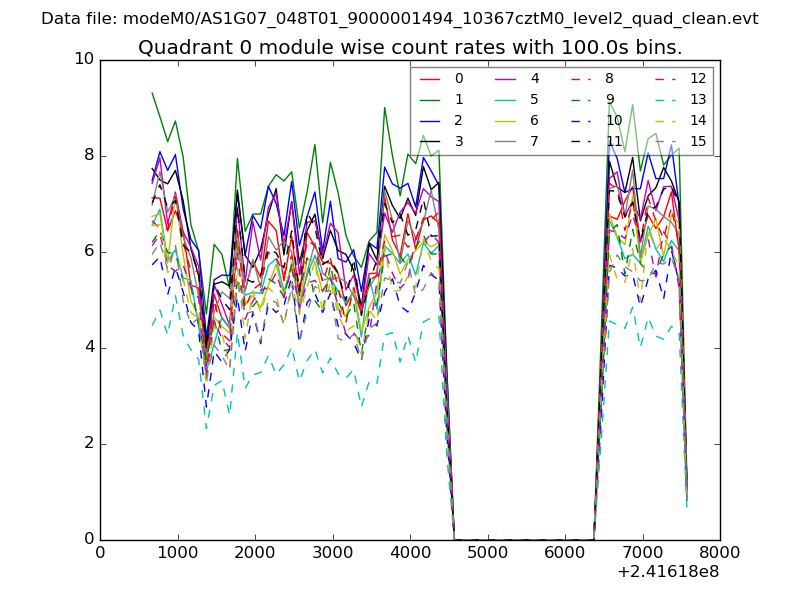 |
 |
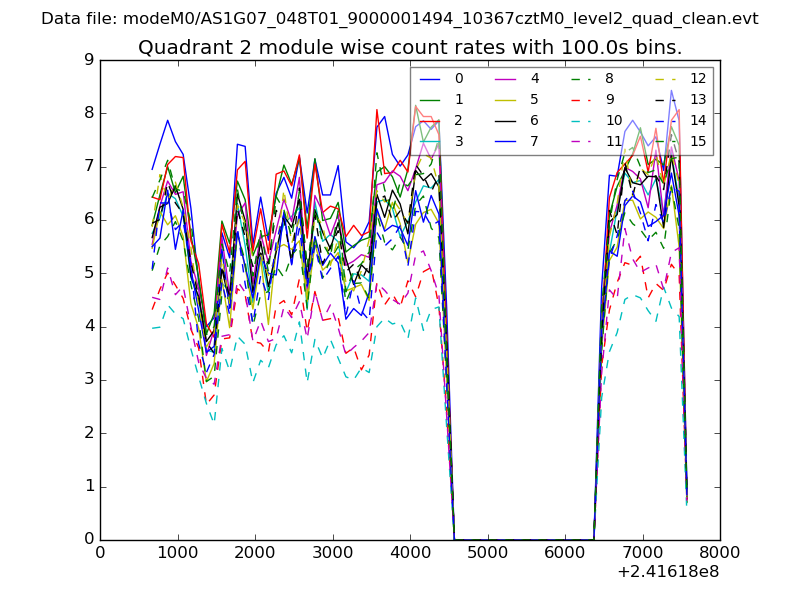
| Module-wise count rates for Quadrant B Data is divided into 100 sec bins |
 |
 |
| Module-wise count rates for Quadrant C Data is divided into 100 sec bins |
 |
 |
| Module-wise count rates for Quadrant D Data is divided into 100 sec bins |
 |
 |
| Parameter | Plot |
|---|---|
| CZT HV Monitor | 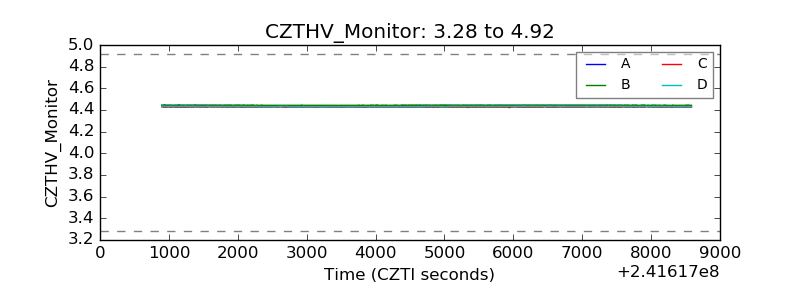 |
| D_VDD | 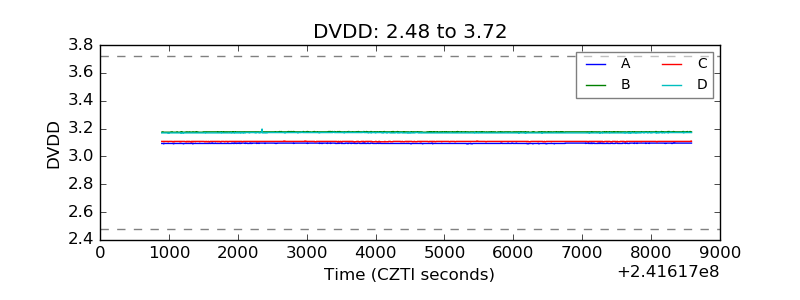 |
| Temperature 1 | 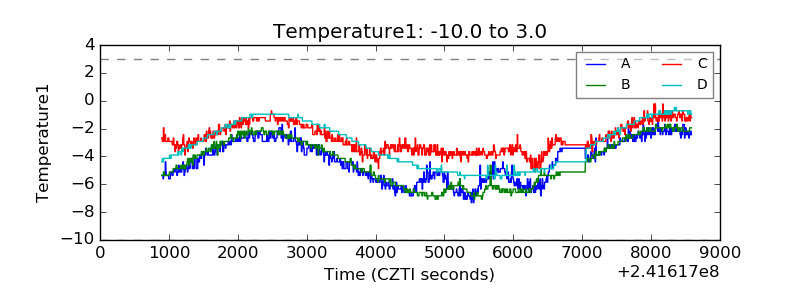 |
| Veto HV Monitor | 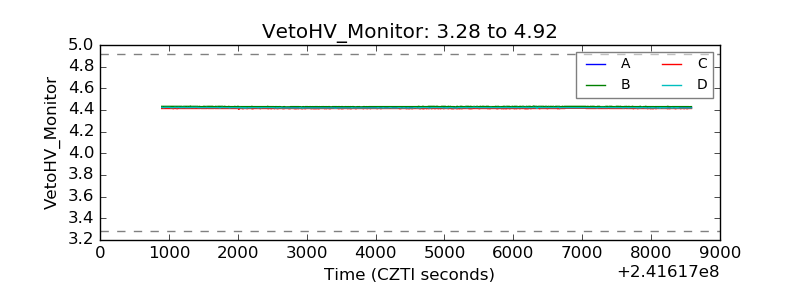 |
| Veto LLD | 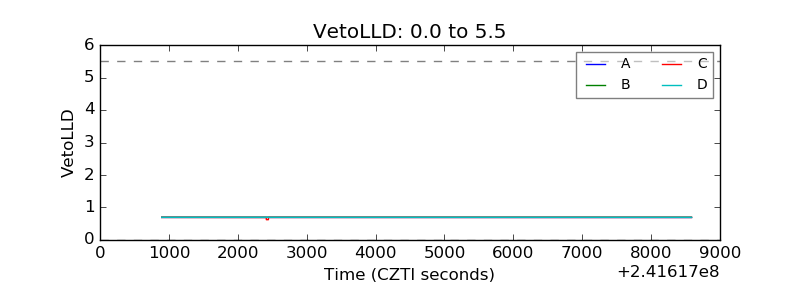 |
| Alpha Counter | 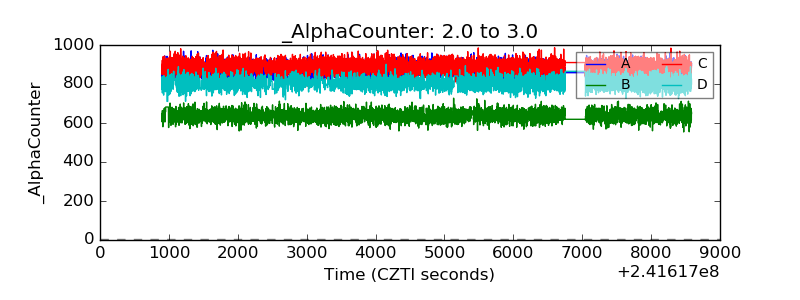 |
| _CPM_Rate | 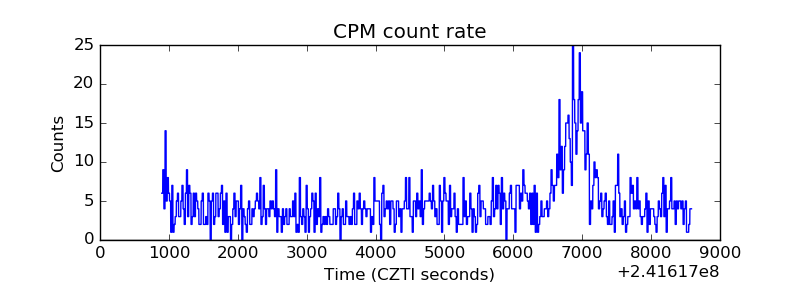 |
| CZT Counter | 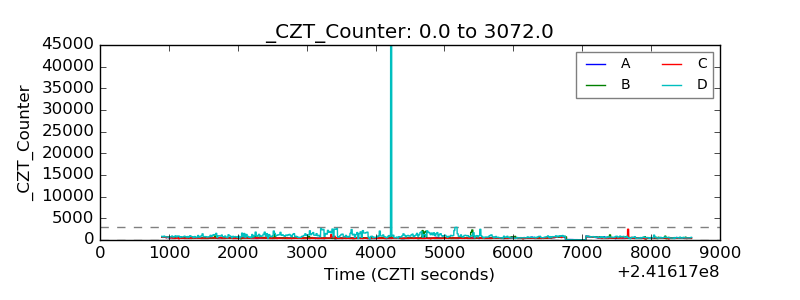 |
| +2.5 Volts monitor |  |
| +5 Volts monitor | 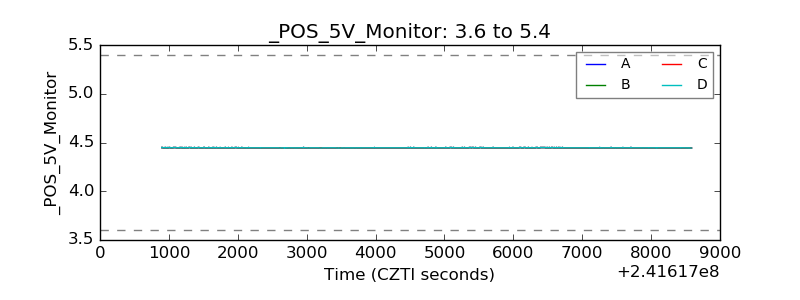 |
| _ROLL_ROT | 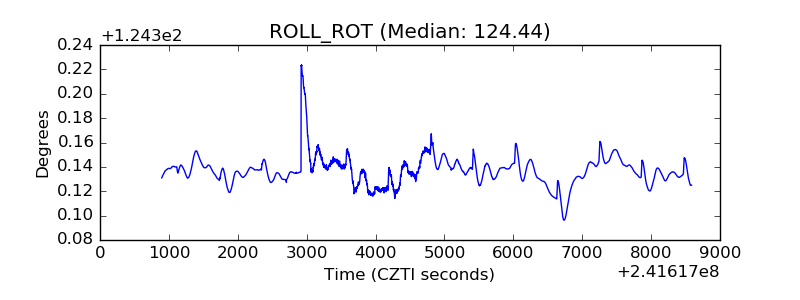 |
| _Roll_DEC | 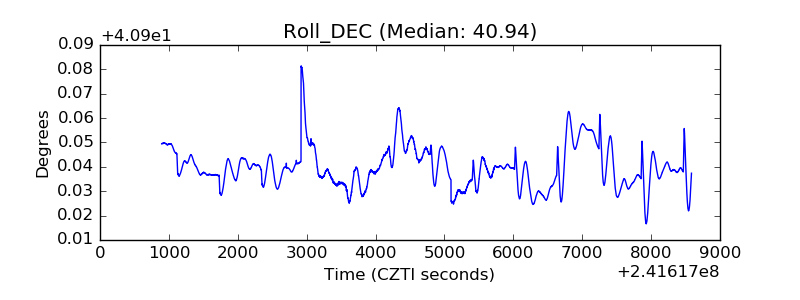 |
| _Roll_RA | 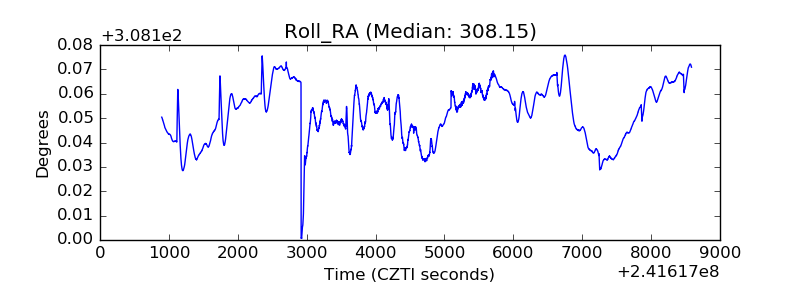 |
| Veto Counter | 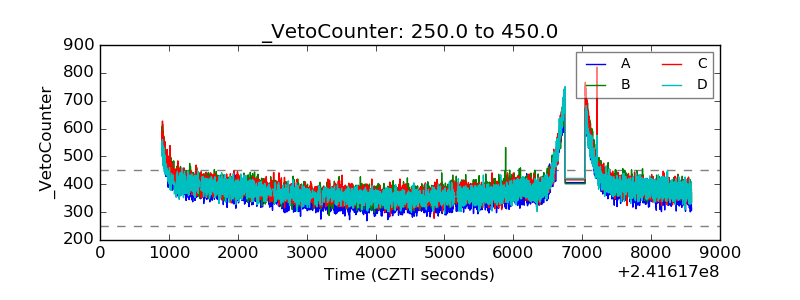 |