| Param | Original file | Final file |
|---|---|---|
| Filename | modeM0/AS1G07_048T01_9000001494_10368cztM0_level2.evt | modeM0/AS1G07_048T01_9000001494_10368cztM0_level2_quad_clean.evt |
| Size (bytes) | 390,611,520 | 79,430,400 |
| Size | 372.5 MB | 75.8 MB |
| Events in quadrant A | 2,636,283 | 505,986 |
| Events in quadrant B | 2,748,065 | 494,518 |
| Events in quadrant C | 2,581,503 | 501,608 |
| Events in quadrant D | 3,468,885 | 498,927 |
| Mode M0 | |||
|---|---|---|---|
| Quadrant | BADHDUFLAG | Total packets | Discarded packets |
| A | 0 | 27471 | 15726 |
| B | 0 | 31072 | 19336 |
| C | 0 | 28664 | 16891 |
| D | 0 | 35180 | 21048 |
| Mode M9 | |||
|---|---|---|---|
| Quadrant | BADHDUFLAG | Total packets | Discarded packets |
| A | 0 | 2 | 1 |
| B | 0 | 2 | 1 |
| C | 0 | 2 | 1 |
| D | 0 | 2 | 1 |
| Mode SS | |||
|---|---|---|---|
| Quadrant | BADHDUFLAG | Total packets | Discarded packets |
| A | 0 | 282 | 152 |
| B | 0 | 282 | 155 |
| C | 0 | 282 | 155 |
| D | 0 | 274 | 145 |
| Quadrant | Total seconds | Saturated seconds | Saturation percentage |
|---|---|---|---|
| A | 5706 | 85 | 1.489660% |
| B | 5492 | 103 | 1.875455% |
| C | 5716 | 77 | 1.347096% |
| D | 6129 | 118 | 1.925273% |
Noise dominated data is calculated using 1-second bins in cleaned event files. If a bin has >2000 counts, and if more than 50% of those come from <1% of pixels, then it is considered to be noise-dominated and hence unusable.
| Quadrant | # 1 sec bins | Bins with >0 counts | Bins with >2000 counts | High rate bins dominated by noise | Noise dominated (total time) | Noise dominated (detector-on time) | Marked lightcurve |
|---|---|---|---|---|---|---|---|
| A | 7045 | 6702 | 0 | 0 | 0.00% | 0.00% | 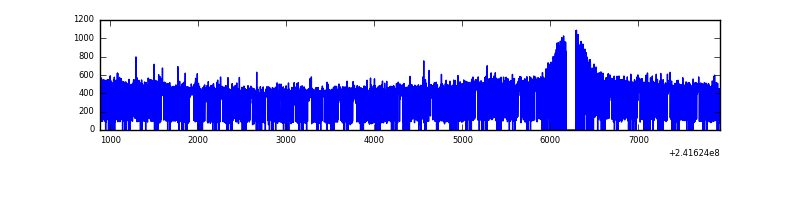 |
| B | 7045 | 6532 | 1 | 1 | 0.01% | 0.02% | 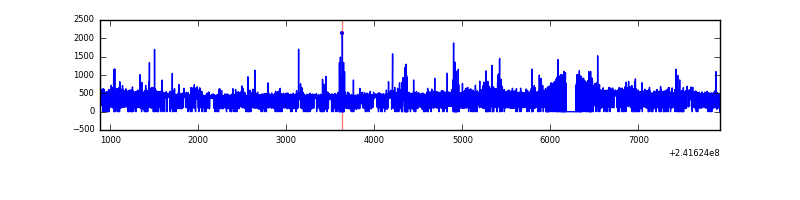 |
| C | 7045 | 6700 | 0 | 0 | 0.00% | 0.00% | 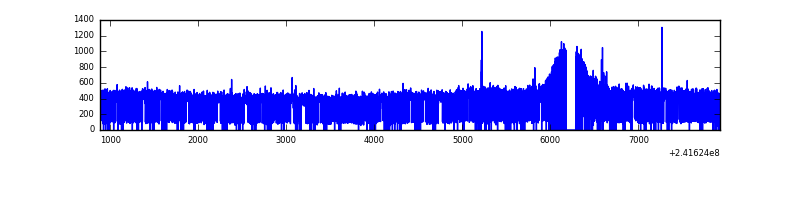 |
| D | 6963 | 6564 | 12 | 12 | 0.17% | 0.18% | 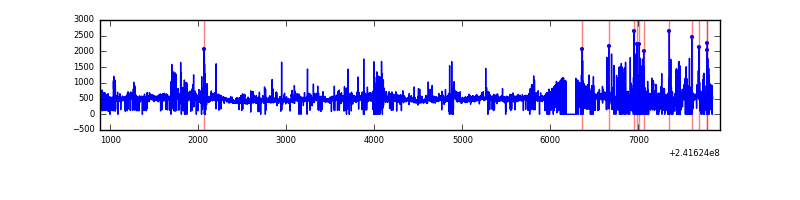 |
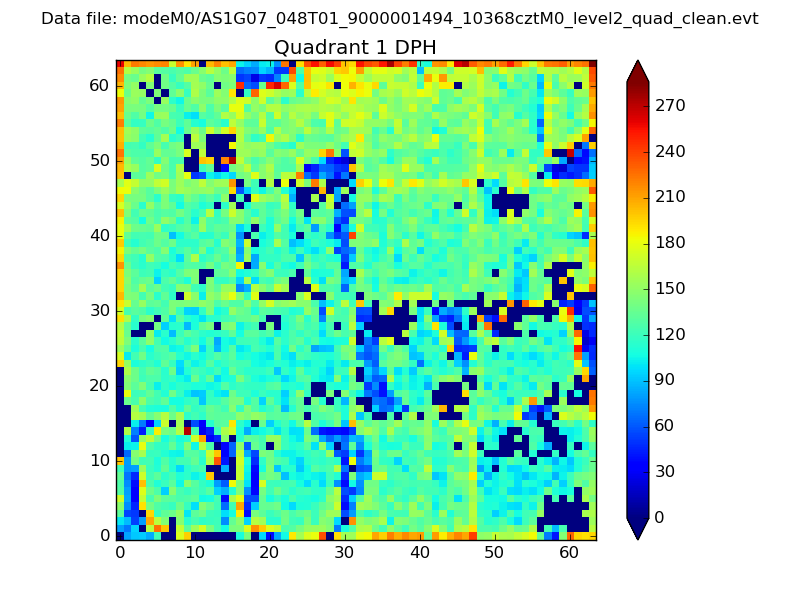
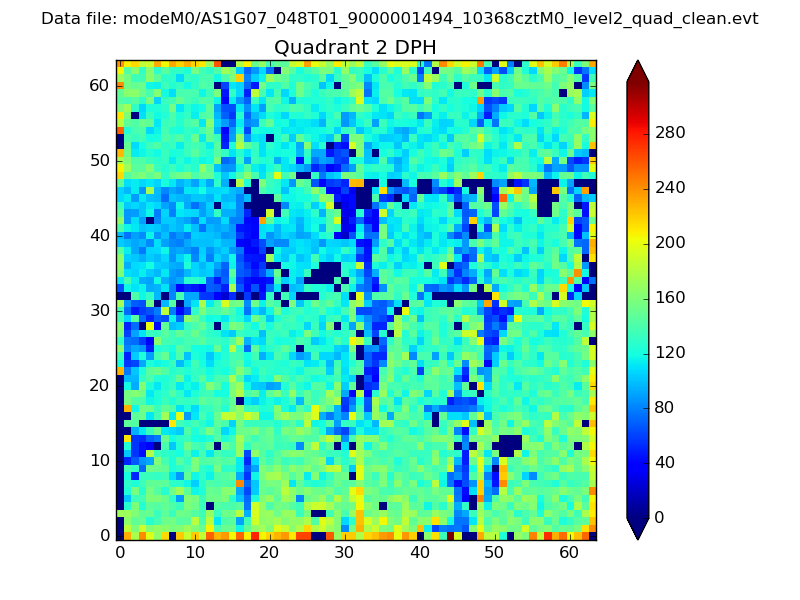
Top three noisy pixels from each quadrant. If the there are fewer than three noisy pixels in the level2.evt file, extra rows are filled as -1
| Pixel properties | Quadrant properties | ||||||
|---|---|---|---|---|---|---|---|
| Quadrant | DetID | PixID | Counts | Sigma | Mean | Median | Sigma |
| A | 13 | 251 | 16385 | 113.43 | 676 | 662 | 138.6 |
| A | 8 | 15 | 13901 | 95.51 | 676 | 662 | 138.6 |
| A | 0 | 226 | 6256 | 40.36 | 676 | 662 | 138.6 |
| B | 4 | 239 | 100032 | 793.64 | 649 | 633 | 125.2 |
| B | 0 | 219 | 38230 | 300.19 | 649 | 633 | 125.2 |
| B | 0 | 214 | 35135 | 275.48 | 649 | 633 | 125.2 |
| C | 14 | 234 | 9515 | 57.36 | 659 | 660 | 154.4 |
| C | 13 | 61 | 4971 | 27.92 | 659 | 660 | 154.4 |
| C | 8 | 222 | 2917 | 14.62 | 659 | 660 | 154.4 |
| D | 8 | 195 | 230194 | 1351.59 | 704 | 685 | 169.8 |
| D | 12 | 233 | 183665 | 1077.58 | 704 | 685 | 169.8 |
| D | 1 | 20 | 104840 | 613.37 | 704 | 685 | 169.8 |
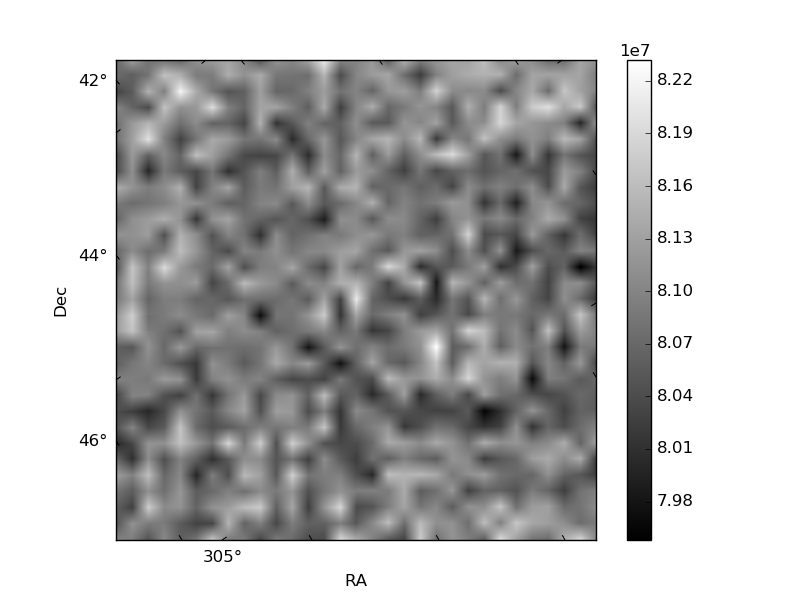
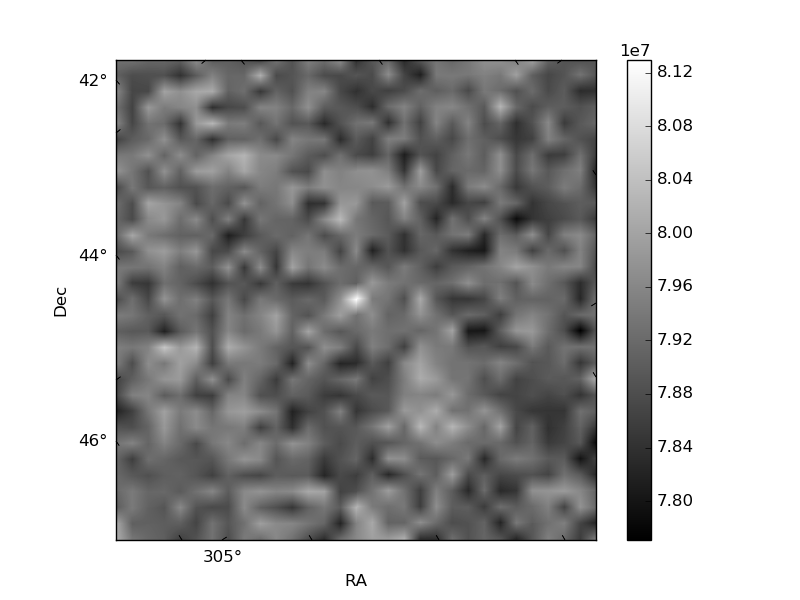
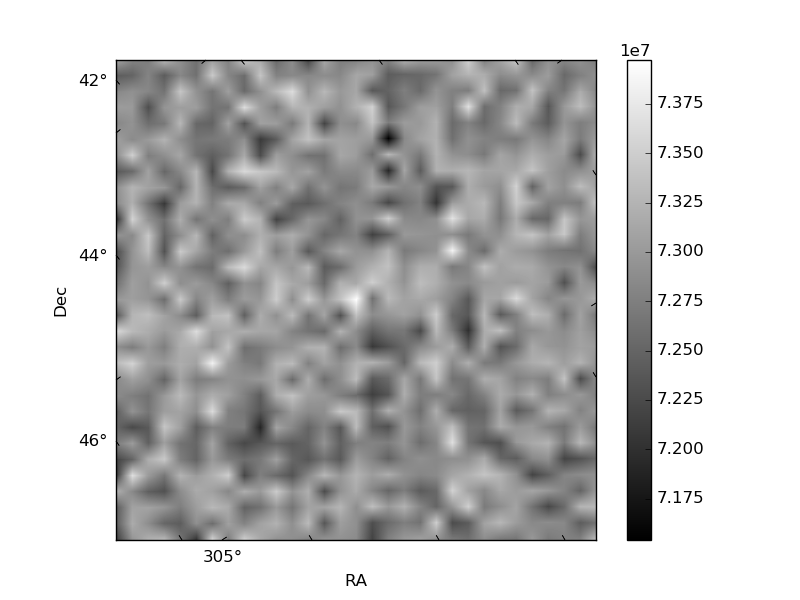
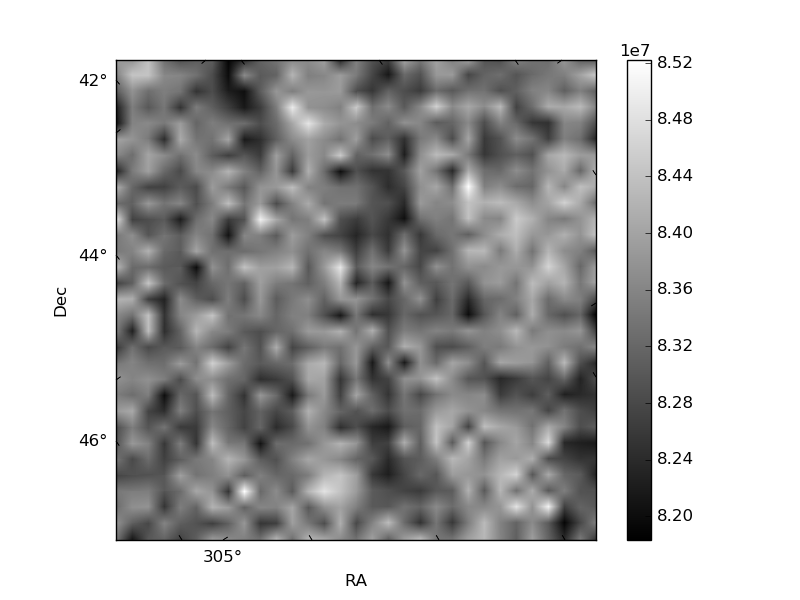
Histogram calculated using DETX and DETY for each event in the final _common_clean file
| Quadrant A | 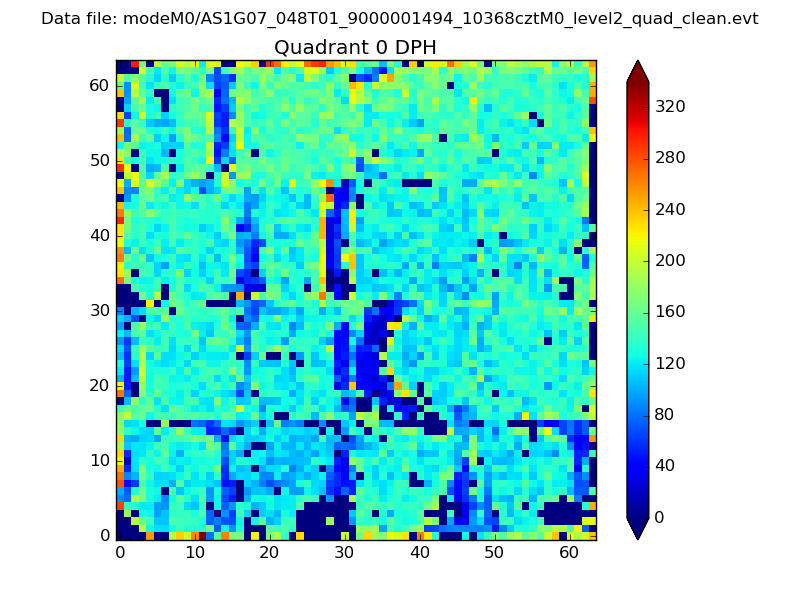 |
 |
Quadrant B |
|---|---|---|---|
| Quadrant D | 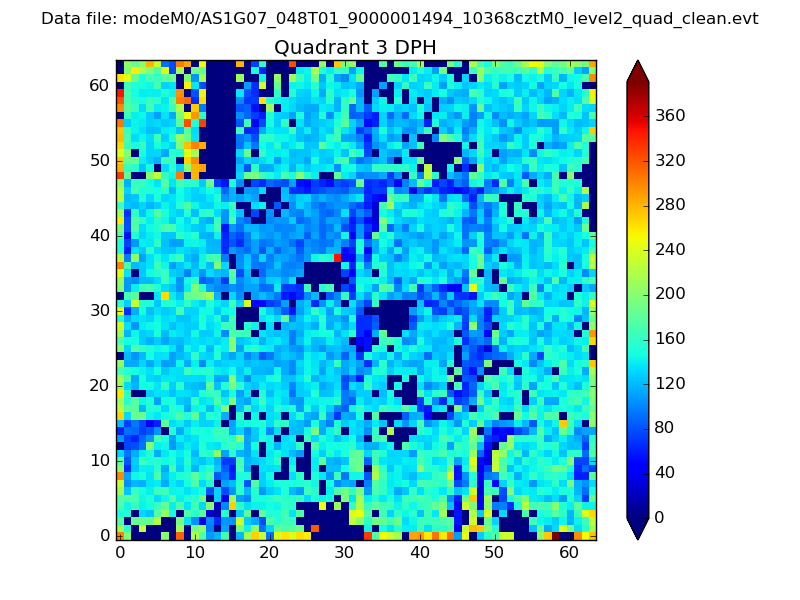 |
 |
Quadrant C |
| Plot type | Count rate plots | Images |
|---|---|---|
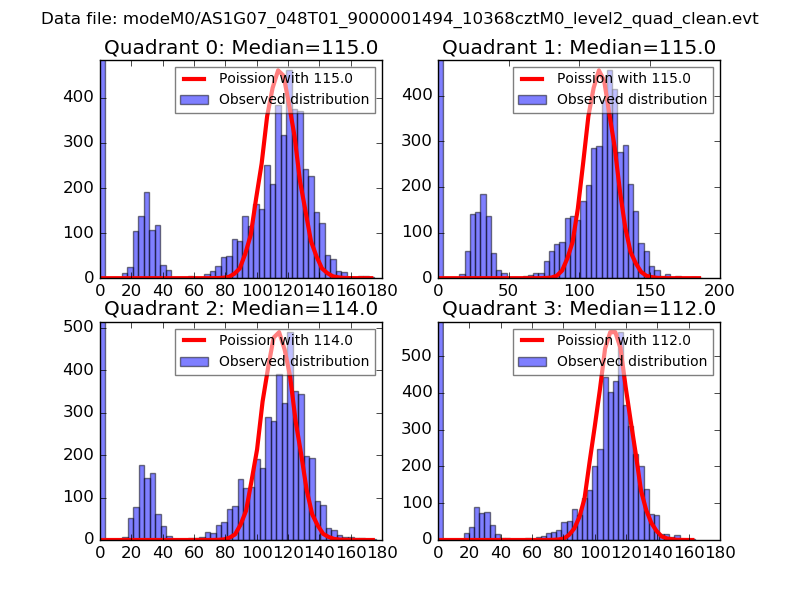
| Comparison with Poisson distribution Blue bars denote a histogram of data divided into 1 sec bins. Red curve is a Poisson curve with rate = median count rate of data. |
 |
 |
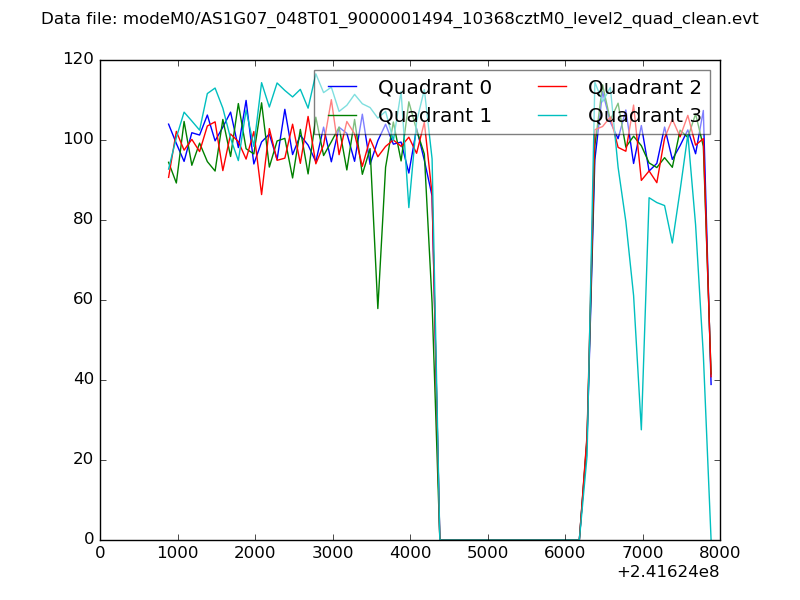
| Quadrant-wise count rates Data is divided into 100 sec bins |
 |
|
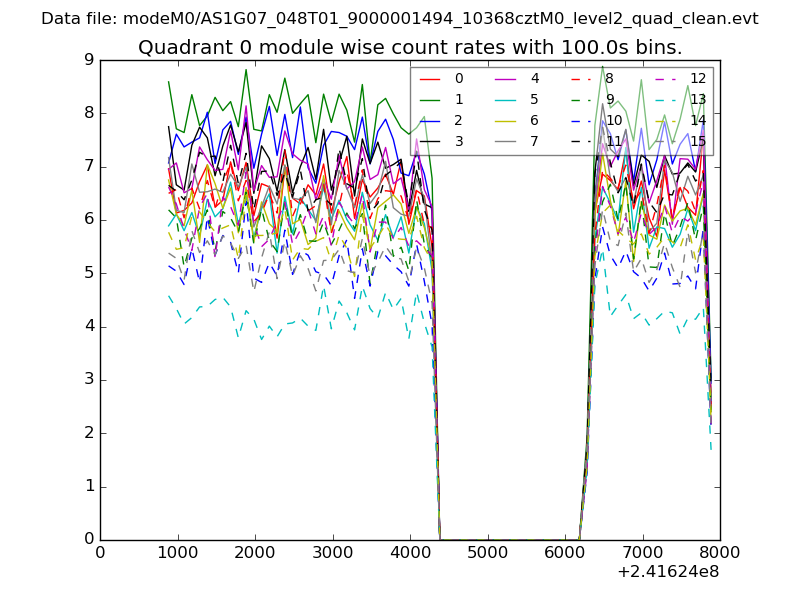
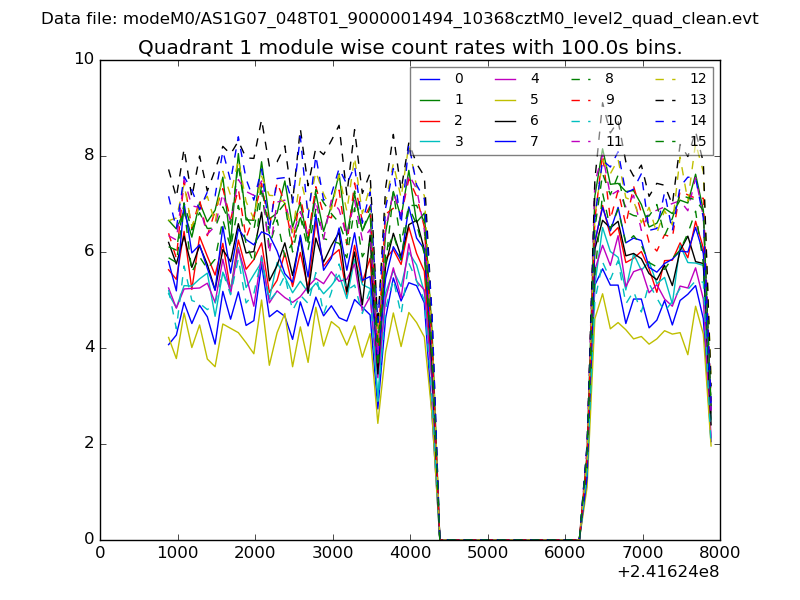
| Module-wise count rates for Quadrant A Data is divided into 100 sec bins |
 |
 |
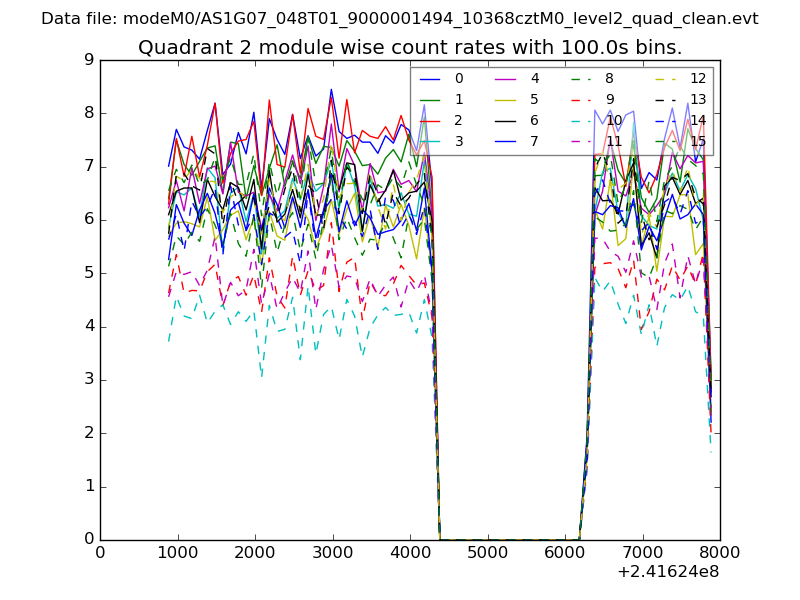
| Module-wise count rates for Quadrant B Data is divided into 100 sec bins |
 |
 |
| Module-wise count rates for Quadrant C Data is divided into 100 sec bins |
 |
 |
| Module-wise count rates for Quadrant D Data is divided into 100 sec bins |
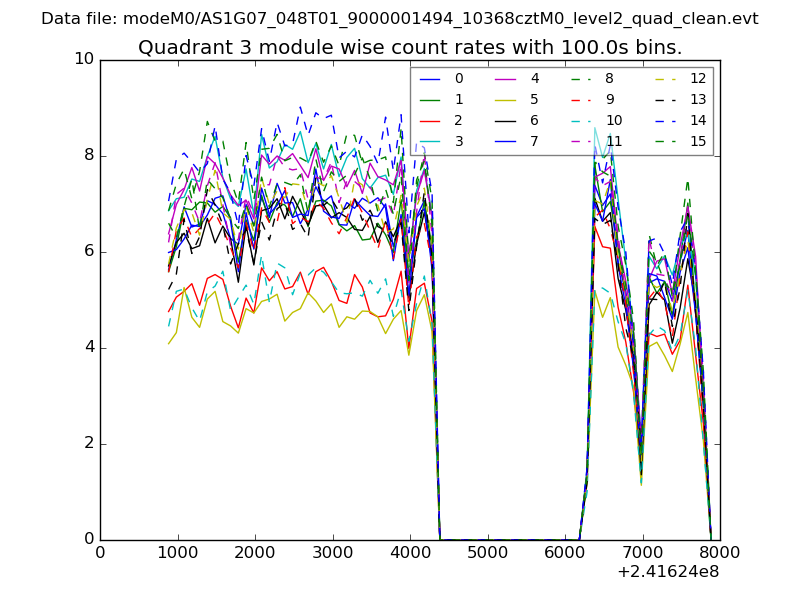 |
 |
| Parameter | Plot |
|---|---|
| CZT HV Monitor | 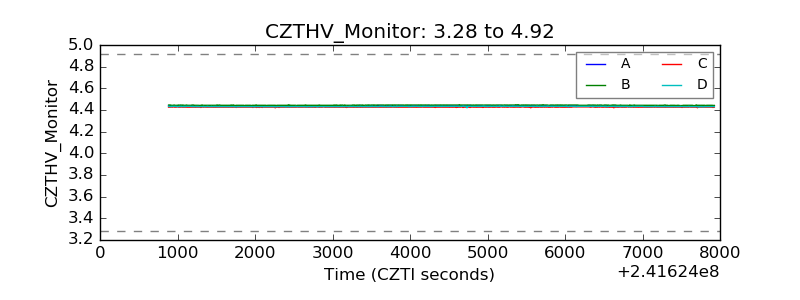 |
| D_VDD | 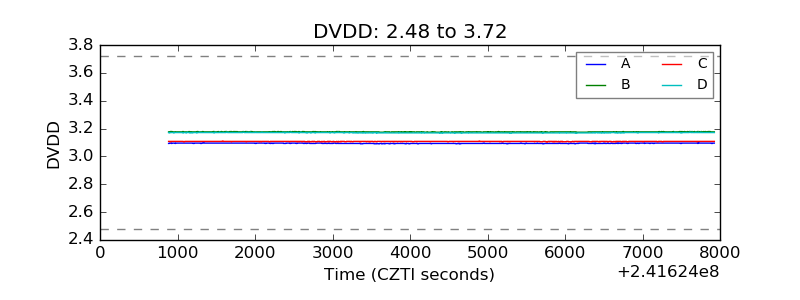 |
| Temperature 1 | 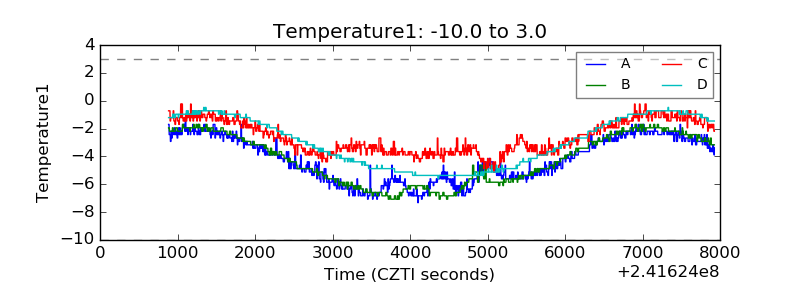 |
| Veto HV Monitor | 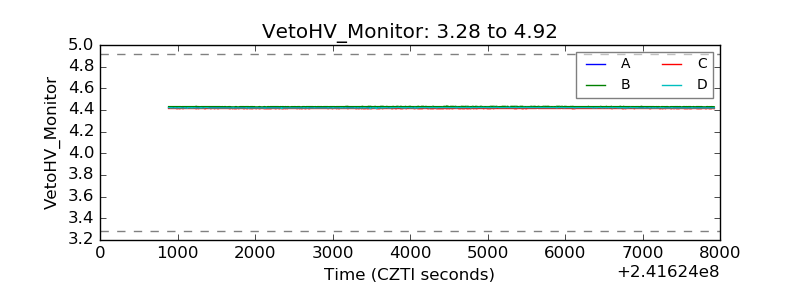 |
| Veto LLD | 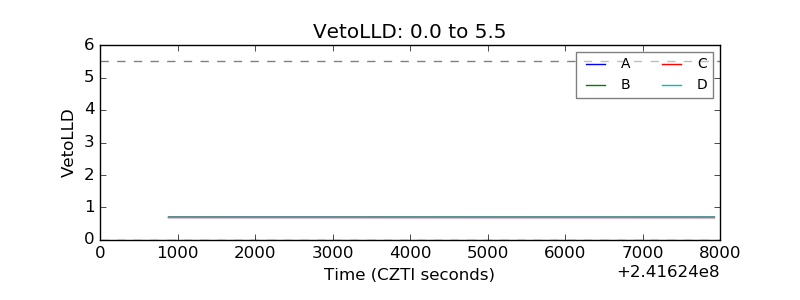 |
| Alpha Counter | 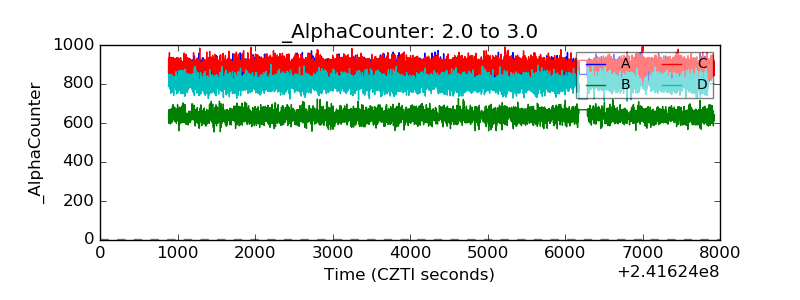 |
| _CPM_Rate | 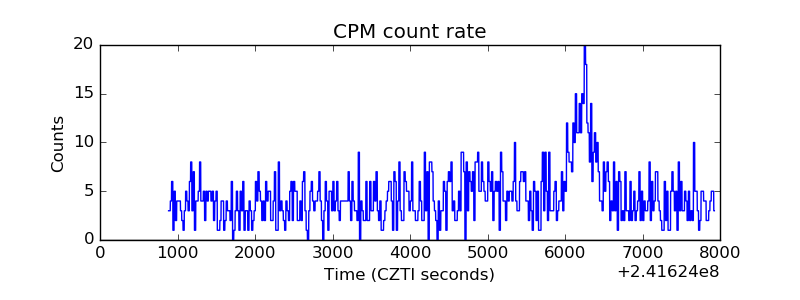 |
| CZT Counter | 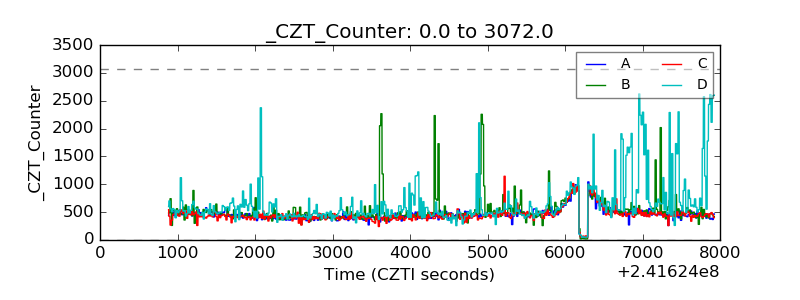 |
| +2.5 Volts monitor | 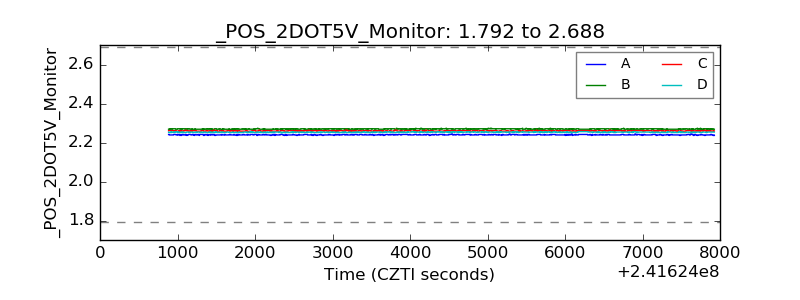 |
| +5 Volts monitor |  |
| _ROLL_ROT | 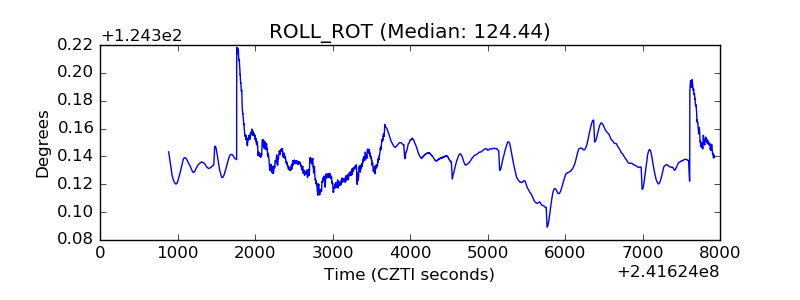 |
| _Roll_DEC | 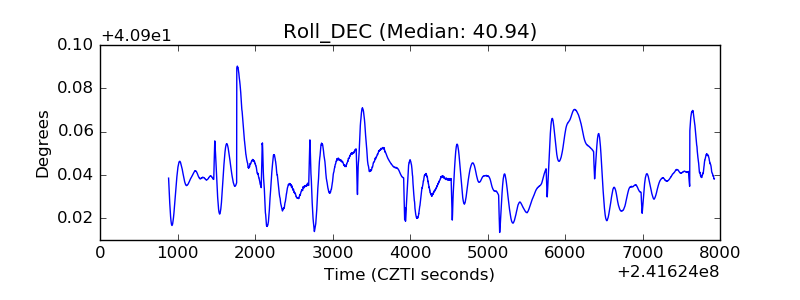 |
| _Roll_RA | 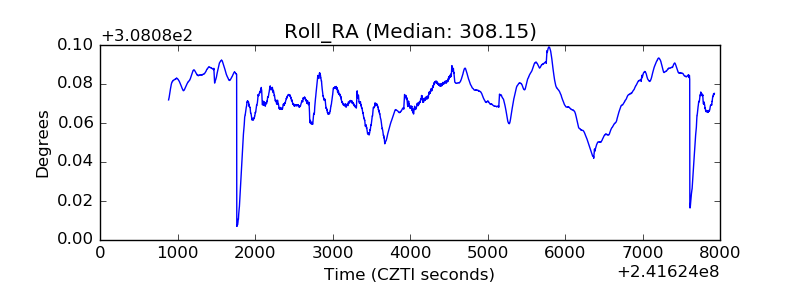 |
| Veto Counter | 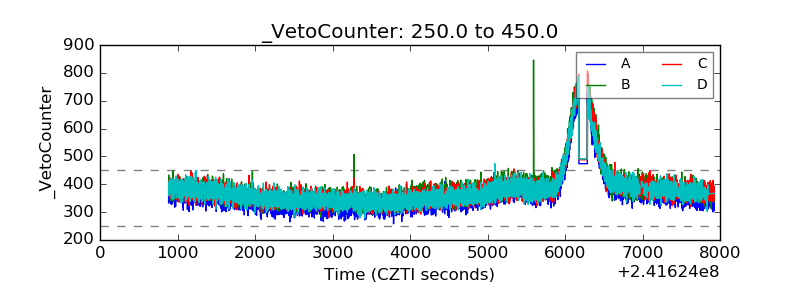 |