| Param | Original file | Final file |
|---|---|---|
| Filename | modeM0/AS1G07_048T01_9000001494_10369cztM0_level2.evt | modeM0/AS1G07_048T01_9000001494_10369cztM0_level2_quad_clean.evt |
| Size (bytes) | 505,658,880 | 86,621,760 |
| Size | 482.2 MB | 82.6 MB |
| Events in quadrant A | 2,875,176 | 565,444 |
| Events in quadrant B | 3,161,789 | 562,870 |
| Events in quadrant C | 2,822,550 | 561,271 |
| Events in quadrant D | 6,016,417 | 484,209 |
| Mode M0 | |||
|---|---|---|---|
| Quadrant | BADHDUFLAG | Total packets | Discarded packets |
| A | 0 | 21367 | 8430 |
| B | 0 | 23188 | 9599 |
| C | 0 | 21890 | 8884 |
| D | 0 | 32526 | 10091 |
| Mode M9 | |||
|---|---|---|---|
| Quadrant | BADHDUFLAG | Total packets | Discarded packets |
| A | 0 | 5 | 2 |
| B | 0 | 6 | 3 |
| C | 0 | 6 | 3 |
| D | 0 | 6 | 3 |
| Mode SS | |||
|---|---|---|---|
| Quadrant | BADHDUFLAG | Total packets | Discarded packets |
| A | 0 | 218 | 84 |
| B | 0 | 218 | 80 |
| C | 0 | 218 | 78 |
| D | 0 | 210 | 76 |
| Quadrant | Total seconds | Saturated seconds | Saturation percentage |
|---|---|---|---|
| A | 6352 | 44 | 0.692695% |
| B | 6314 | 103 | 1.631296% |
| C | 6402 | 28 | 0.437363% |
| D | 6650 | 959 | 14.421053% |
Noise dominated data is calculated using 1-second bins in cleaned event files. If a bin has >2000 counts, and if more than 50% of those come from <1% of pixels, then it is considered to be noise-dominated and hence unusable.
| Quadrant | # 1 sec bins | Bins with >0 counts | Bins with >2000 counts | High rate bins dominated by noise | Noise dominated (total time) | Noise dominated (detector-on time) | Marked lightcurve |
|---|---|---|---|---|---|---|---|
| A | 7379 | 6899 | 0 | 0 | 0.00% | 0.00% | 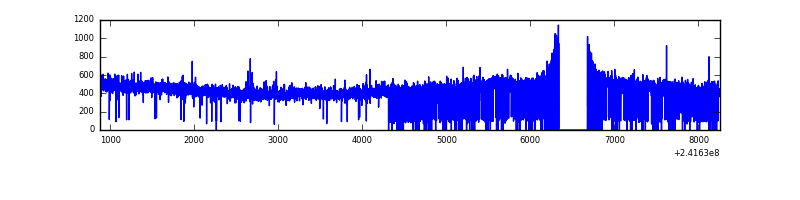 |
| B | 7379 | 6869 | 41 | 41 | 0.56% | 0.60% | 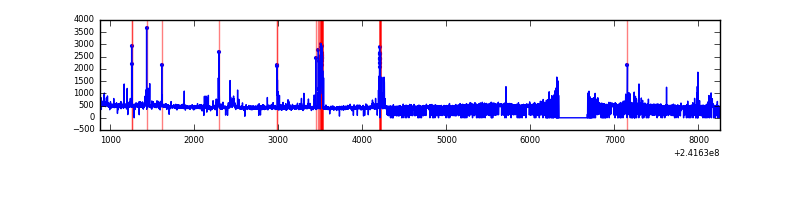 |
| C | 7378 | 6914 | 1 | 1 | 0.01% | 0.01% | 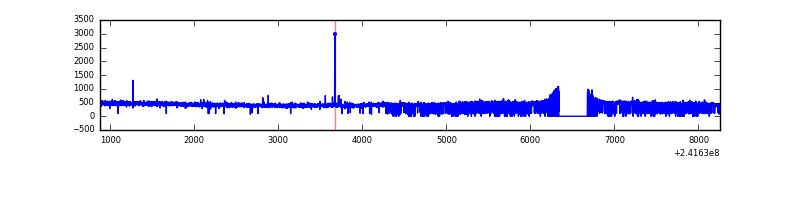 |
| D | 7379 | 6908 | 890 | 890 | 12.06% | 12.88% | 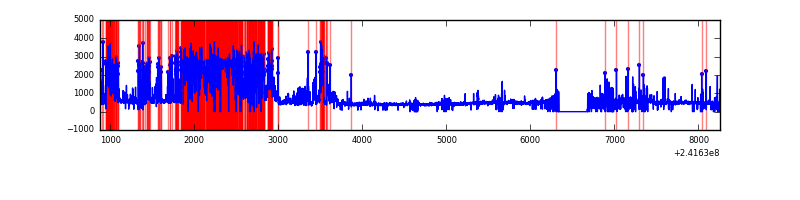 |
Top three noisy pixels from each quadrant. If the there are fewer than three noisy pixels in the level2.evt file, extra rows are filled as -1
| Pixel properties | Quadrant properties | ||||||
|---|---|---|---|---|---|---|---|
| Quadrant | DetID | PixID | Counts | Sigma | Mean | Median | Sigma |
| A | 8 | 15 | 28751 | 185.32 | 734 | 717 | 151.3 |
| A | 13 | 251 | 17255 | 109.32 | 734 | 717 | 151.3 |
| A | 0 | 226 | 6666 | 39.33 | 734 | 717 | 151.3 |
| B | 4 | 239 | 236730 | 1683.79 | 728 | 710 | 140.2 |
| B | 0 | 219 | 34950 | 244.27 | 728 | 710 | 140.2 |
| B | 0 | 214 | 26316 | 182.68 | 728 | 710 | 140.2 |
| C | 14 | 234 | 10442 | 57.79 | 720 | 725 | 168.1 |
| C | 13 | 61 | 5462 | 28.17 | 720 | 725 | 168.1 |
| C | 8 | 222 | 2690 | 11.69 | 720 | 725 | 168.1 |
| D | 12 | 233 | 2348682 | 13850.32 | 702 | 681 | 169.5 |
| D | 1 | 52 | 405054 | 2385.3 | 702 | 681 | 169.5 |
| D | 13 | 104 | 175218 | 1029.55 | 702 | 681 | 169.5 |
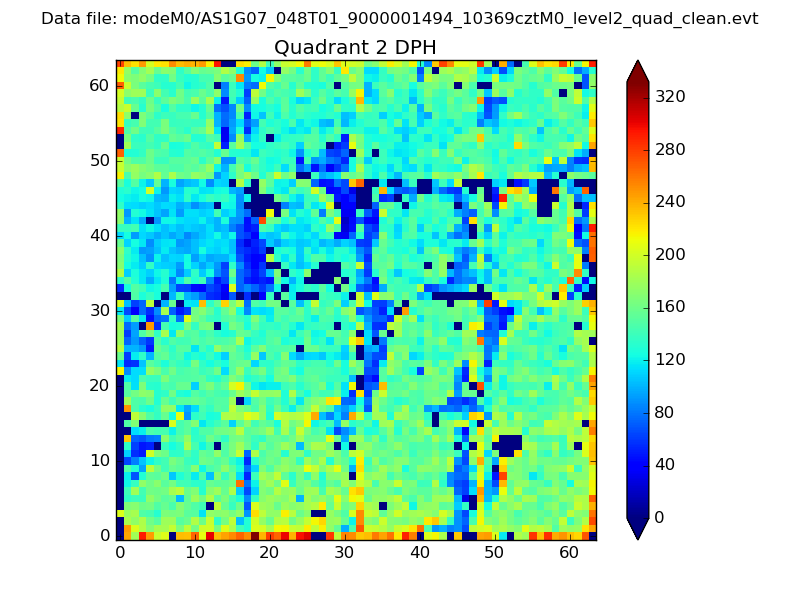
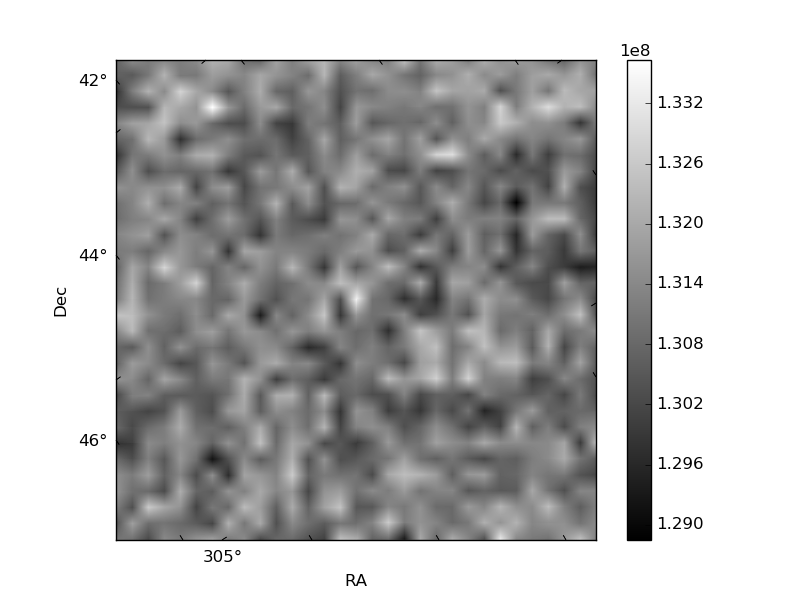
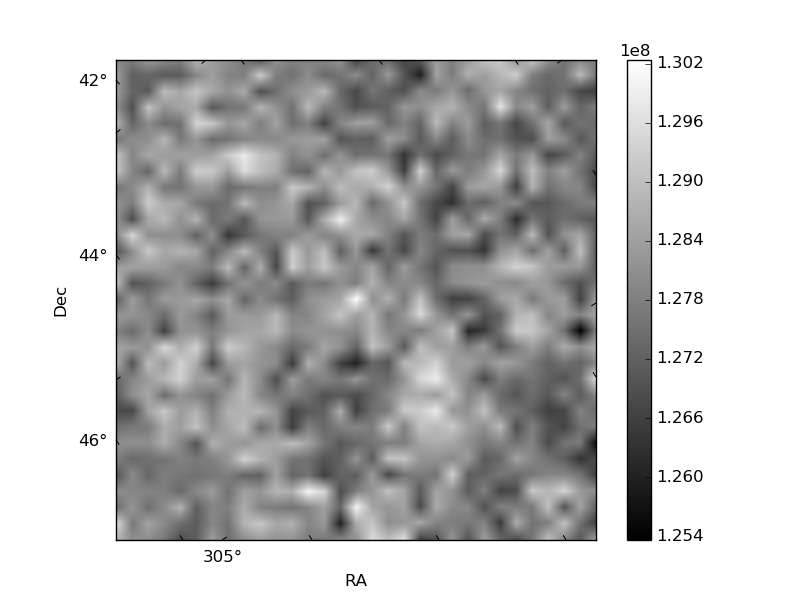
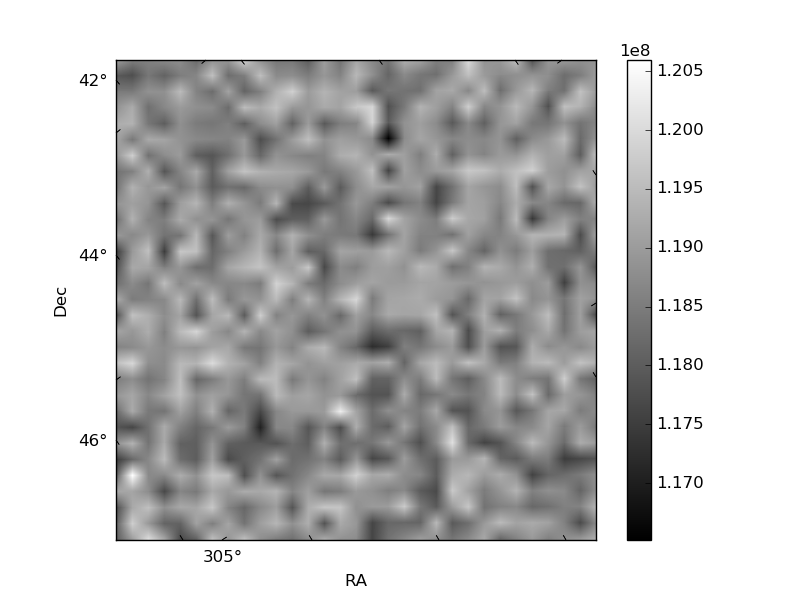
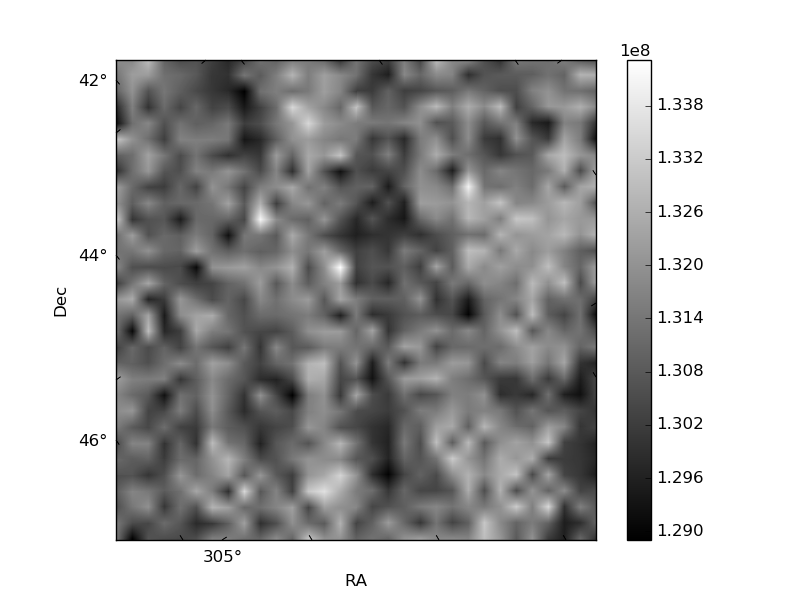
Histogram calculated using DETX and DETY for each event in the final _common_clean file
| Quadrant A | 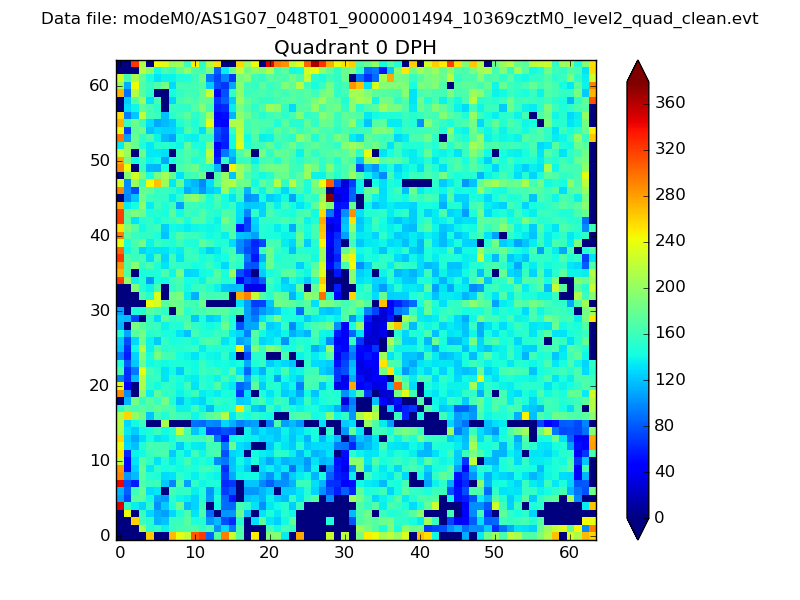 |
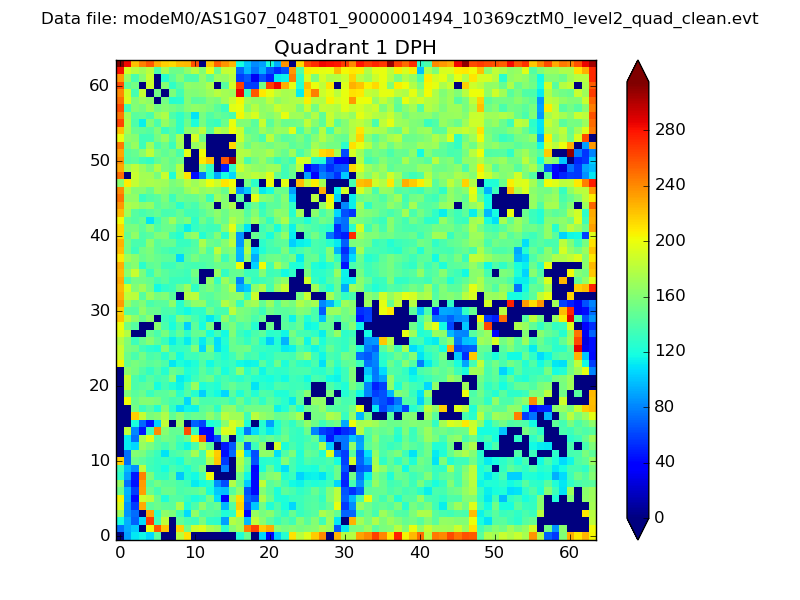 |
Quadrant B |
|---|---|---|---|
| Quadrant D | 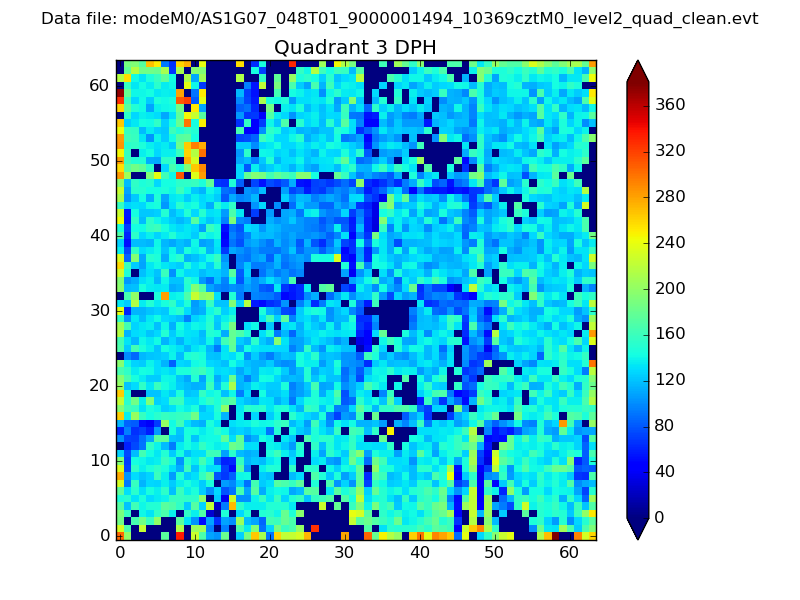 |
 |
Quadrant C |
| Plot type | Count rate plots | Images |
|---|---|---|
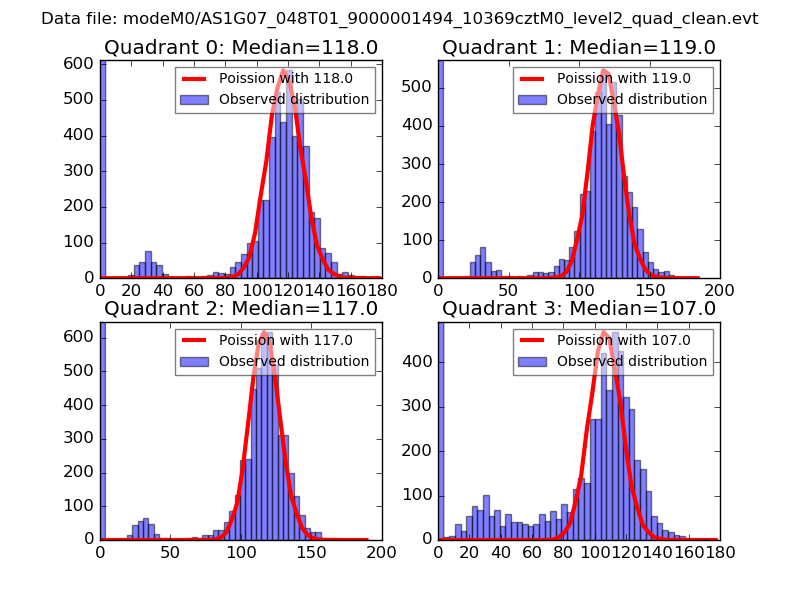
| Comparison with Poisson distribution Blue bars denote a histogram of data divided into 1 sec bins. Red curve is a Poisson curve with rate = median count rate of data. |
 |
 |
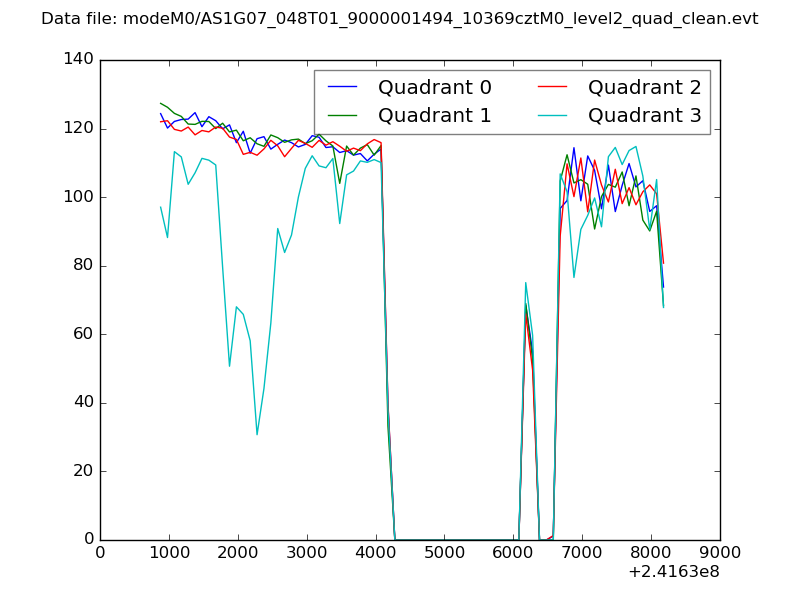
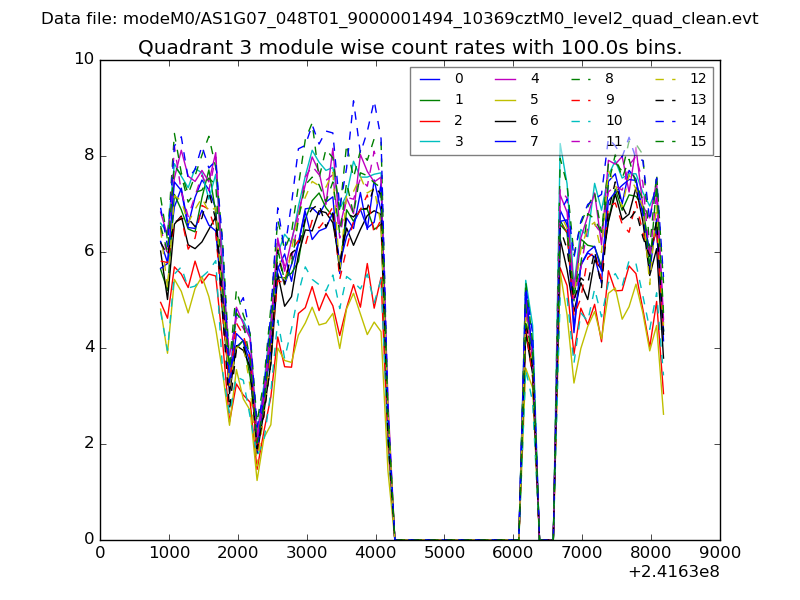
| Quadrant-wise count rates Data is divided into 100 sec bins |
 |
|
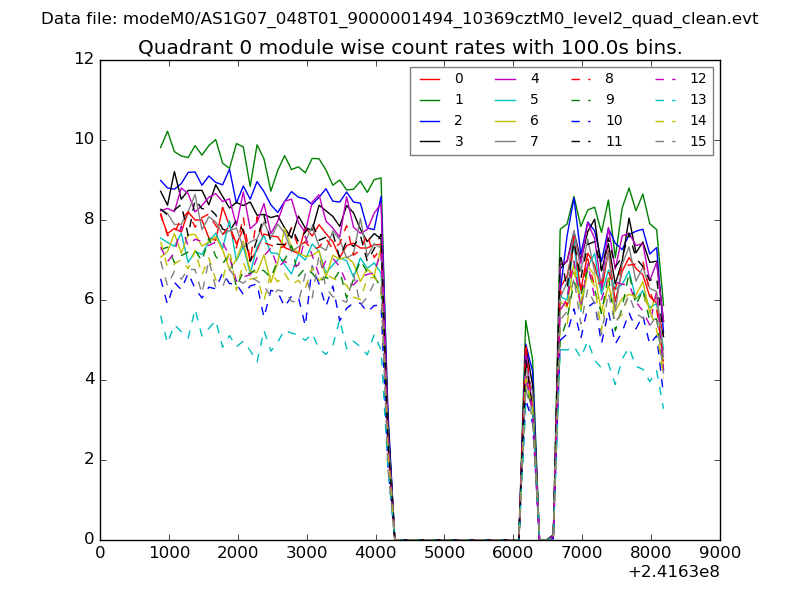
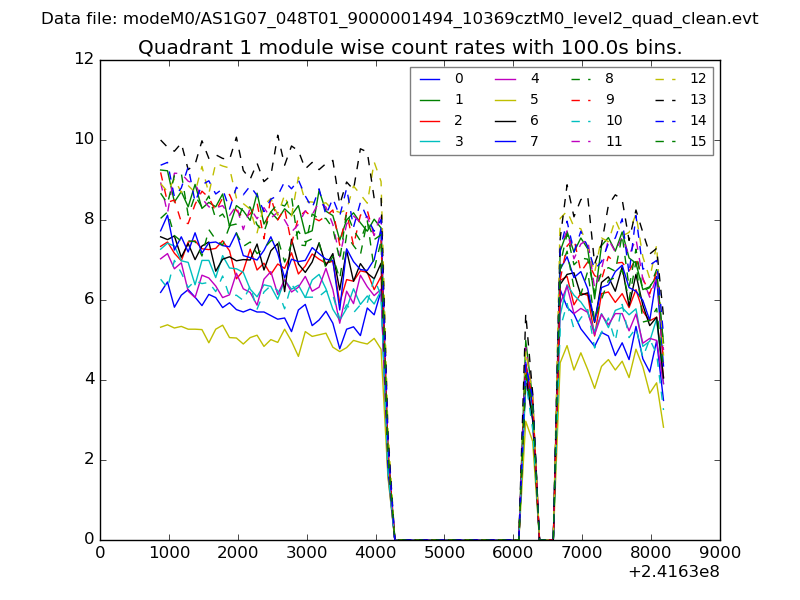
| Module-wise count rates for Quadrant A Data is divided into 100 sec bins |
 |
 |
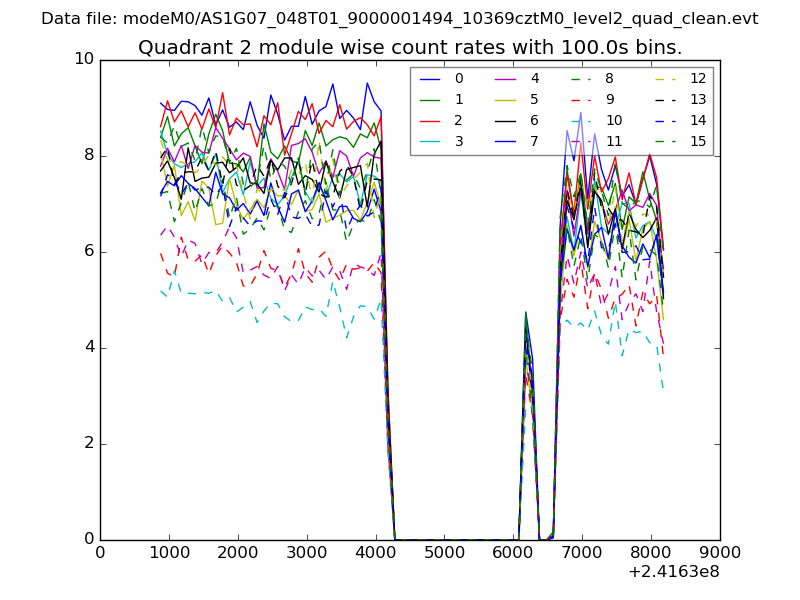
| Module-wise count rates for Quadrant B Data is divided into 100 sec bins |
 |
 |
| Module-wise count rates for Quadrant C Data is divided into 100 sec bins |
 |
 |
| Module-wise count rates for Quadrant D Data is divided into 100 sec bins |
 |
 |
| Parameter | Plot |
|---|---|
| CZT HV Monitor | 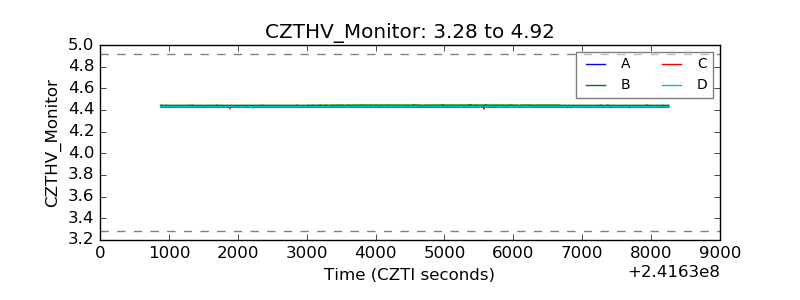 |
| D_VDD | 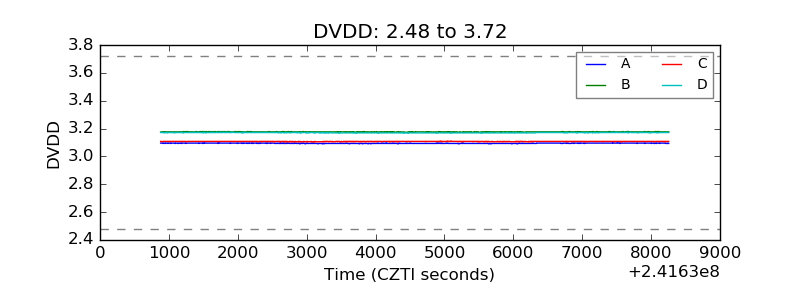 |
| Temperature 1 | 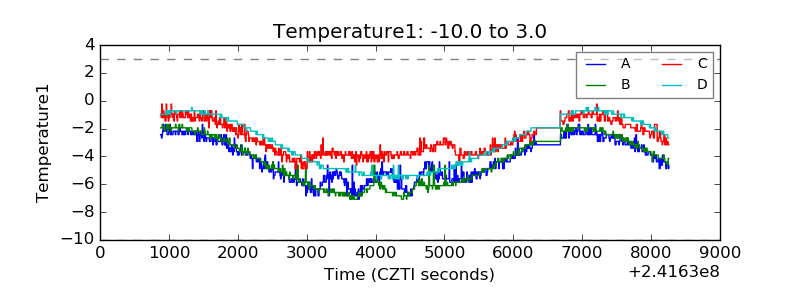 |
| Veto HV Monitor | 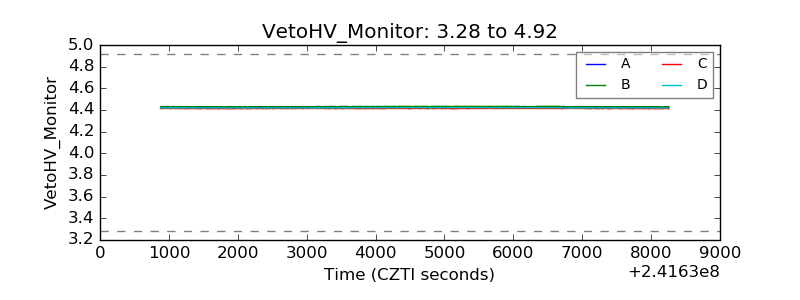 |
| Veto LLD | 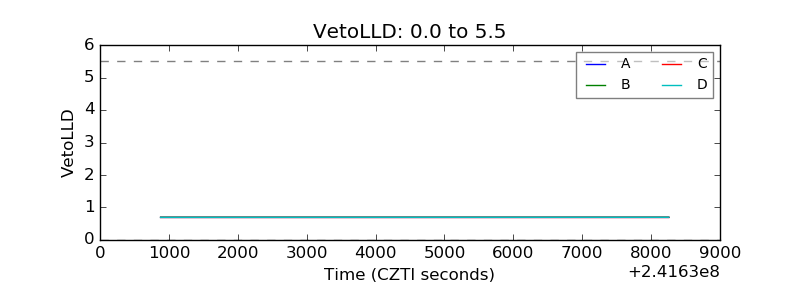 |
| Alpha Counter | 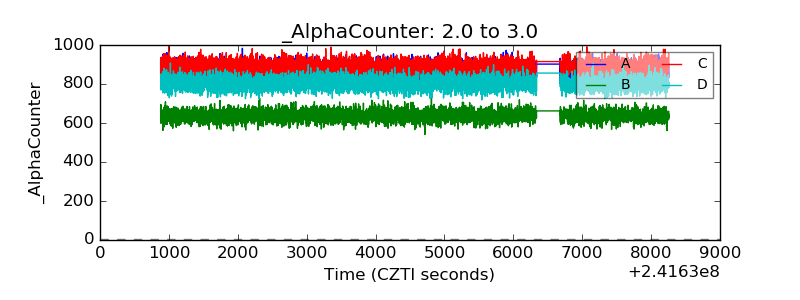 |
| _CPM_Rate | 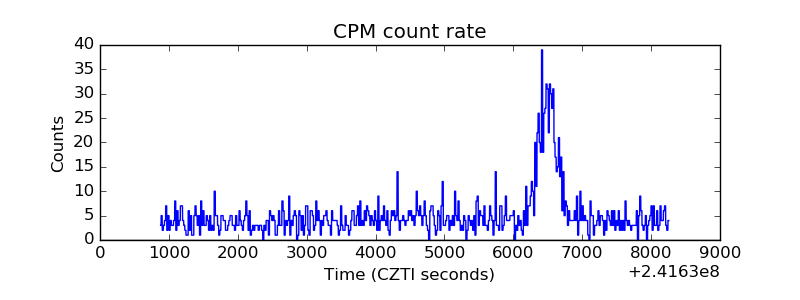 |
| CZT Counter | 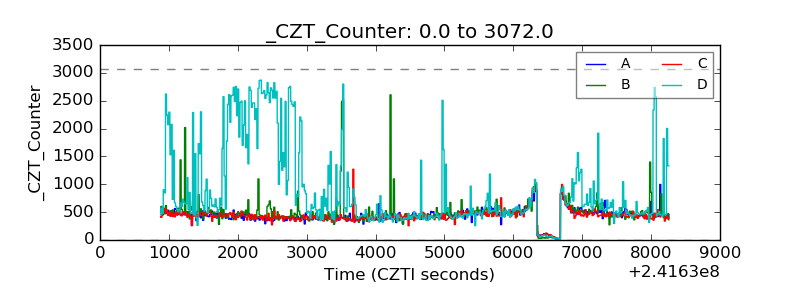 |
| +2.5 Volts monitor | 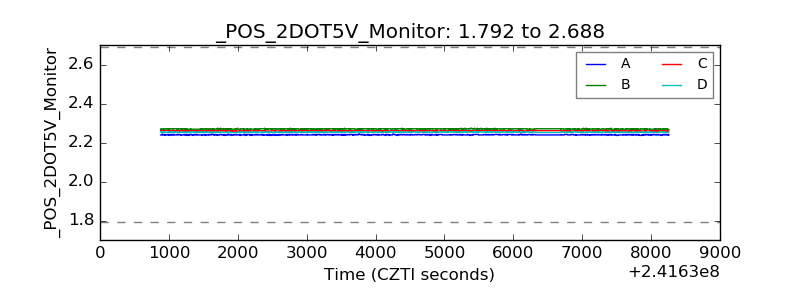 |
| +5 Volts monitor |  |
| _ROLL_ROT | 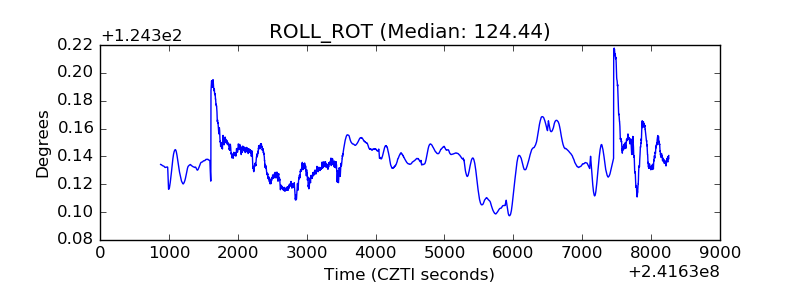 |
| _Roll_DEC | 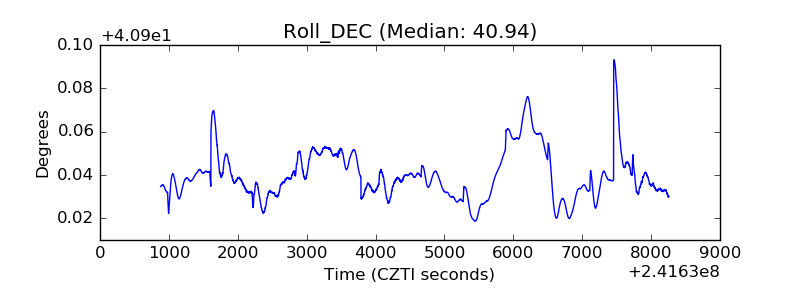 |
| _Roll_RA | 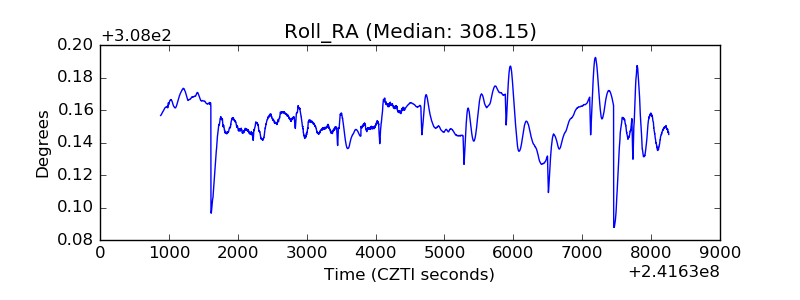 |
| Veto Counter | 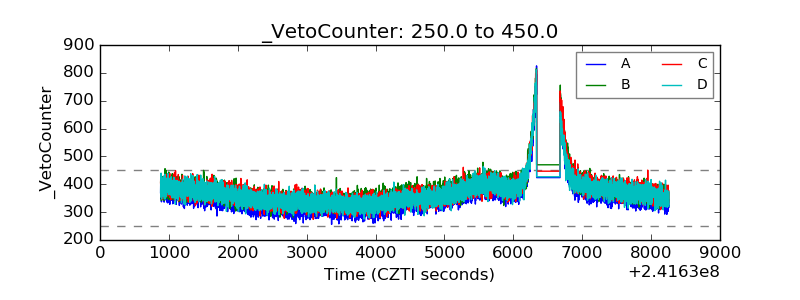 |