| Param | Original file | Final file |
|---|---|---|
| Filename | modeM0/AS1G07_048T01_9000001494_10371cztM0_level2.evt | modeM0/AS1G07_048T01_9000001494_10371cztM0_level2_quad_clean.evt |
| Size (bytes) | 476,556,480 | 96,439,680 |
| Size | 454.5 MB | 92.0 MB |
| Events in quadrant A | 3,226,323 | 618,691 |
| Events in quadrant B | 3,438,106 | 616,193 |
| Events in quadrant C | 3,133,949 | 614,254 |
| Events in quadrant D | 4,154,087 | 579,361 |
| Mode M0 | |||
|---|---|---|---|
| Quadrant | BADHDUFLAG | Total packets | Discarded packets |
| A | 0 | 14864 | 433 |
| B | 0 | 15663 | 643 |
| C | 0 | 14866 | 458 |
| D | 0 | 17661 | 571 |
| Mode M9 | |||
|---|---|---|---|
| Quadrant | BADHDUFLAG | Total packets | Discarded packets |
| A | 0 | 6 | 0 |
| B | 0 | 6 | 0 |
| C | 0 | 6 | 0 |
| D | 0 | 6 | 0 |
| Mode SS | |||
|---|---|---|---|
| Quadrant | BADHDUFLAG | Total packets | Discarded packets |
| A | 0 | 148 | 4 |
| B | 0 | 148 | 7 |
| C | 0 | 148 | 4 |
| D | 0 | 147 | 4 |
| Quadrant | Total seconds | Saturated seconds | Saturation percentage |
|---|---|---|---|
| A | 7077 | 45 | 0.635863% |
| B | 7044 | 83 | 1.178308% |
| C | 7080 | 34 | 0.480226% |
| D | 7070 | 201 | 2.842999% |
Noise dominated data is calculated using 1-second bins in cleaned event files. If a bin has >2000 counts, and if more than 50% of those come from <1% of pixels, then it is considered to be noise-dominated and hence unusable.
| Quadrant | # 1 sec bins | Bins with >0 counts | Bins with >2000 counts | High rate bins dominated by noise | Noise dominated (total time) | Noise dominated (detector-on time) | Marked lightcurve |
|---|---|---|---|---|---|---|---|
| A | 7640 | 7124 | 0 | 0 | 0.00% | 0.00% | 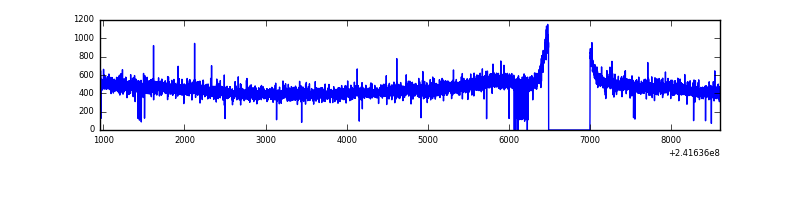 |
| B | 7640 | 7094 | 19 | 19 | 0.25% | 0.27% | 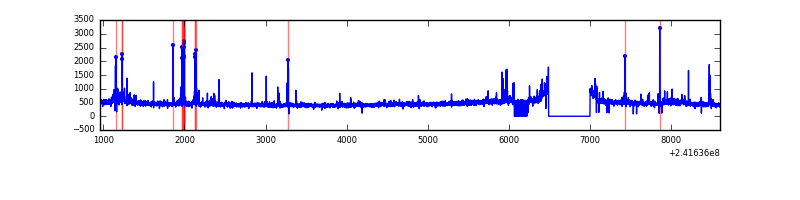 |
| C | 7640 | 7124 | 2 | 2 | 0.03% | 0.03% | 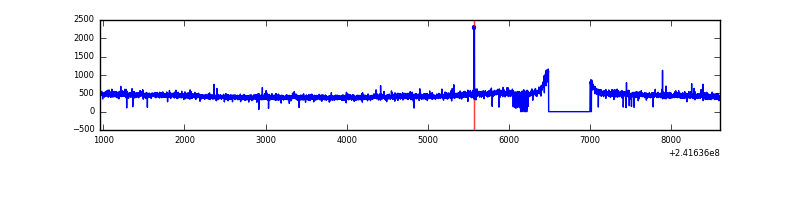 |
| D | 7640 | 7115 | 153 | 153 | 2.00% | 2.15% | 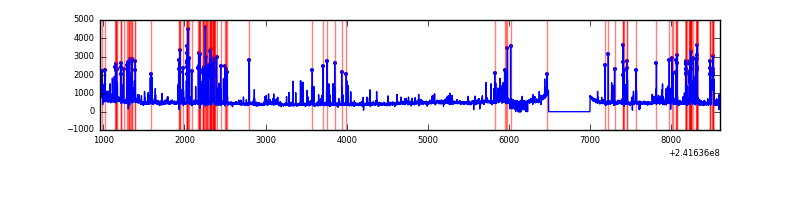 |
Top three noisy pixels from each quadrant. If the there are fewer than three noisy pixels in the level2.evt file, extra rows are filled as -1
| Pixel properties | Quadrant properties | ||||||
|---|---|---|---|---|---|---|---|
| Quadrant | DetID | PixID | Counts | Sigma | Mean | Median | Sigma |
| A | 8 | 15 | 53616 | 314.74 | 817 | 799 | 167.8 |
| A | 13 | 251 | 23039 | 132.53 | 817 | 799 | 167.8 |
| A | 0 | 226 | 7569 | 40.34 | 817 | 799 | 167.8 |
| B | 4 | 239 | 155851 | 984.99 | 813 | 794 | 157.4 |
| B | 11 | 51 | 43637 | 272.16 | 813 | 794 | 157.4 |
| B | 0 | 214 | 36913 | 229.44 | 813 | 794 | 157.4 |
| C | 14 | 234 | 10574 | 52.73 | 800 | 806 | 185.3 |
| C | 13 | 61 | 6038 | 28.24 | 800 | 806 | 185.3 |
| C | 9 | 54 | 2421 | 8.72 | 800 | 806 | 185.3 |
| D | 1 | 52 | 660507 | 3436.09 | 790 | 769 | 192.0 |
| D | 1 | 20 | 118555 | 613.46 | 790 | 769 | 192.0 |
| D | 5 | 222 | 110874 | 573.46 | 790 | 769 | 192.0 |
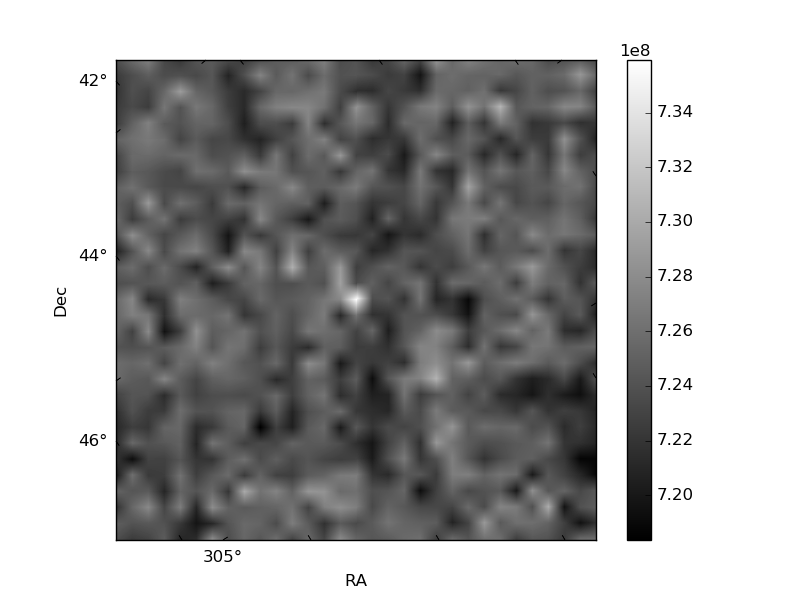
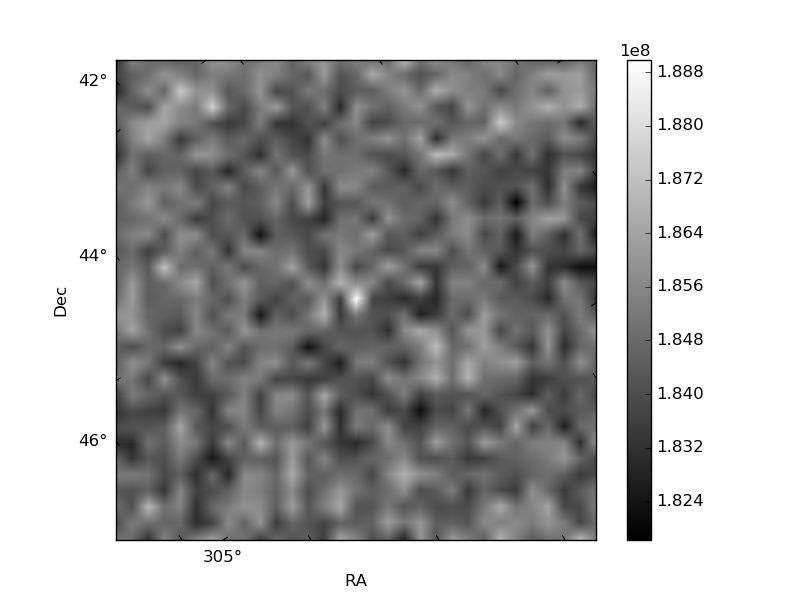
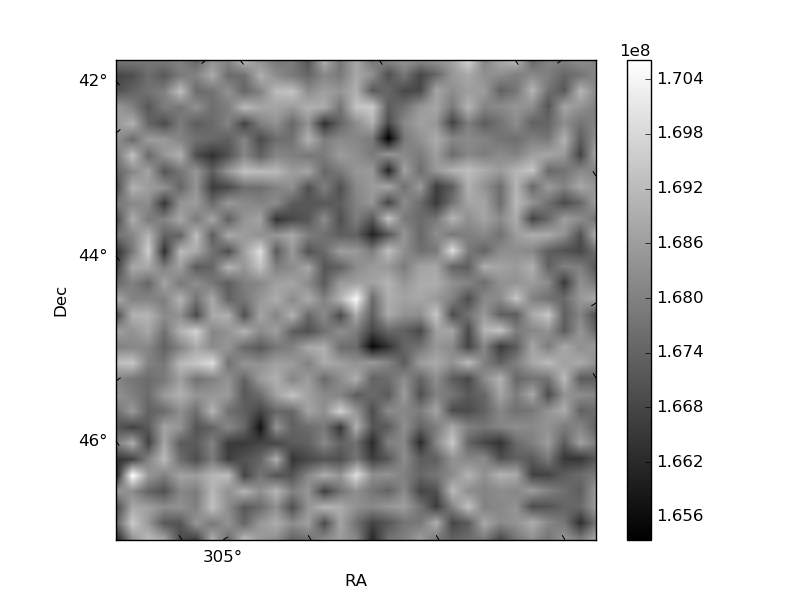
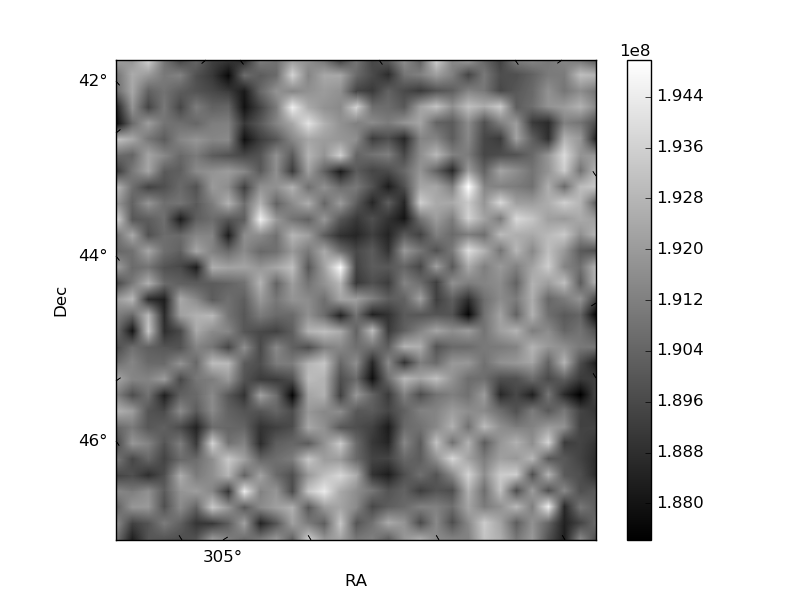
Histogram calculated using DETX and DETY for each event in the final _common_clean file
| Quadrant A | 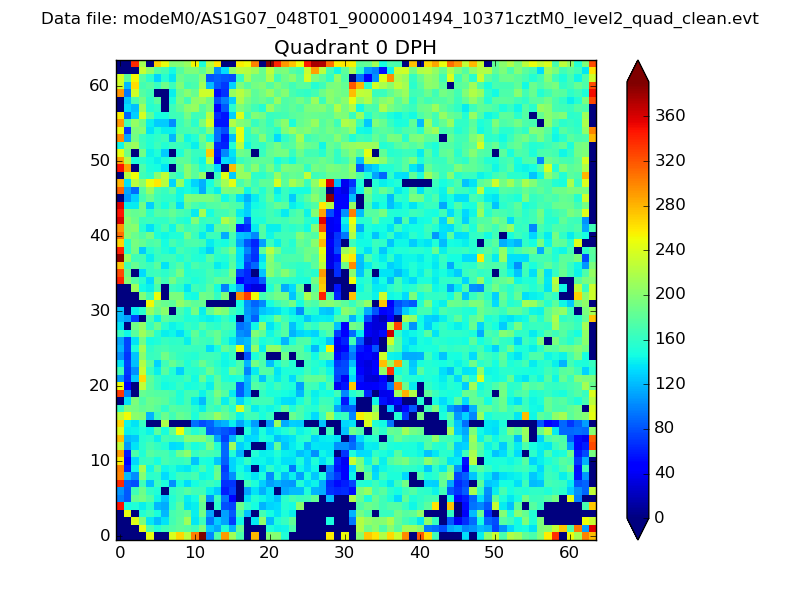 |
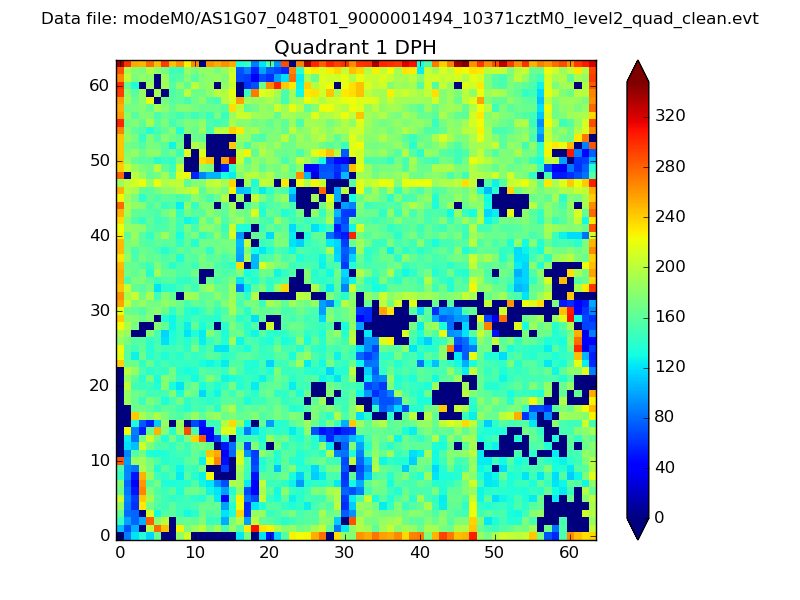 |
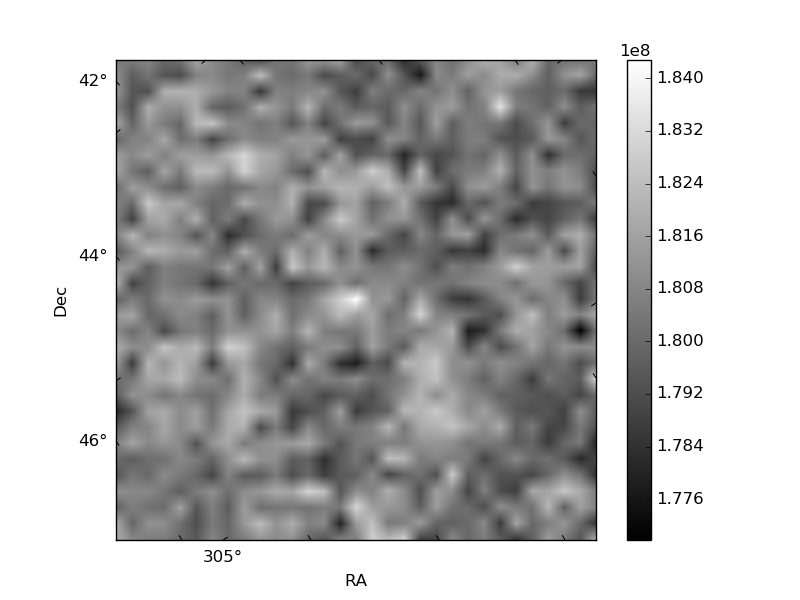
Quadrant B |
|---|---|---|---|
| Quadrant D | 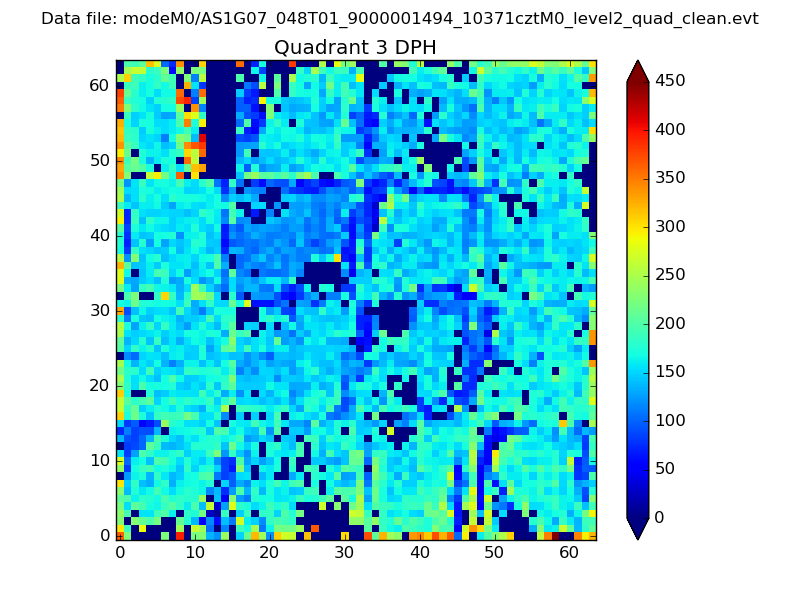 |
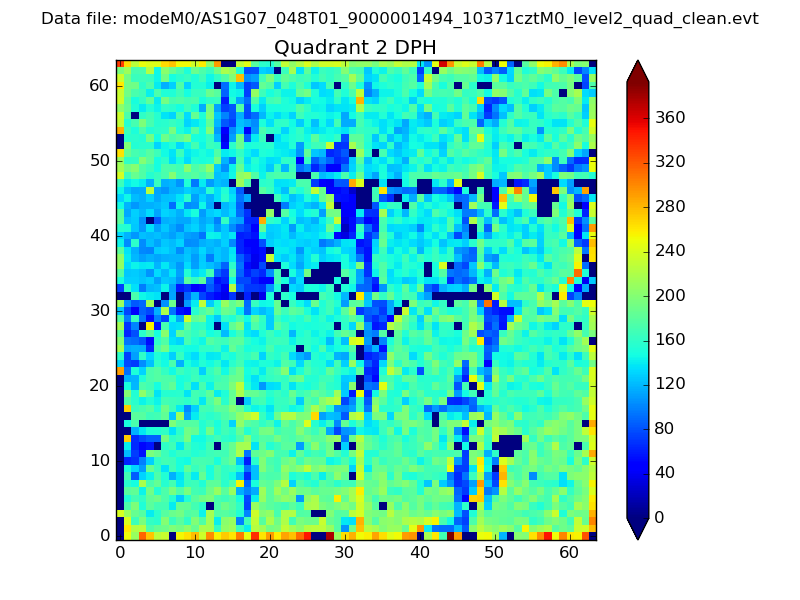 |
Quadrant C |
| Plot type | Count rate plots | Images |
|---|---|---|
| Comparison with Poisson distribution Blue bars denote a histogram of data divided into 1 sec bins. Red curve is a Poisson curve with rate = median count rate of data. |
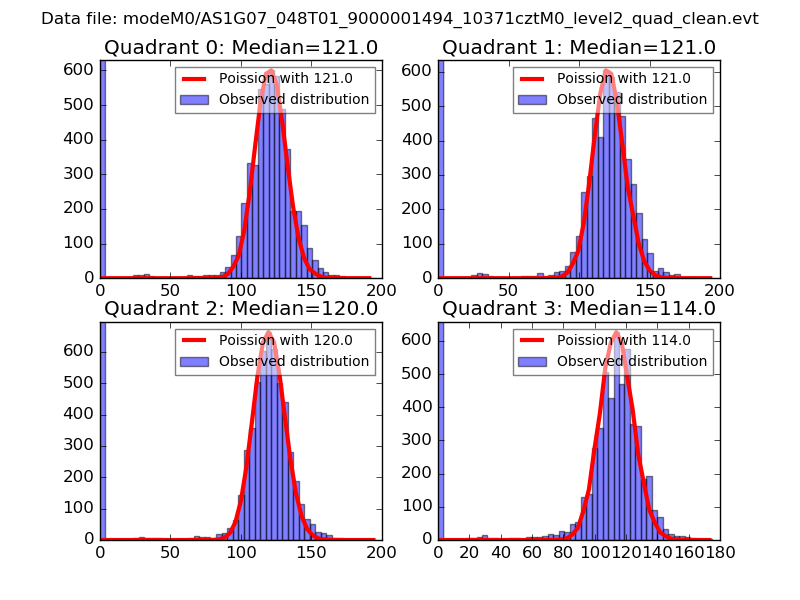 |
 |
| Quadrant-wise count rates Data is divided into 100 sec bins |
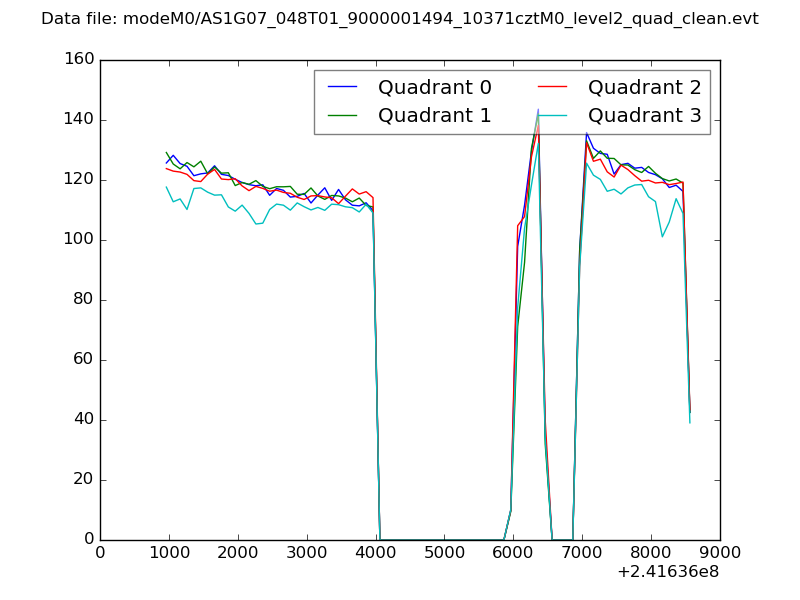 |
|
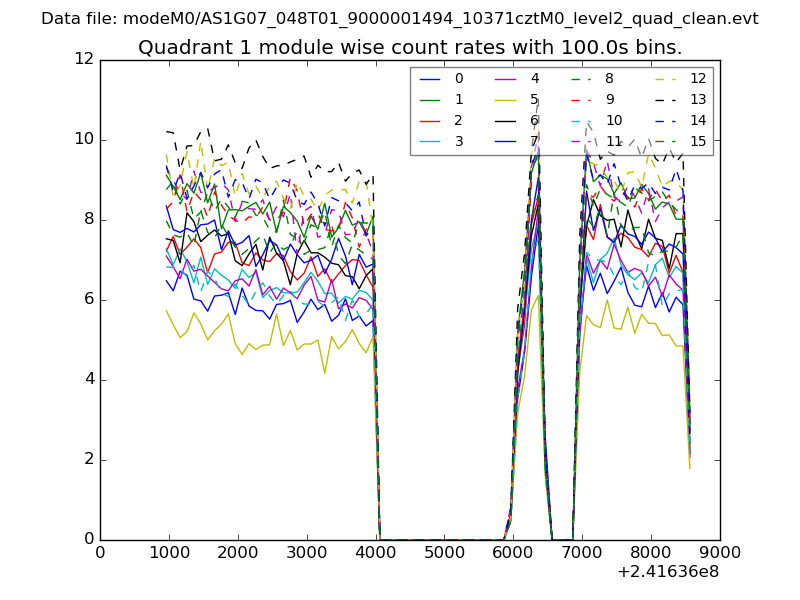
| Module-wise count rates for Quadrant A Data is divided into 100 sec bins |
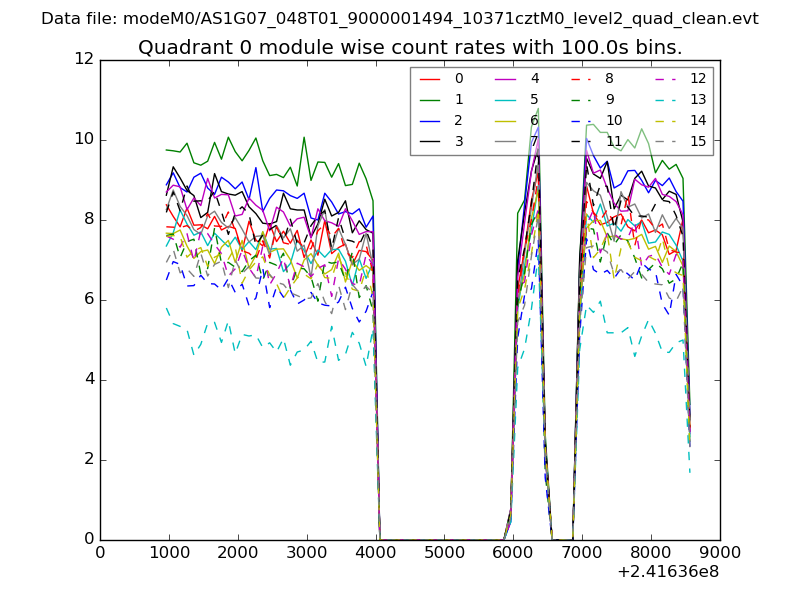 |
 |
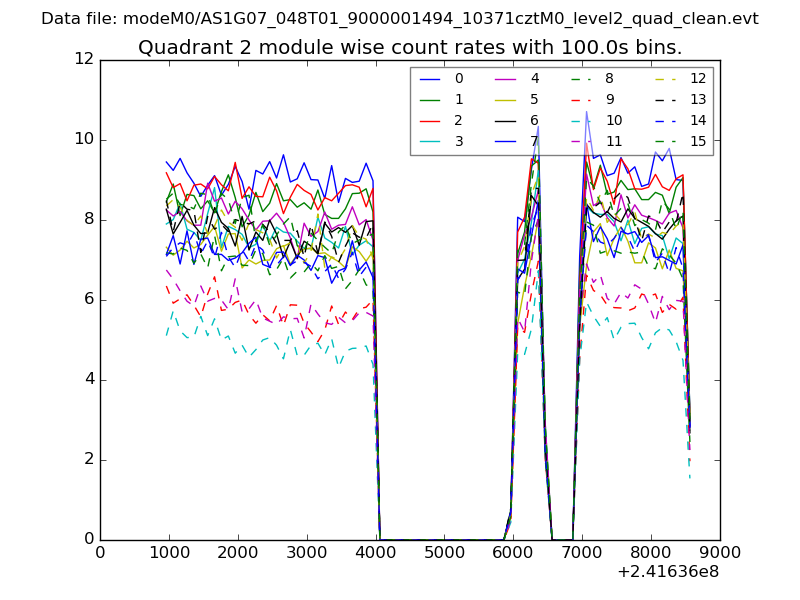
| Module-wise count rates for Quadrant B Data is divided into 100 sec bins |
 |
 |
| Module-wise count rates for Quadrant C Data is divided into 100 sec bins |
 |
 |
| Module-wise count rates for Quadrant D Data is divided into 100 sec bins |
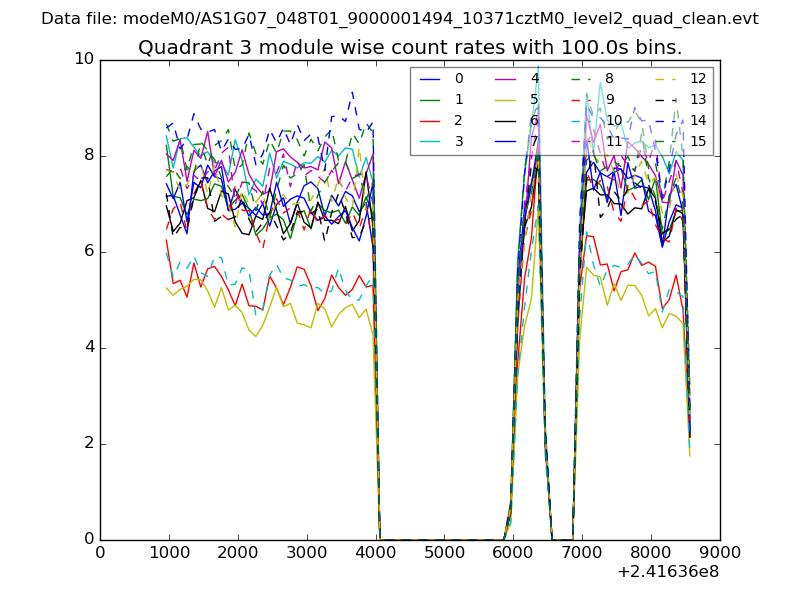 |
 |
| Parameter | Plot |
|---|---|
| CZT HV Monitor | 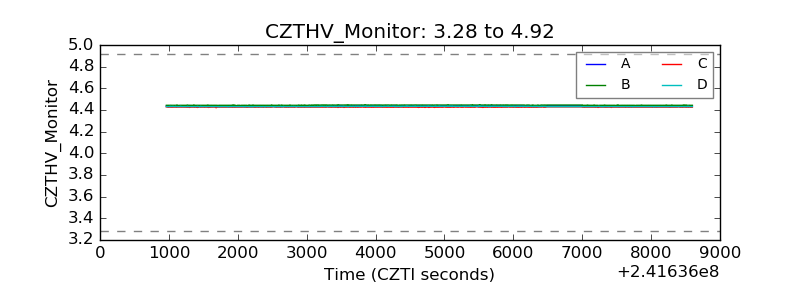 |
| D_VDD | 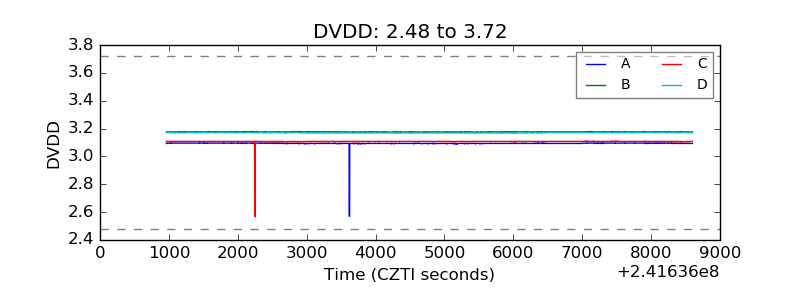 |
| Temperature 1 |  |
| Veto HV Monitor | 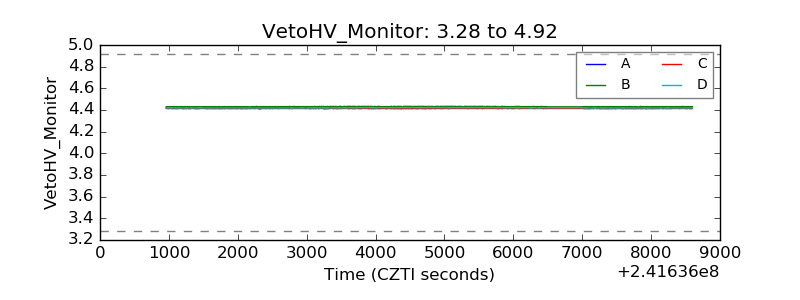 |
| Veto LLD | 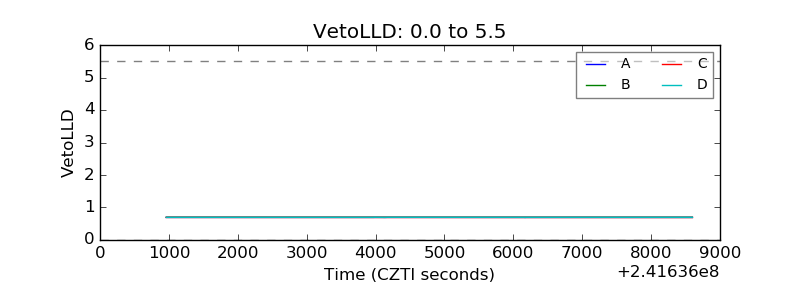 |
| Alpha Counter | 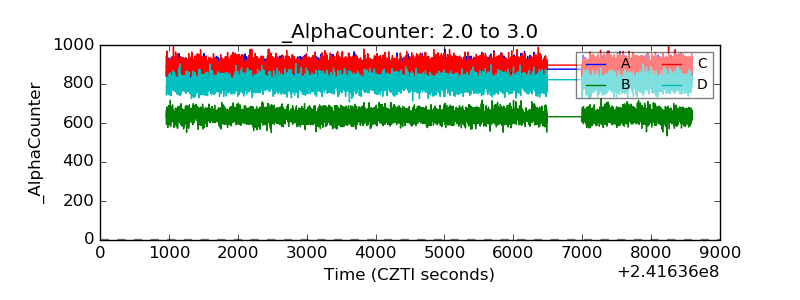 |
| _CPM_Rate | 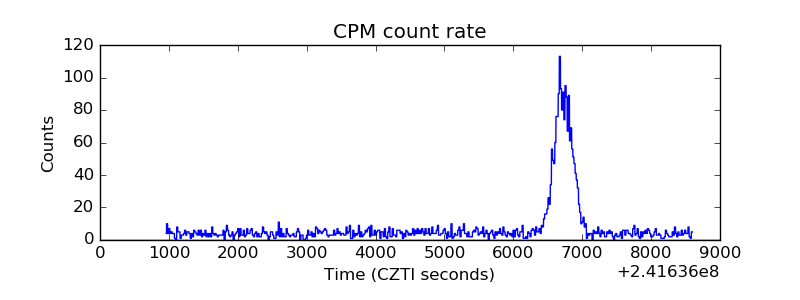 |
| CZT Counter | 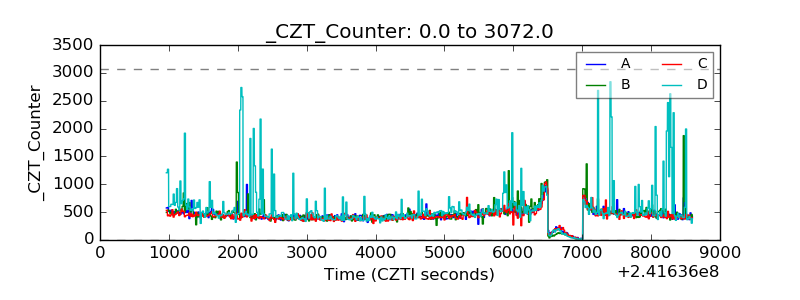 |
| +2.5 Volts monitor |  |
| +5 Volts monitor |  |
| _ROLL_ROT | 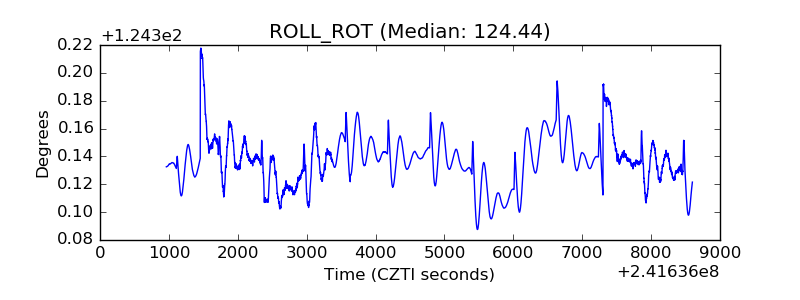 |
| _Roll_DEC | 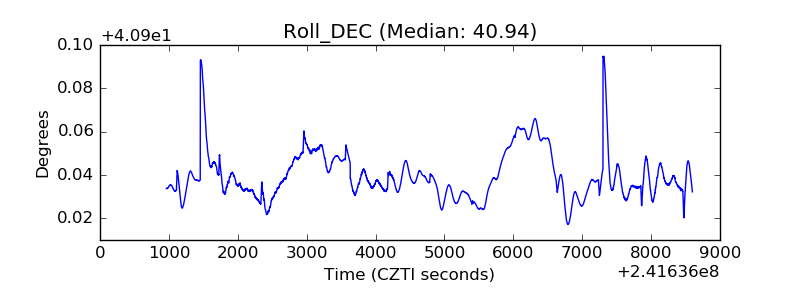 |
| _Roll_RA | 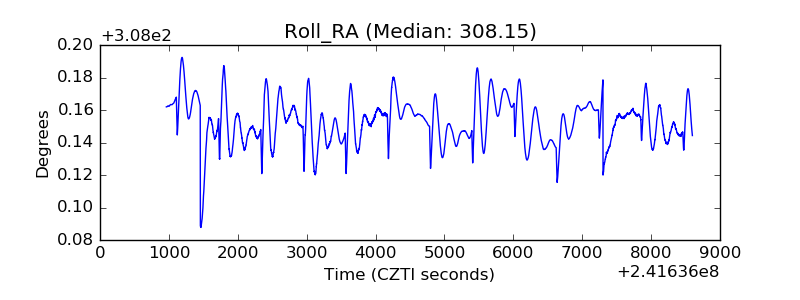 |
| Veto Counter | 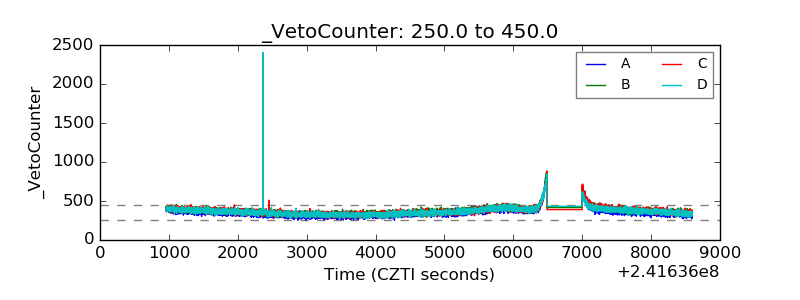 |