| Param | Original file | Final file |
|---|---|---|
| Filename | modeM0/AS1A03_119T02_9000001496_10372cztM0_level2.evt | modeM0/AS1A03_119T02_9000001496_10372cztM0_level2_quad_clean.evt |
| Size (bytes) | 482,132,160 | 127,051,200 |
| Size | 459.8 MB | 121.2 MB |
| Events in quadrant A | 3,304,794 | 837,675 |
| Events in quadrant B | 3,638,810 | 850,134 |
| Events in quadrant C | 3,211,079 | 848,390 |
| Events in quadrant D | 3,953,841 | 807,002 |
| Mode M9 | |||
|---|---|---|---|
| Quadrant | BADHDUFLAG | Total packets | Discarded packets |
| A | 0 | 15 | 0 |
| B | 0 | 15 | 0 |
| C | 0 | 15 | 1 |
| D | 0 | 15 | 0 |
| Mode M0 | |||
|---|---|---|---|
| Quadrant | BADHDUFLAG | Total packets | Discarded packets |
| A | 0 | 14907 | 9 |
| B | 0 | 15742 | 15 |
| C | 0 | 14713 | 8 |
| D | 0 | 16680 | 10 |
| Mode SS | |||
|---|---|---|---|
| Quadrant | BADHDUFLAG | Total packets | Discarded packets |
| A | 0 | 150 | 0 |
| B | 0 | 150 | 0 |
| C | 0 | 150 | 0 |
| D | 0 | 150 | 0 |
| Quadrant | Total seconds | Saturated seconds | Saturation percentage |
|---|---|---|---|
| A | 7251 | 59 | 0.813681% |
| B | 7248 | 117 | 1.614238% |
| C | 7251 | 34 | 0.468901% |
| D | 7250 | 97 | 1.337931% |
Noise dominated data is calculated using 1-second bins in cleaned event files. If a bin has >2000 counts, and if more than 50% of those come from <1% of pixels, then it is considered to be noise-dominated and hence unusable.
| Quadrant | # 1 sec bins | Bins with >0 counts | Bins with >2000 counts | High rate bins dominated by noise | Noise dominated (total time) | Noise dominated (detector-on time) | Marked lightcurve |
|---|---|---|---|---|---|---|---|
| A | 8809 | 7255 | 1 | 1 | 0.01% | 0.01% | 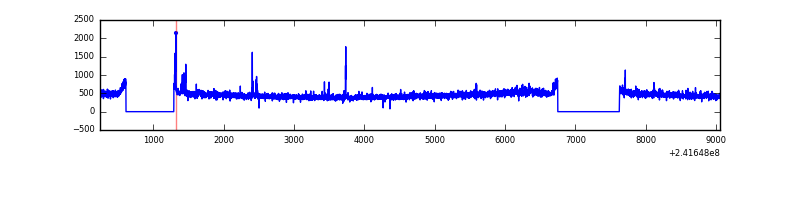 |
| B | 8809 | 7254 | 27 | 27 | 0.31% | 0.37% | 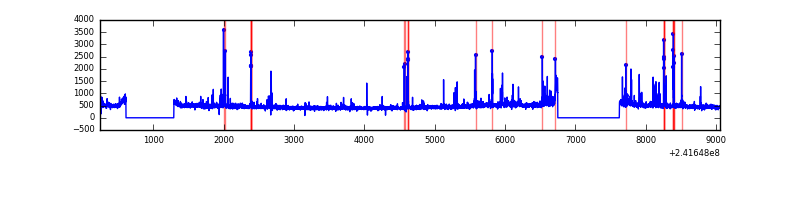 |
| C | 8809 | 7256 | 1 | 1 | 0.01% | 0.01% | 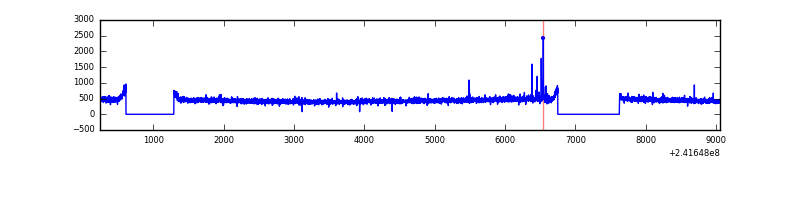 |
| D | 8809 | 7255 | 58 | 58 | 0.66% | 0.80% | 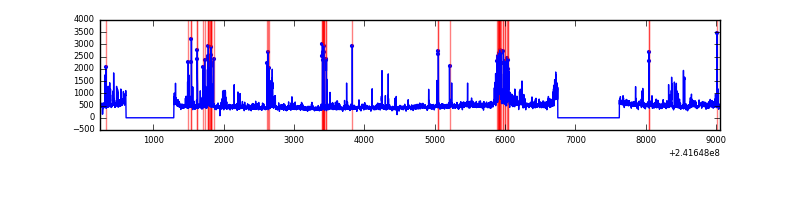 |
Top three noisy pixels from each quadrant. If the there are fewer than three noisy pixels in the level2.evt file, extra rows are filled as -1
| Pixel properties | Quadrant properties | ||||||
|---|---|---|---|---|---|---|---|
| Quadrant | DetID | PixID | Counts | Sigma | Mean | Median | Sigma |
| A | 13 | 251 | 37418 | 215.5 | 834 | 813 | 169.9 |
| A | 15 | 174 | 34107 | 196.01 | 834 | 813 | 169.9 |
| A | 3 | 1 | 9590 | 51.67 | 834 | 813 | 169.9 |
| B | 4 | 239 | 211689 | 1301.07 | 839 | 816 | 162.1 |
| B | 0 | 214 | 61213 | 372.64 | 839 | 816 | 162.1 |
| B | 0 | 219 | 35074 | 211.37 | 839 | 816 | 162.1 |
| C | 15 | 48 | 19340 | 97.84 | 816 | 820 | 189.3 |
| C | 14 | 234 | 6288 | 28.89 | 816 | 820 | 189.3 |
| C | 13 | 61 | 6054 | 27.65 | 816 | 820 | 189.3 |
| D | 1 | 52 | 263505 | 1356.5 | 805 | 783 | 193.7 |
| D | 2 | 33 | 179691 | 923.75 | 805 | 783 | 193.7 |
| D | 1 | 20 | 134861 | 692.28 | 805 | 783 | 193.7 |
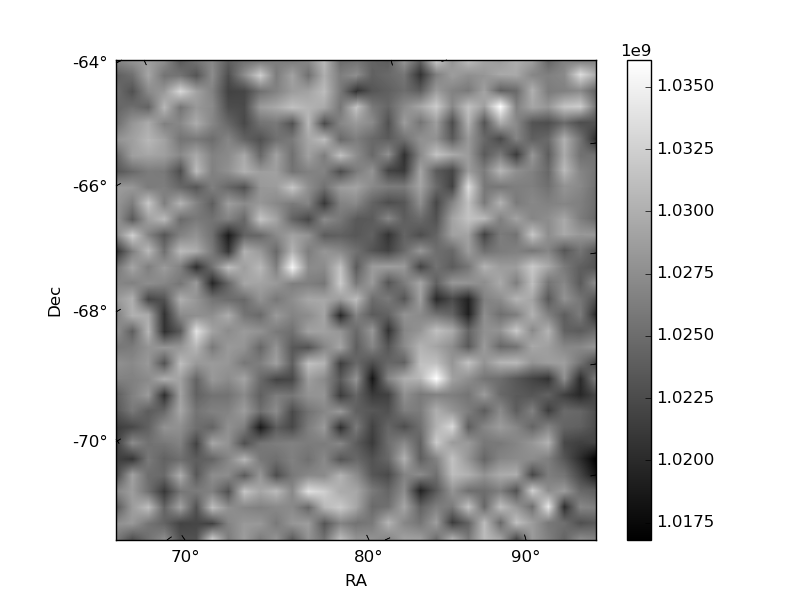
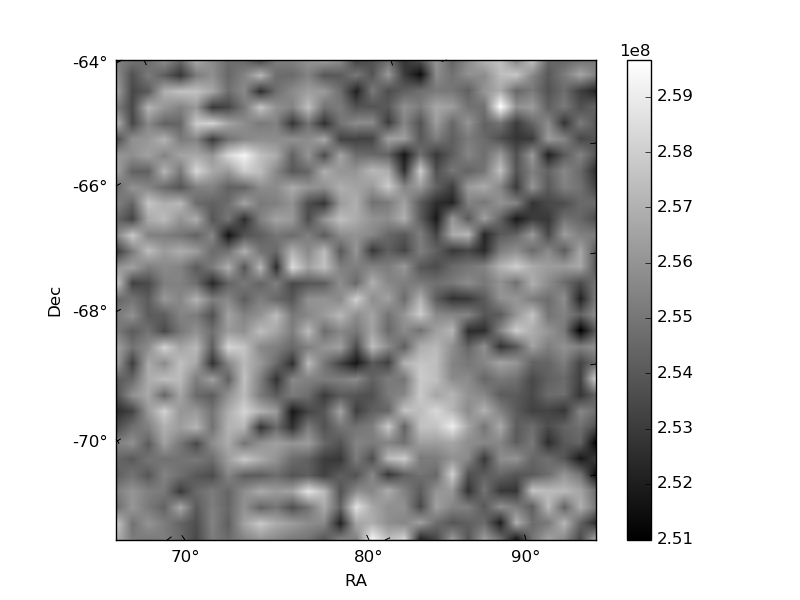
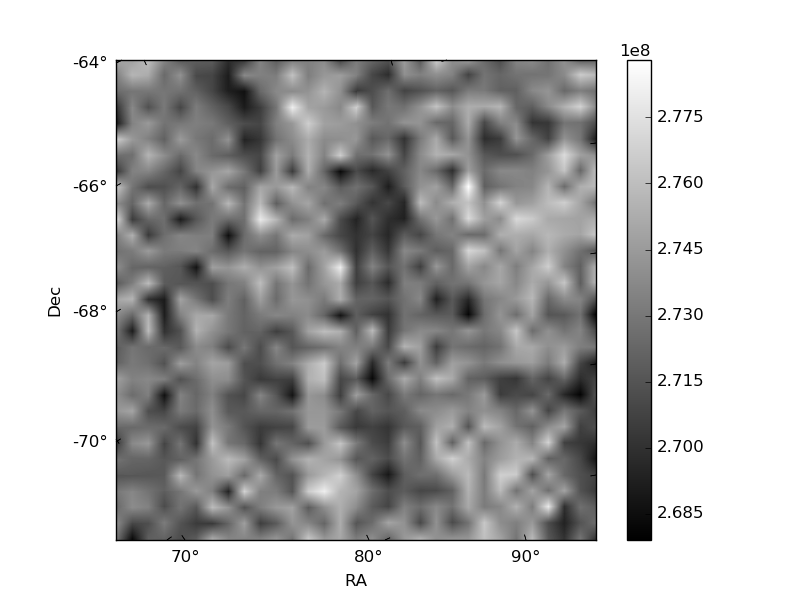
Histogram calculated using DETX and DETY for each event in the final _common_clean file
| Quadrant A | 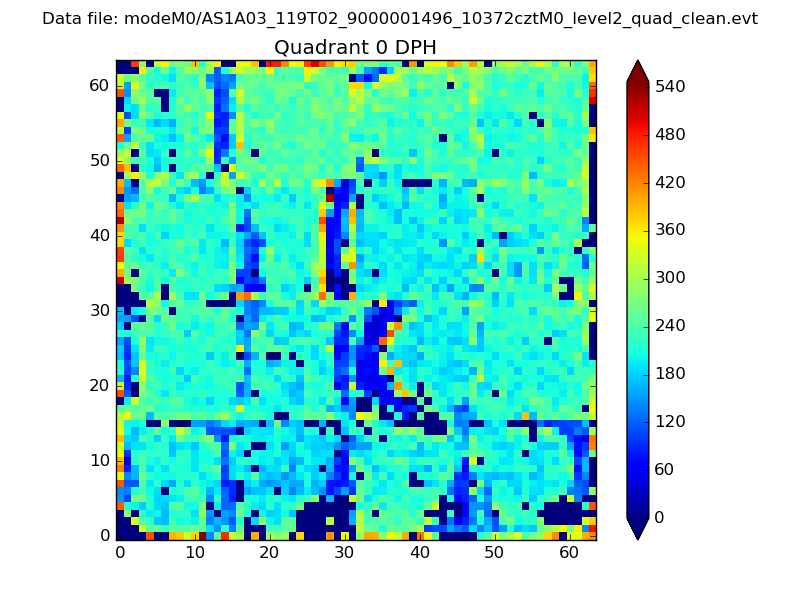 |
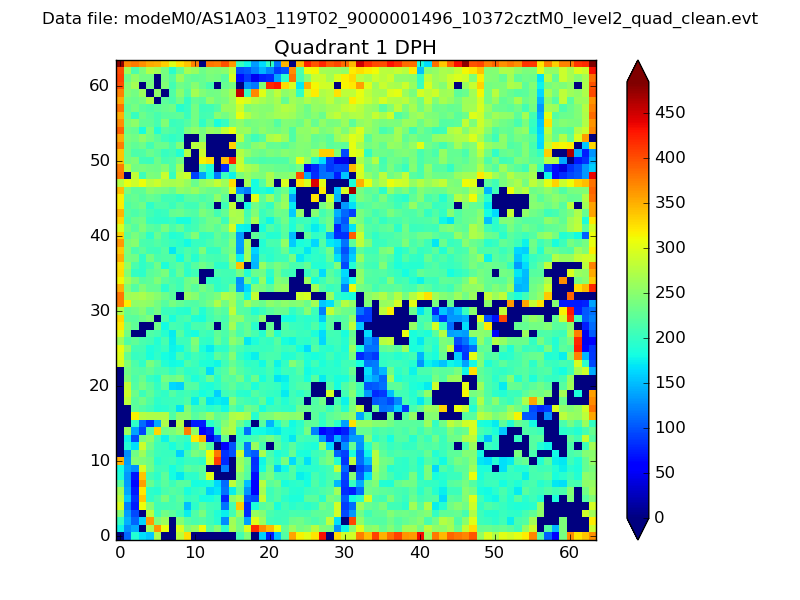 |
Quadrant B |
|---|---|---|---|
| Quadrant D | 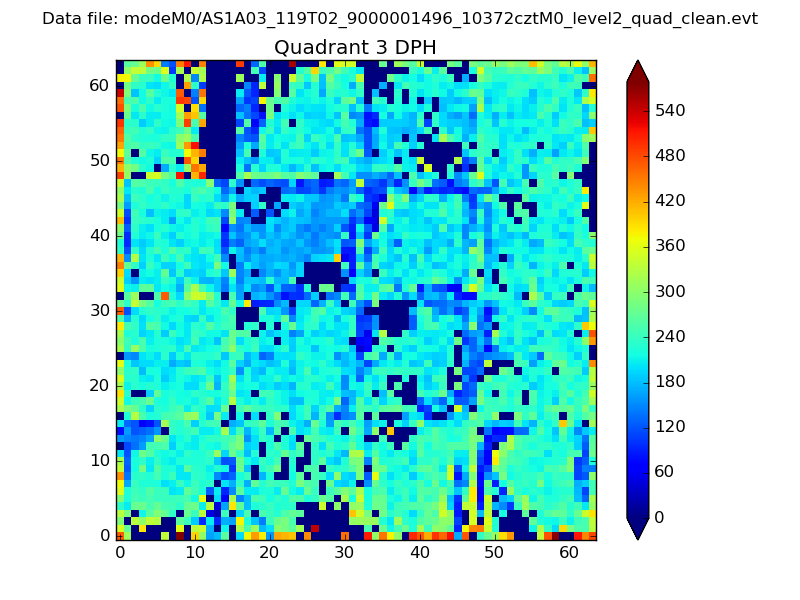 |
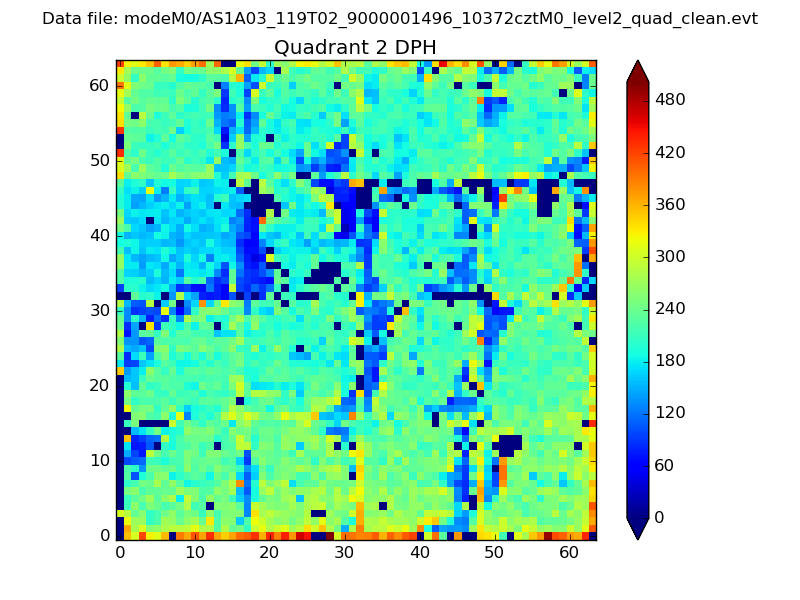 |
Quadrant C |
| Plot type | Count rate plots | Images |
|---|---|---|
| Comparison with Poisson distribution Blue bars denote a histogram of data divided into 1 sec bins. Red curve is a Poisson curve with rate = median count rate of data. |
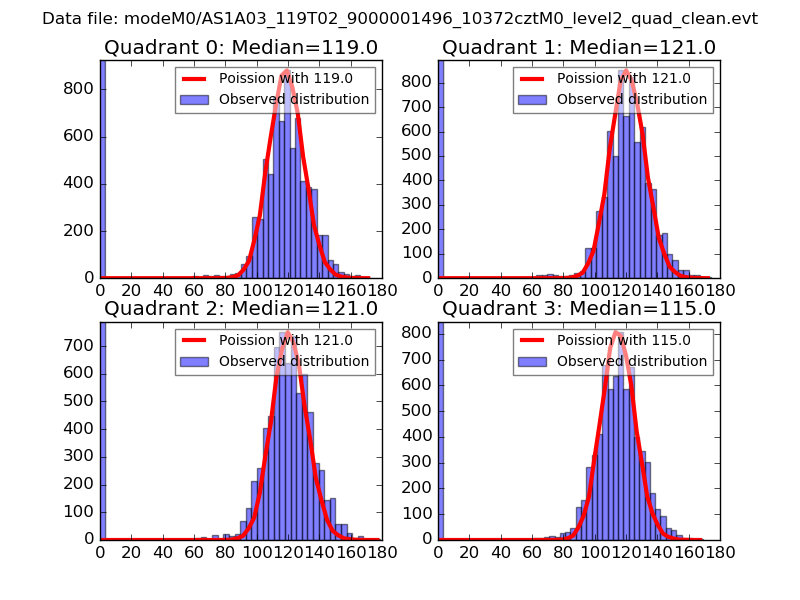 |
 |
| Quadrant-wise count rates Data is divided into 100 sec bins |
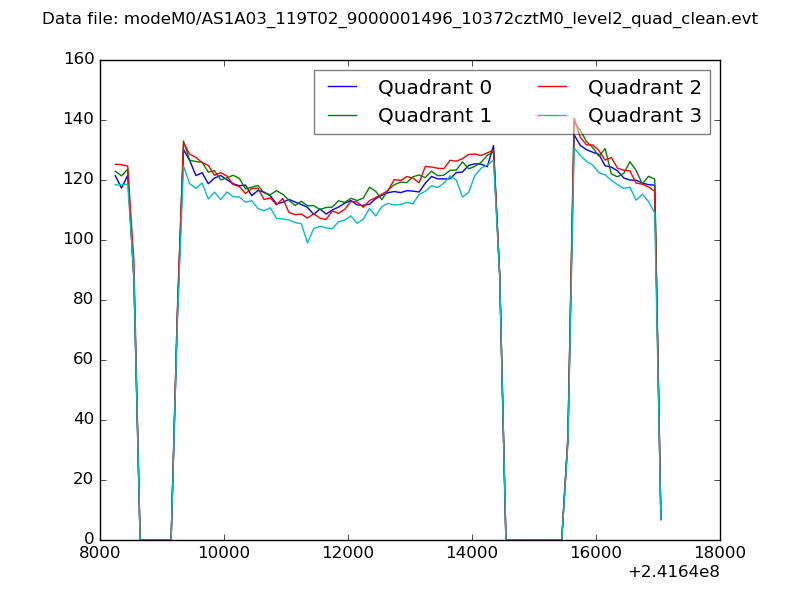 |
|
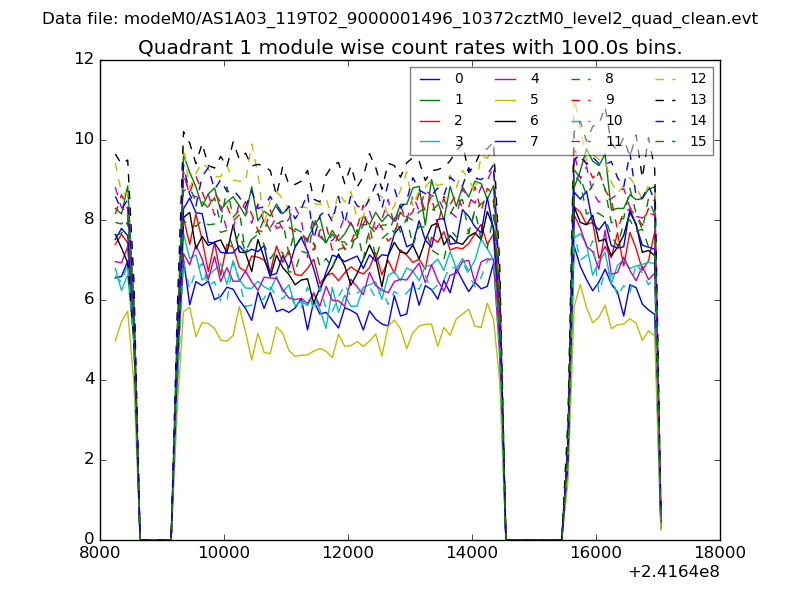
| Module-wise count rates for Quadrant A Data is divided into 100 sec bins |
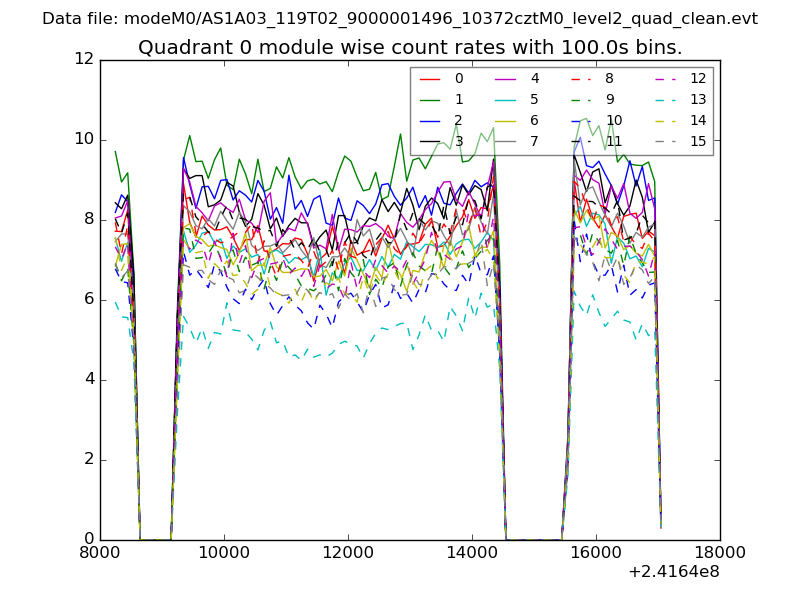 |
 |
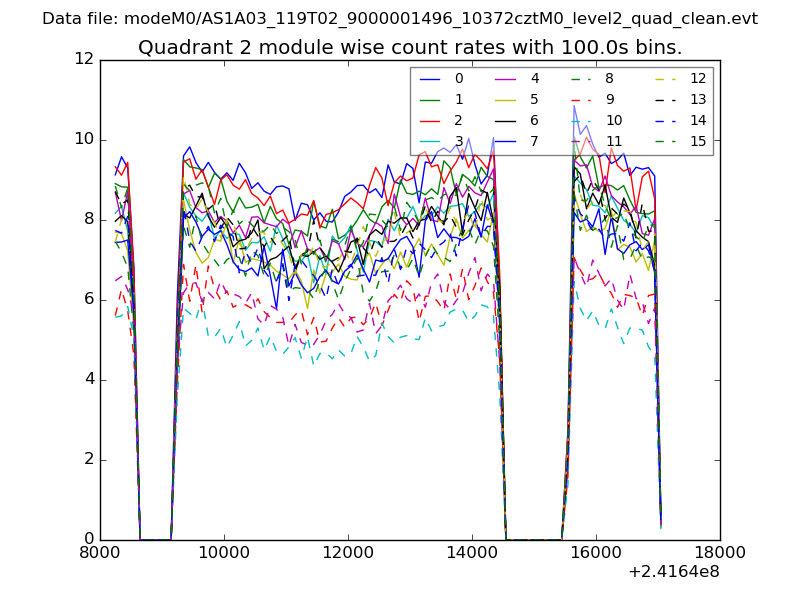
| Module-wise count rates for Quadrant B Data is divided into 100 sec bins |
 |
 |
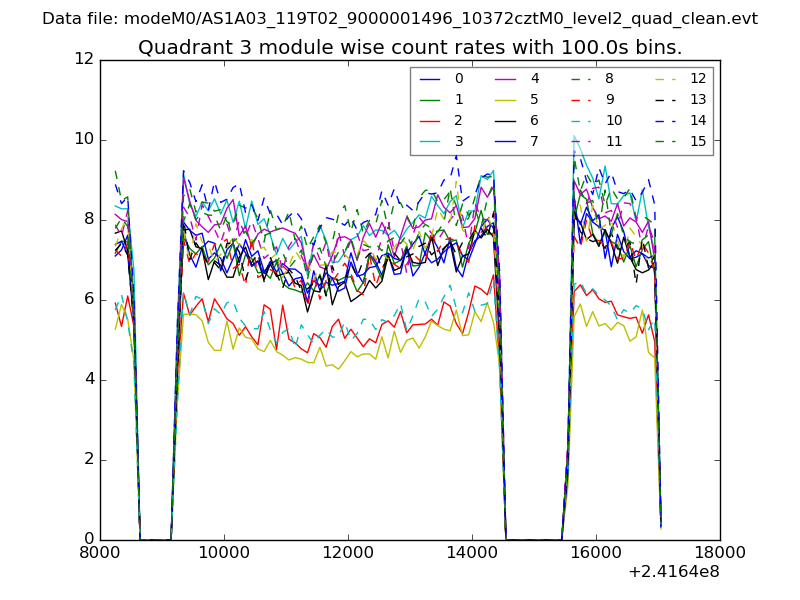
| Module-wise count rates for Quadrant C Data is divided into 100 sec bins |
 |
 |
| Module-wise count rates for Quadrant D Data is divided into 100 sec bins |
 |
 |
| Parameter | Plot |
|---|---|
| CZT HV Monitor | 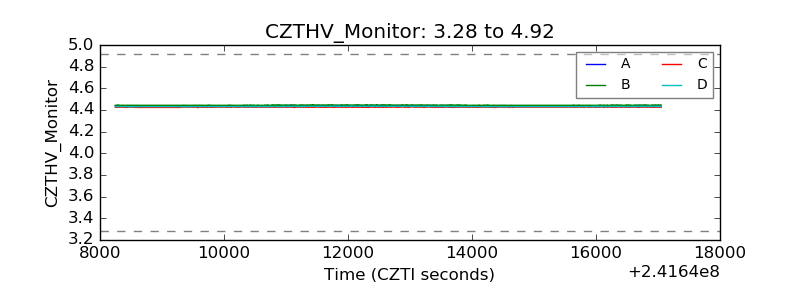 |
| D_VDD | 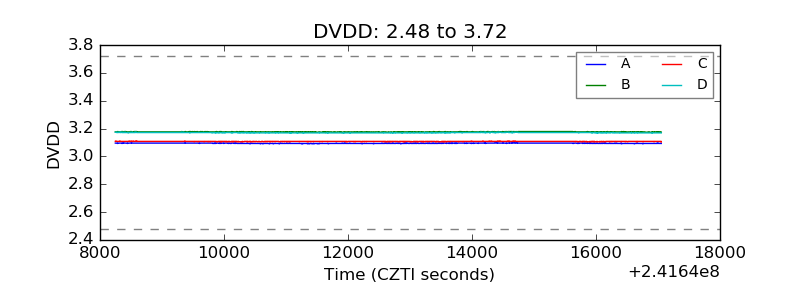 |
| Temperature 1 | 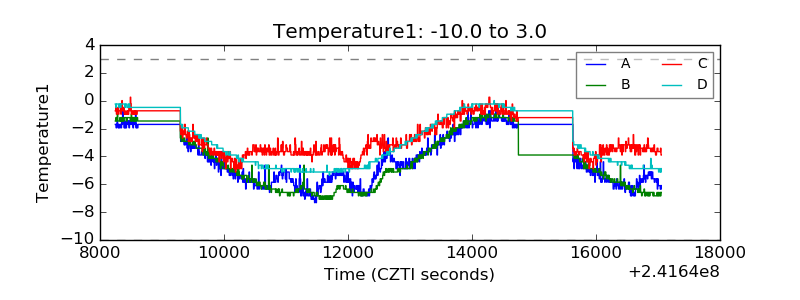 |
| Veto HV Monitor |  |
| Veto LLD | 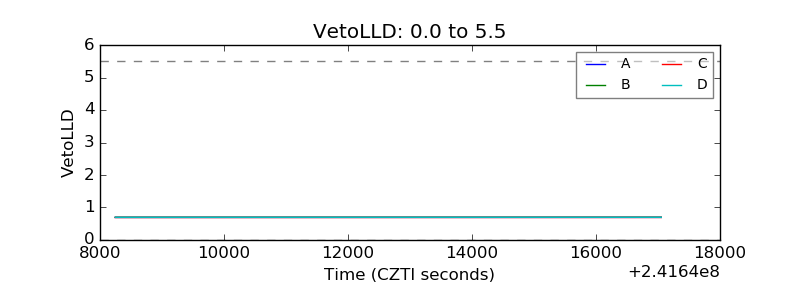 |
| Alpha Counter | 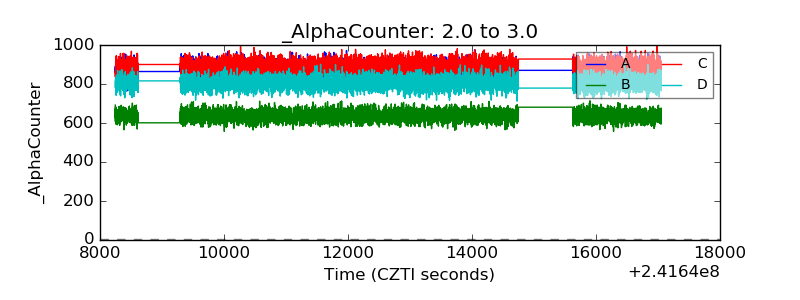 |
| _CPM_Rate | 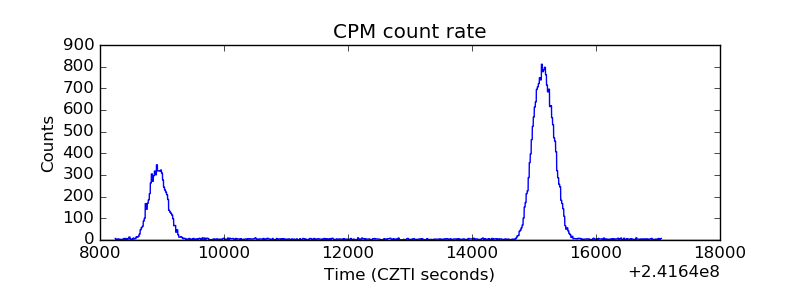 |
| CZT Counter |  |
| +2.5 Volts monitor |  |
| +5 Volts monitor |  |
| _ROLL_ROT | 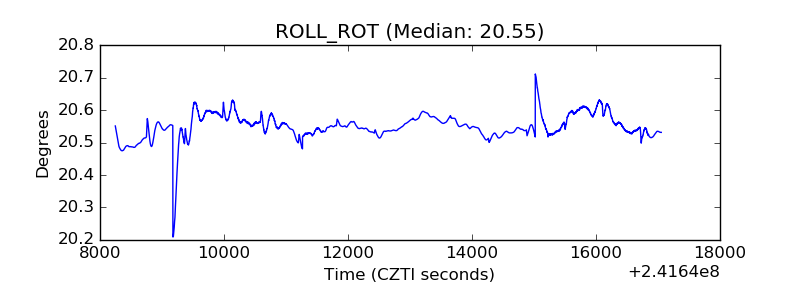 |
| _Roll_DEC | 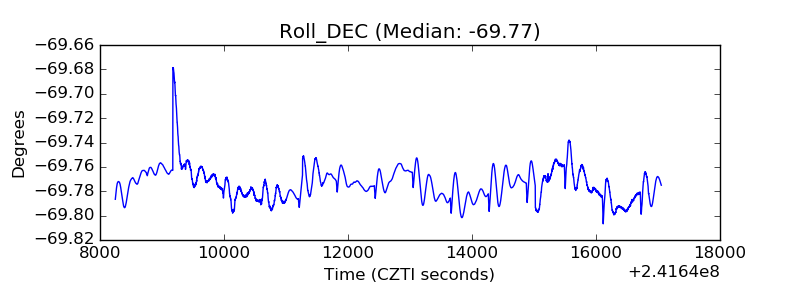 |
| _Roll_RA | 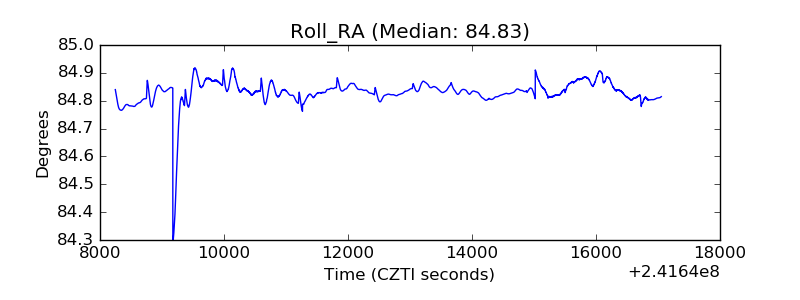 |
| Veto Counter | 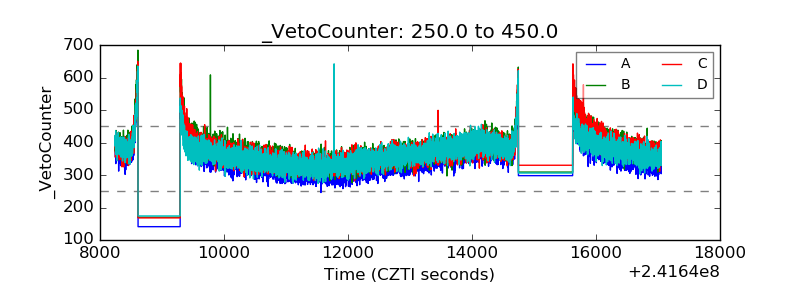 |