| Param | Original file | Final file |
|---|---|---|
| Filename | modeM0/AS1A03_119T02_9000001496_10373cztM0_level2.evt | modeM0/AS1A03_119T02_9000001496_10373cztM0_level2_quad_clean.evt |
| Size (bytes) | 399,470,400 | 102,576,960 |
| Size | 381.0 MB | 97.8 MB |
| Events in quadrant A | 2,807,662 | 691,170 |
| Events in quadrant B | 2,960,297 | 659,894 |
| Events in quadrant C | 2,799,513 | 700,032 |
| Events in quadrant D | 3,110,794 | 625,898 |
| Mode M9 | |||
|---|---|---|---|
| Quadrant | BADHDUFLAG | Total packets | Discarded packets |
| A | 0 | 29 | 9 |
| B | 0 | 31 | 11 |
| C | 0 | 31 | 11 |
| D | 0 | 29 | 9 |
| Mode M0 | |||
|---|---|---|---|
| Quadrant | BADHDUFLAG | Total packets | Discarded packets |
| A | 0 | 22963 | 10264 |
| B | 0 | 25434 | 12685 |
| C | 0 | 23652 | 10980 |
| D | 0 | 26695 | 13923 |
| Mode SS | |||
|---|---|---|---|
| Quadrant | BADHDUFLAG | Total packets | Discarded packets |
| A | 0 | 234 | 98 |
| B | 0 | 234 | 93 |
| C | 0 | 234 | 101 |
| D | 0 | 229 | 90 |
| Quadrant | Total seconds | Saturated seconds | Saturation percentage |
|---|---|---|---|
| A | 6292 | 29 | 0.460903% |
| B | 5979 | 68 | 1.137314% |
| C | 6288 | 19 | 0.302163% |
| D | 5948 | 32 | 0.537996% |
Noise dominated data is calculated using 1-second bins in cleaned event files. If a bin has >2000 counts, and if more than 50% of those come from <1% of pixels, then it is considered to be noise-dominated and hence unusable.
| Quadrant | # 1 sec bins | Bins with >0 counts | Bins with >2000 counts | High rate bins dominated by noise | Noise dominated (total time) | Noise dominated (detector-on time) | Marked lightcurve |
|---|---|---|---|---|---|---|---|
| A | 9046 | 6957 | 0 | 0 | 0.00% | 0.00% | 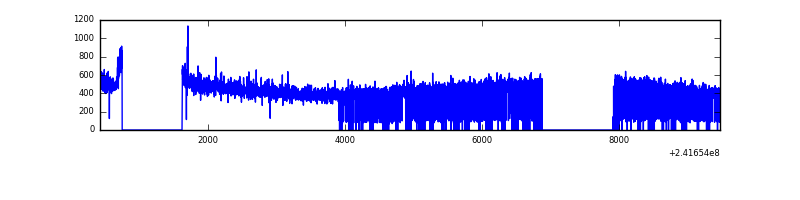 |
| B | 9046 | 6690 | 16 | 16 | 0.18% | 0.24% |  |
| C | 9045 | 6951 | 1 | 1 | 0.01% | 0.01% |  |
| D | 9045 | 6444 | 3 | 3 | 0.03% | 0.05% | 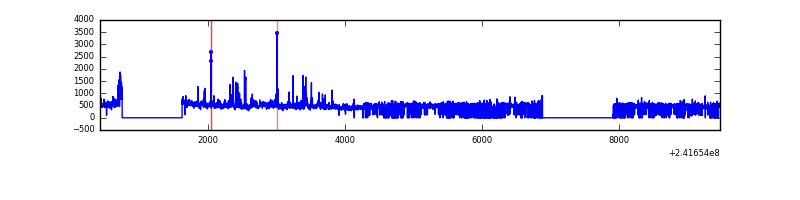 |
Top three noisy pixels from each quadrant. If the there are fewer than three noisy pixels in the level2.evt file, extra rows are filled as -1
| Pixel properties | Quadrant properties | ||||||
|---|---|---|---|---|---|---|---|
| Quadrant | DetID | PixID | Counts | Sigma | Mean | Median | Sigma |
| A | 13 | 251 | 15570 | 100.69 | 722 | 704 | 147.6 |
| A | 0 | 226 | 6434 | 38.81 | 722 | 704 | 147.6 |
| A | 12 | 194 | 5837 | 34.77 | 722 | 704 | 147.6 |
| B | 4 | 239 | 150493 | 1147.69 | 686 | 669 | 130.5 |
| B | 0 | 214 | 71641 | 543.66 | 686 | 669 | 130.5 |
| B | 0 | 219 | 26052 | 194.44 | 686 | 669 | 130.5 |
| C | 15 | 48 | 14921 | 86.45 | 712 | 717 | 164.3 |
| C | 14 | 234 | 6464 | 34.98 | 712 | 717 | 164.3 |
| C | 13 | 61 | 5468 | 28.92 | 712 | 717 | 164.3 |
| D | 8 | 195 | 228416 | 1449.83 | 660 | 641 | 157.1 |
| D | 1 | 20 | 138296 | 876.2 | 660 | 641 | 157.1 |
| D | 1 | 52 | 83692 | 528.64 | 660 | 641 | 157.1 |
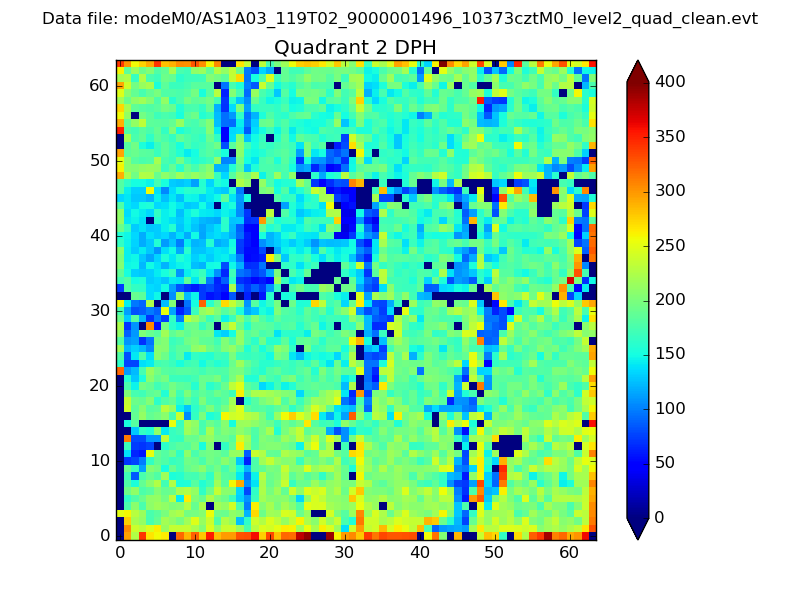
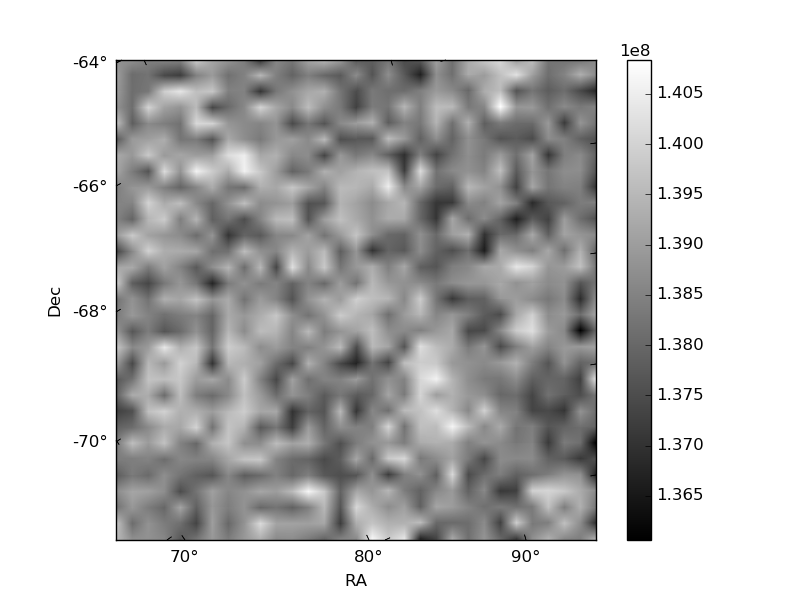
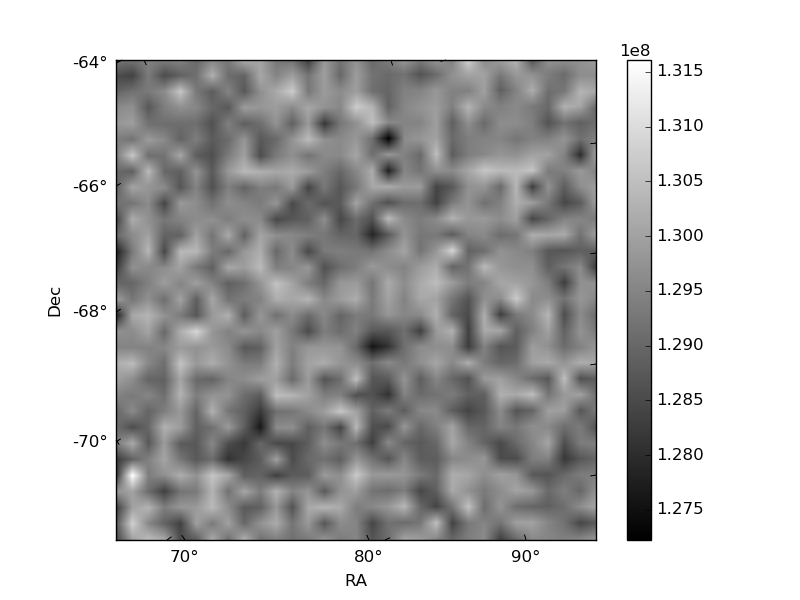
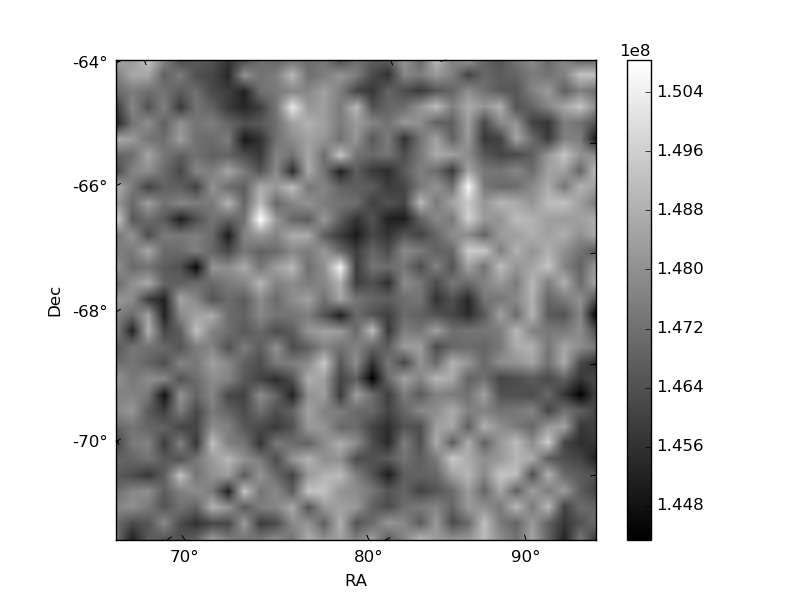
Histogram calculated using DETX and DETY for each event in the final _common_clean file
| Quadrant A | 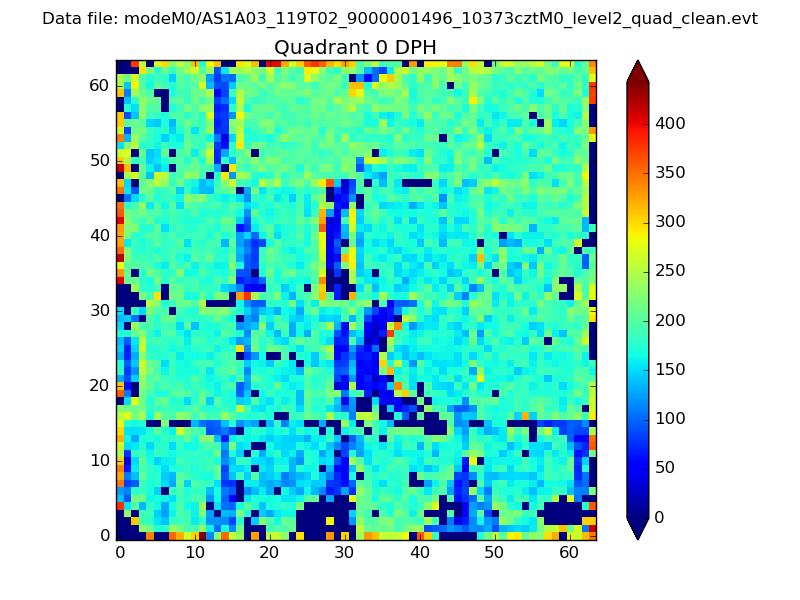 |
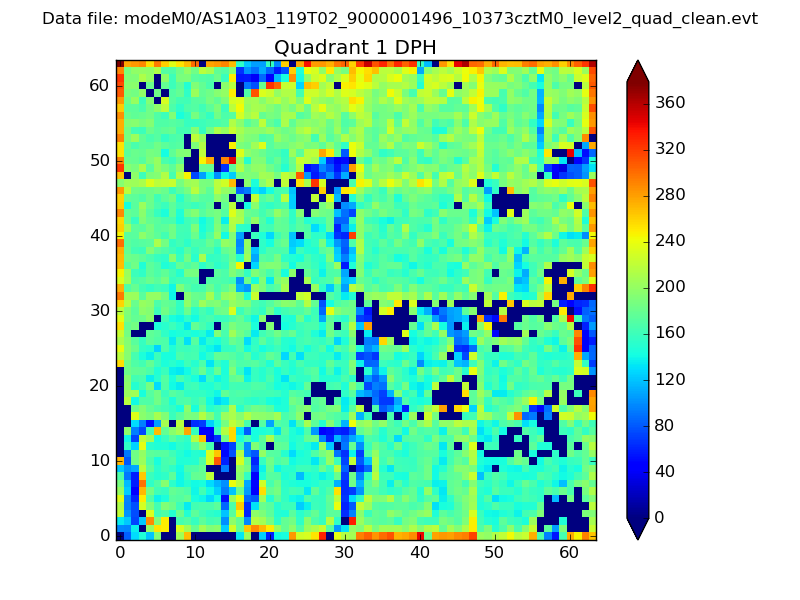 |
Quadrant B |
|---|---|---|---|
| Quadrant D | 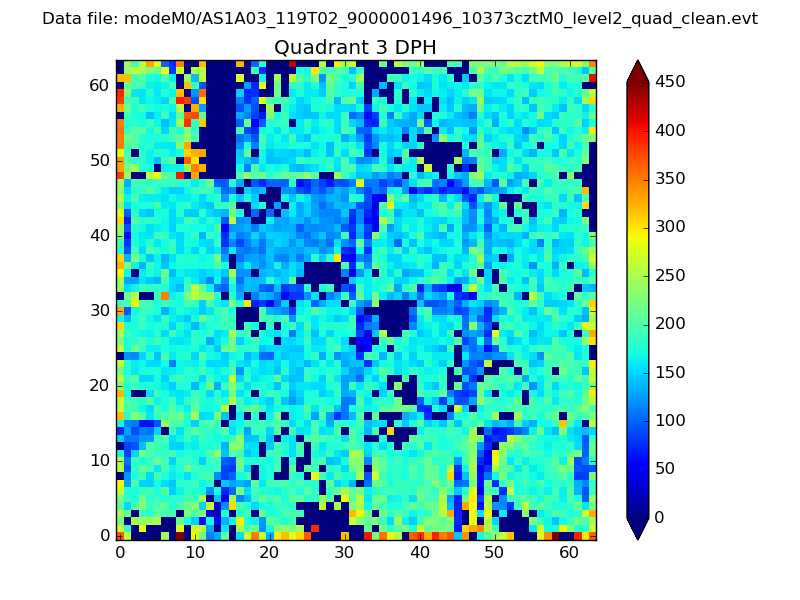 |
 |
Quadrant C |
| Plot type | Count rate plots | Images |
|---|---|---|
| Comparison with Poisson distribution Blue bars denote a histogram of data divided into 1 sec bins. Red curve is a Poisson curve with rate = median count rate of data. |
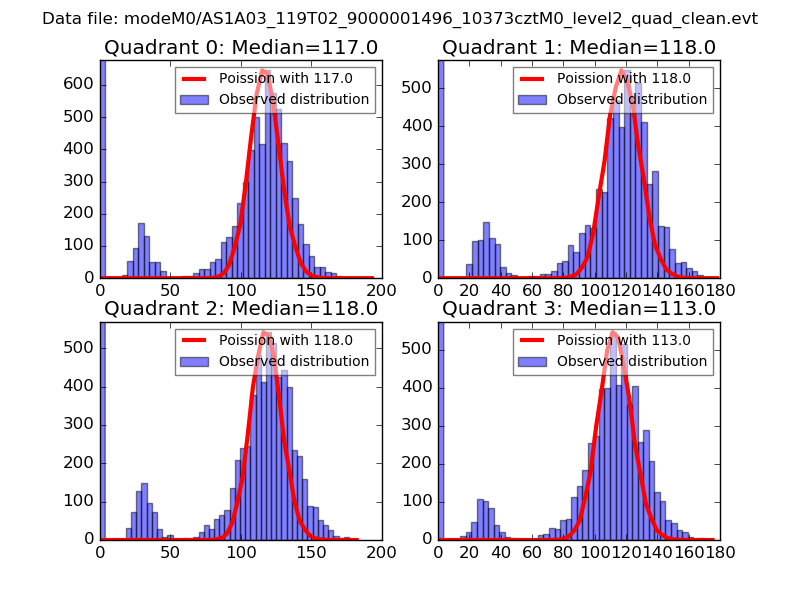 |
 |
| Quadrant-wise count rates Data is divided into 100 sec bins |
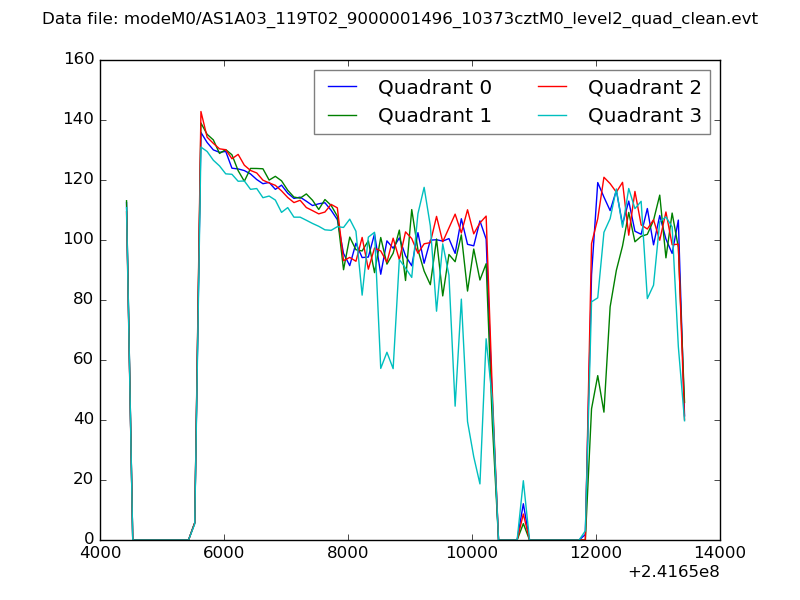 |
|
| Module-wise count rates for Quadrant A Data is divided into 100 sec bins |
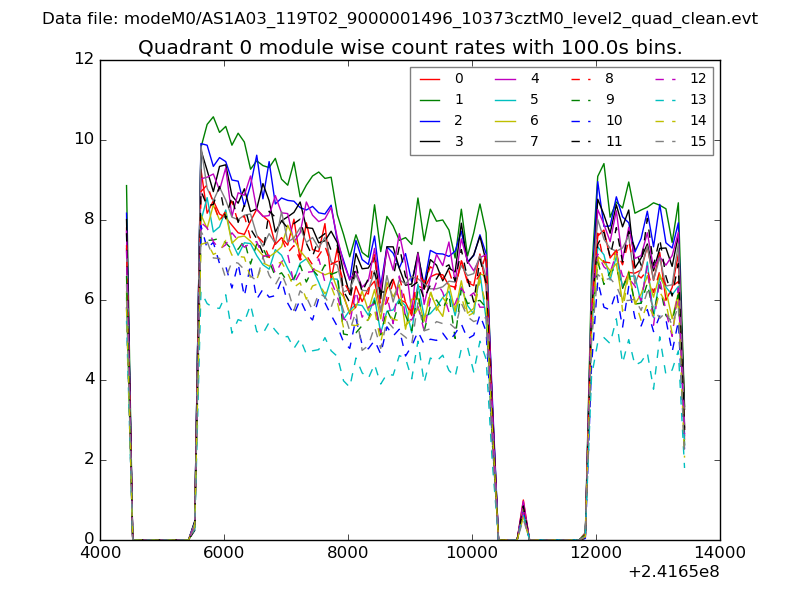 |
 |
| Module-wise count rates for Quadrant B Data is divided into 100 sec bins |
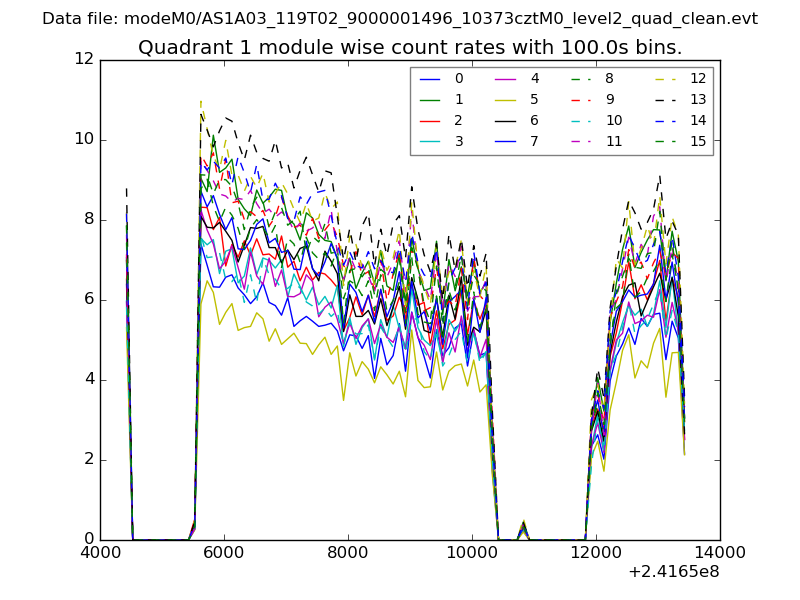 |
 |
| Module-wise count rates for Quadrant C Data is divided into 100 sec bins |
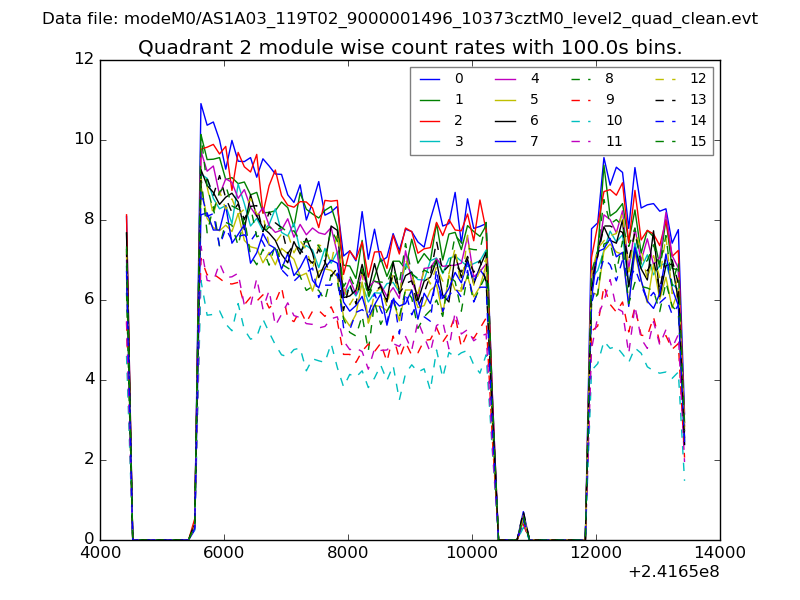 |
 |
| Module-wise count rates for Quadrant D Data is divided into 100 sec bins |
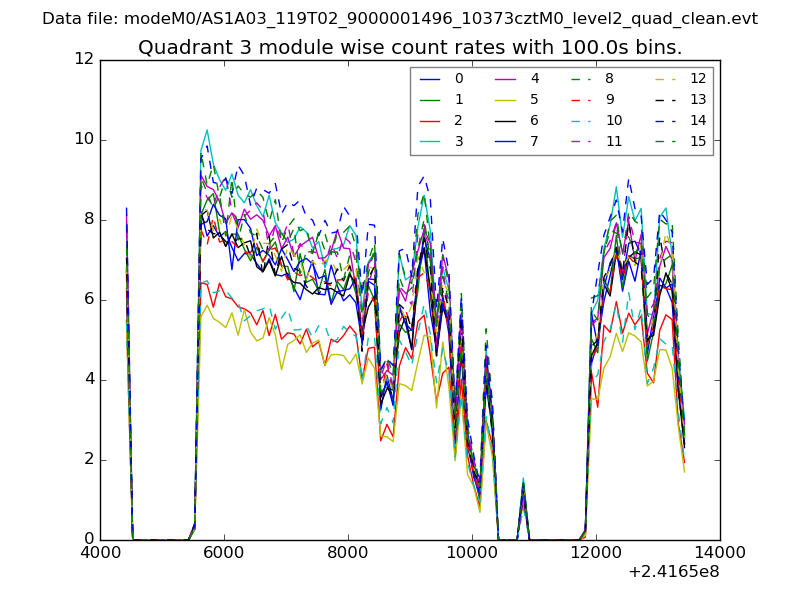 |
 |
| Parameter | Plot |
|---|---|
| CZT HV Monitor | 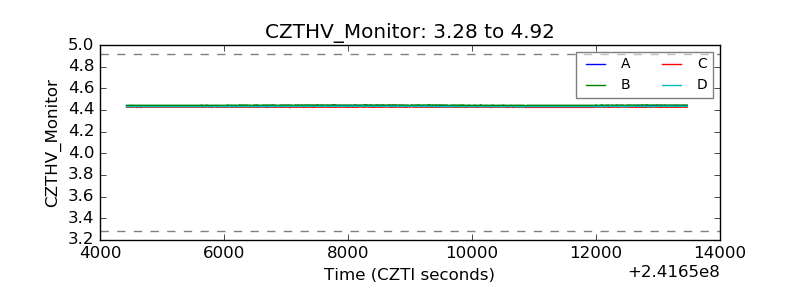 |
| D_VDD | 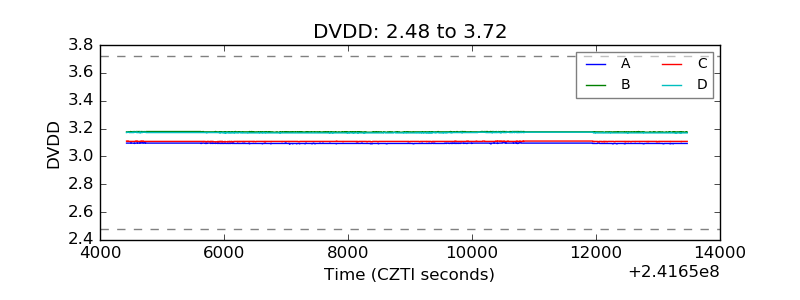 |
| Temperature 1 | 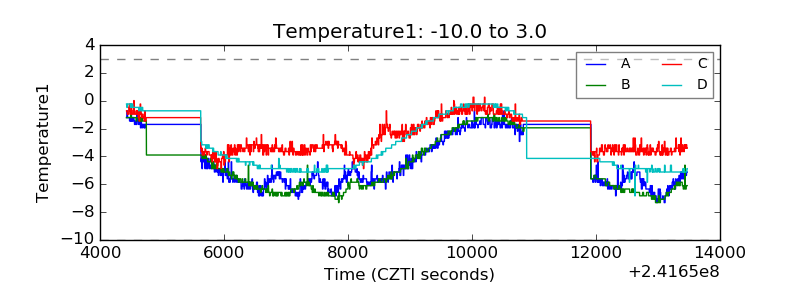 |
| Veto HV Monitor | 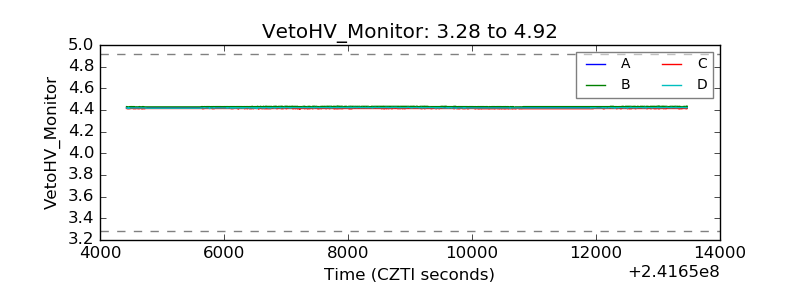 |
| Veto LLD | 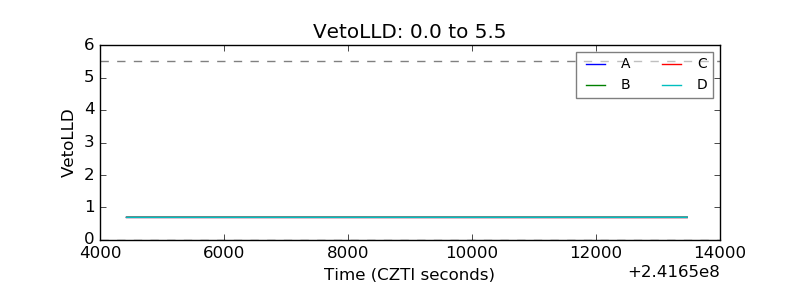 |
| Alpha Counter | 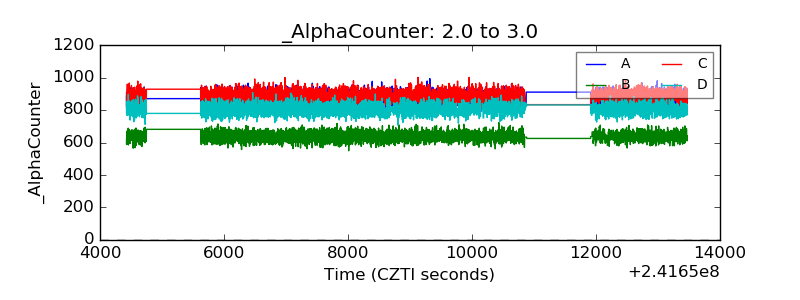 |
| _CPM_Rate | 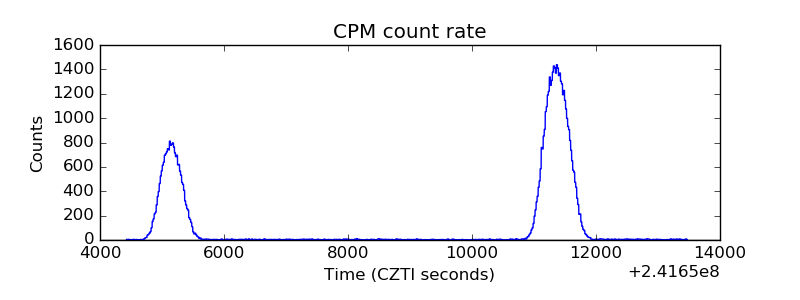 |
| CZT Counter | 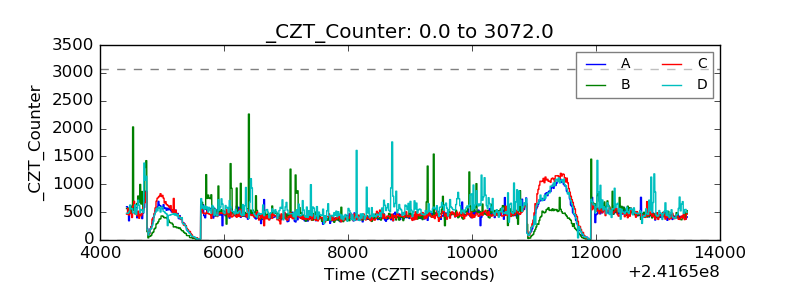 |
| +2.5 Volts monitor |  |
| +5 Volts monitor |  |
| _ROLL_ROT | 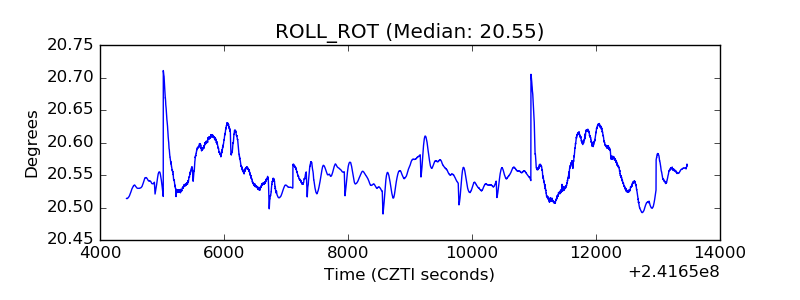 |
| _Roll_DEC | 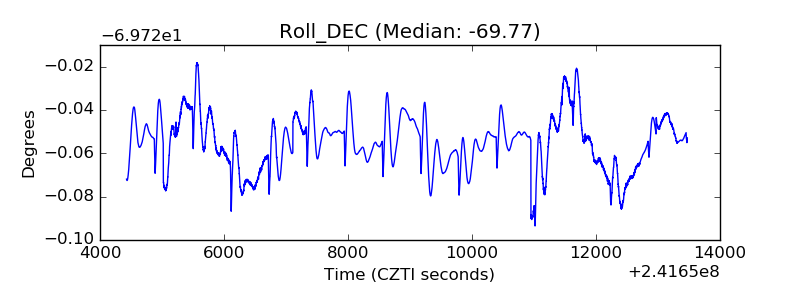 |
| _Roll_RA | 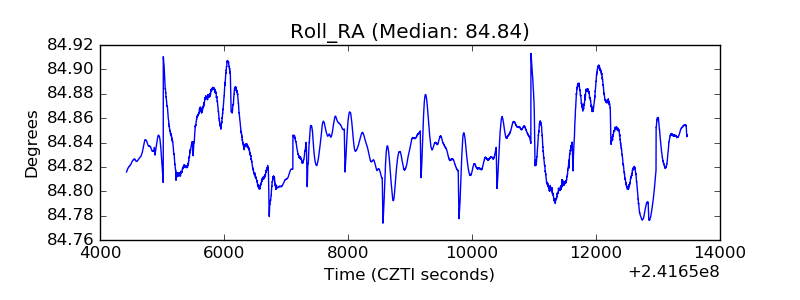 |
| Veto Counter | 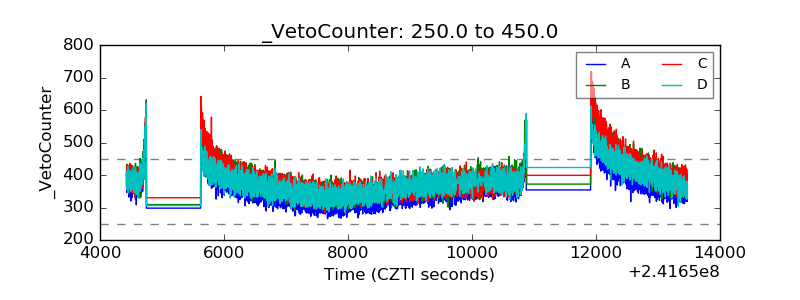 |