| Param | Original file | Final file |
|---|---|---|
| Filename | modeM0/AS1A03_119T02_9000001496_10375cztM0_level2.evt | modeM0/AS1A03_119T02_9000001496_10375cztM0_level2_quad_clean.evt |
| Size (bytes) | 360,020,160 | 85,147,200 |
| Size | 343.3 MB | 81.2 MB |
| Events in quadrant A | 2,324,410 | 552,010 |
| Events in quadrant B | 2,528,668 | 564,180 |
| Events in quadrant C | 2,323,745 | 566,665 |
| Events in quadrant D | 3,371,648 | 530,771 |
| Mode M9 | |||
|---|---|---|---|
| Quadrant | BADHDUFLAG | Total packets | Discarded packets |
| A | 0 | 11 | 0 |
| B | 0 | 11 | 0 |
| C | 0 | 11 | 0 |
| D | 0 | 11 | 0 |
| Mode M0 | |||
|---|---|---|---|
| Quadrant | BADHDUFLAG | Total packets | Discarded packets |
| A | 0 | 10539 | 1 |
| B | 0 | 11035 | 1 |
| C | 0 | 10527 | 1 |
| D | 0 | 13385 | 1 |
| Mode SS | |||
|---|---|---|---|
| Quadrant | BADHDUFLAG | Total packets | Discarded packets |
| A | 0 | 106 | 0 |
| B | 0 | 106 | 0 |
| C | 0 | 106 | 0 |
| D | 0 | 106 | 0 |
| Quadrant | Total seconds | Saturated seconds | Saturation percentage |
|---|---|---|---|
| A | 5210 | 17 | 0.326296% |
| B | 5210 | 36 | 0.690979% |
| C | 5210 | 12 | 0.230326% |
| D | 5210 | 104 | 1.996161% |
Noise dominated data is calculated using 1-second bins in cleaned event files. If a bin has >2000 counts, and if more than 50% of those come from <1% of pixels, then it is considered to be noise-dominated and hence unusable.
| Quadrant | # 1 sec bins | Bins with >0 counts | Bins with >2000 counts | High rate bins dominated by noise | Noise dominated (total time) | Noise dominated (detector-on time) | Marked lightcurve |
|---|---|---|---|---|---|---|---|
| A | 6240 | 5211 | 0 | 0 | 0.00% | 0.00% | 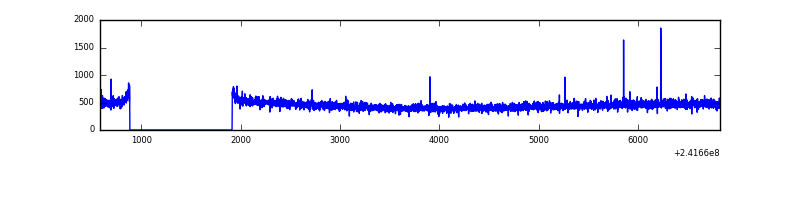 |
| B | 6240 | 5211 | 3 | 3 | 0.05% | 0.06% | 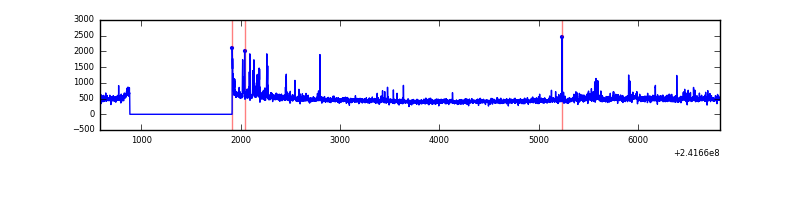 |
| C | 6240 | 5211 | 0 | 0 | 0.00% | 0.00% | 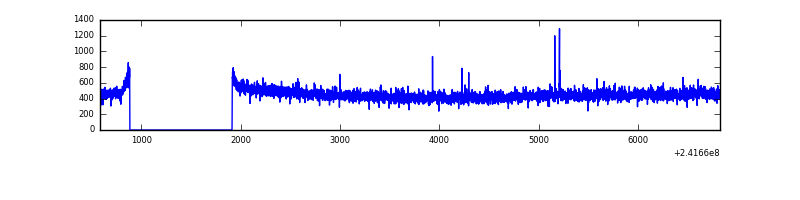 |
| D | 6240 | 5211 | 88 | 88 | 1.41% | 1.69% | 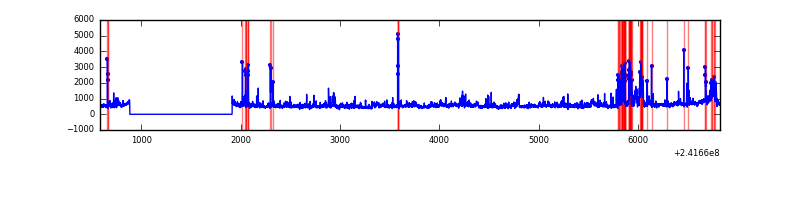 |
Top three noisy pixels from each quadrant. If the there are fewer than three noisy pixels in the level2.evt file, extra rows are filled as -1
| Pixel properties | Quadrant properties | ||||||
|---|---|---|---|---|---|---|---|
| Quadrant | DetID | PixID | Counts | Sigma | Mean | Median | Sigma |
| A | 3 | 1 | 9506 | 73.18 | 599 | 585 | 121.9 |
| A | 0 | 226 | 5467 | 40.05 | 599 | 585 | 121.9 |
| A | 12 | 194 | 4939 | 35.71 | 599 | 585 | 121.9 |
| B | 4 | 239 | 73970 | 643.61 | 604 | 590 | 114.0 |
| B | 0 | 214 | 48784 | 422.71 | 604 | 590 | 114.0 |
| B | 6 | 51 | 17983 | 152.55 | 604 | 590 | 114.0 |
| C | 14 | 234 | 8043 | 54.47 | 593 | 596 | 136.7 |
| C | 13 | 61 | 4420 | 27.97 | 593 | 596 | 136.7 |
| C | 3 | 202 | 1516 | 6.73 | 593 | 596 | 136.7 |
| D | 8 | 195 | 336102 | 2425.68 | 584 | 568 | 138.3 |
| D | 1 | 52 | 281569 | 2031.44 | 584 | 568 | 138.3 |
| D | 1 | 20 | 280717 | 2025.28 | 584 | 568 | 138.3 |
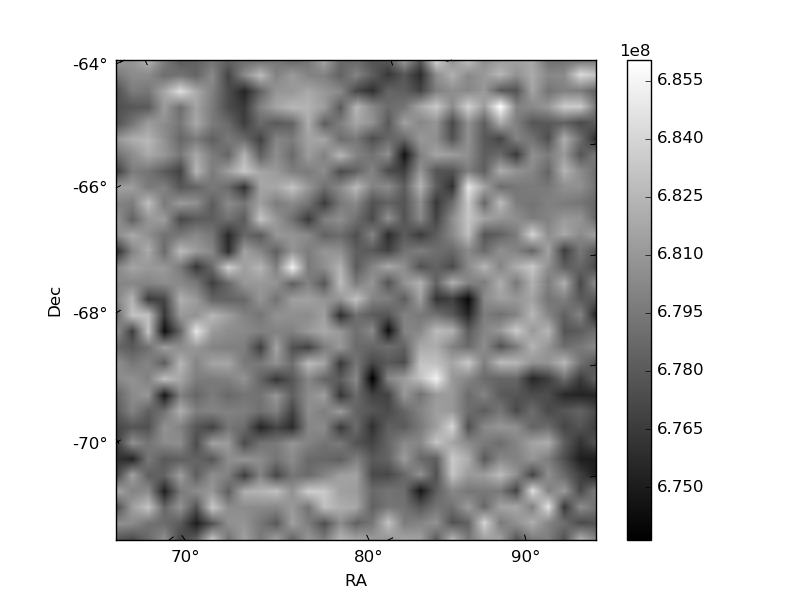
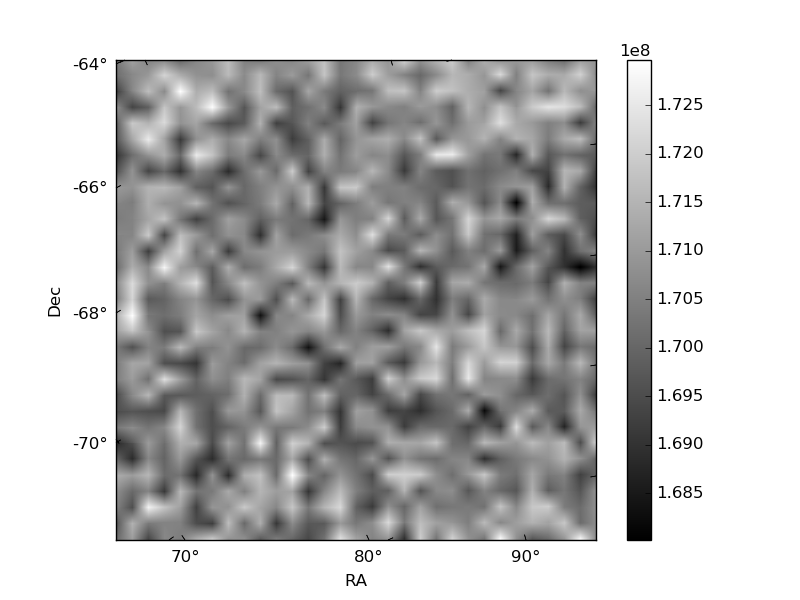
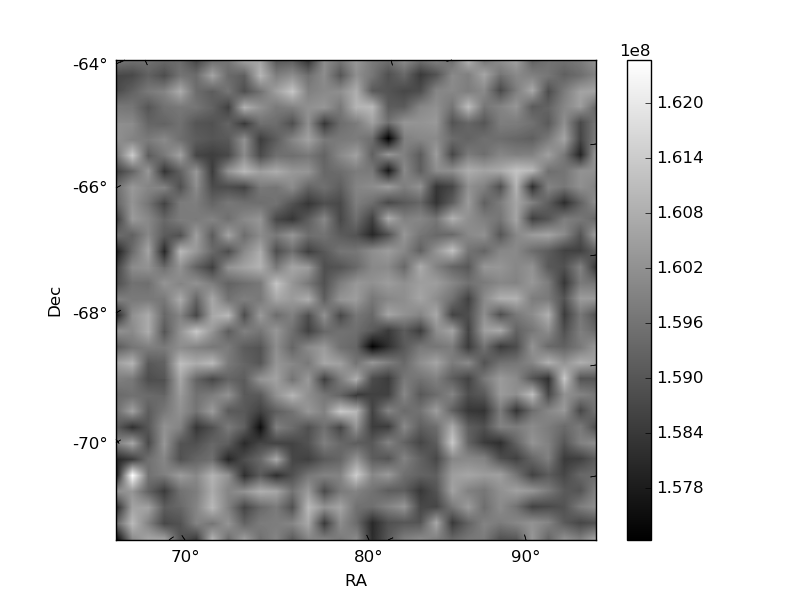
Histogram calculated using DETX and DETY for each event in the final _common_clean file
| Quadrant A | 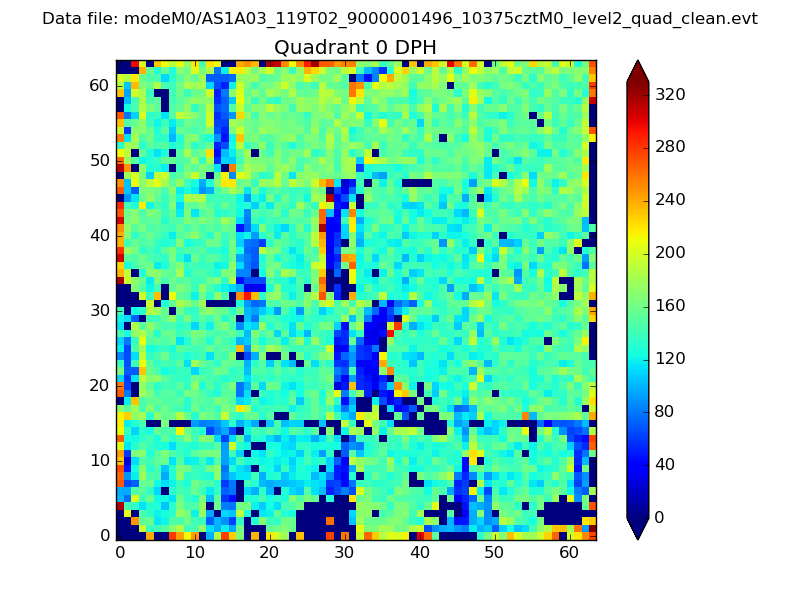 |
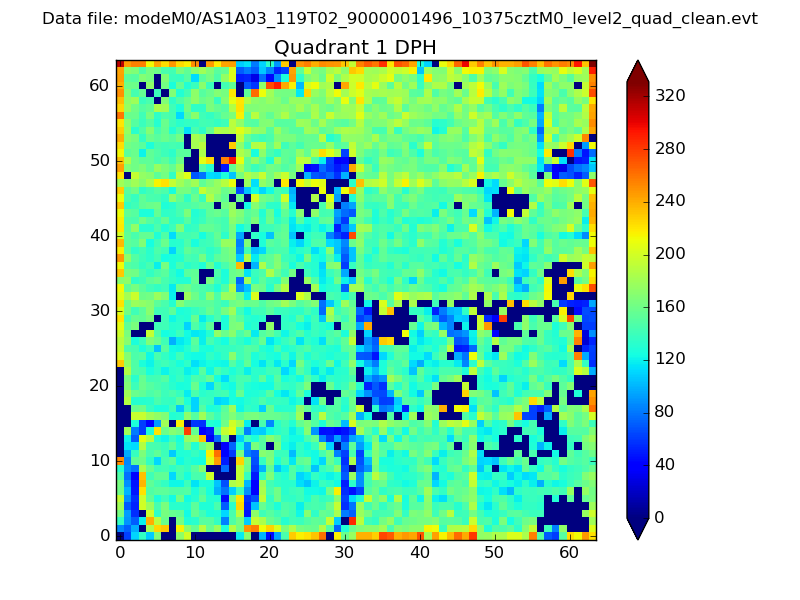 |
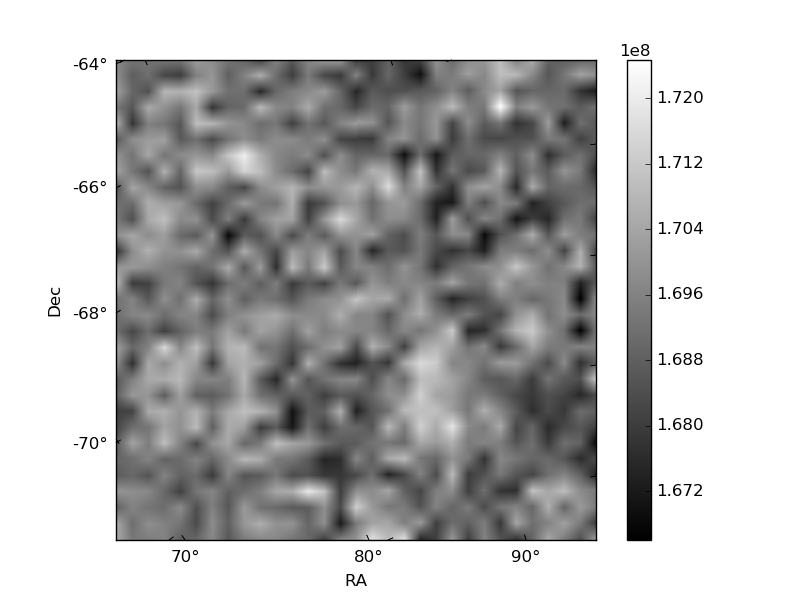
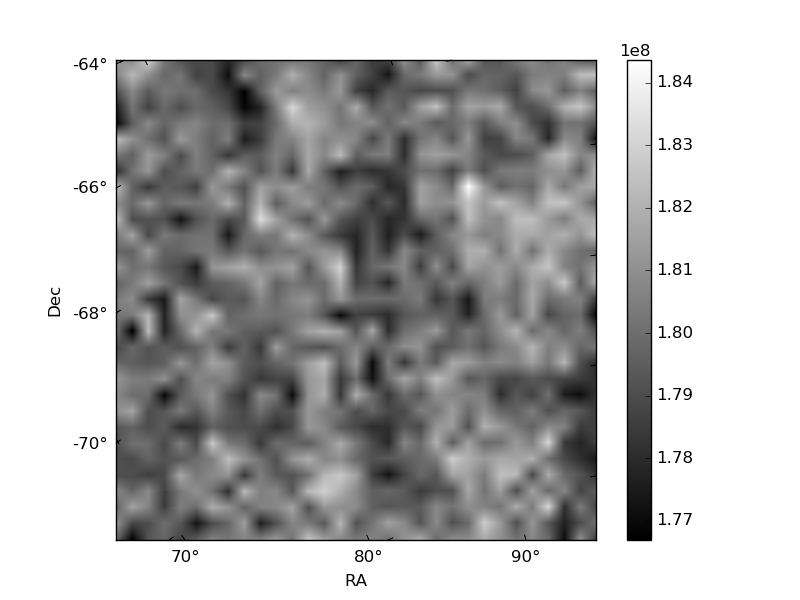
Quadrant B |
|---|---|---|---|
| Quadrant D | 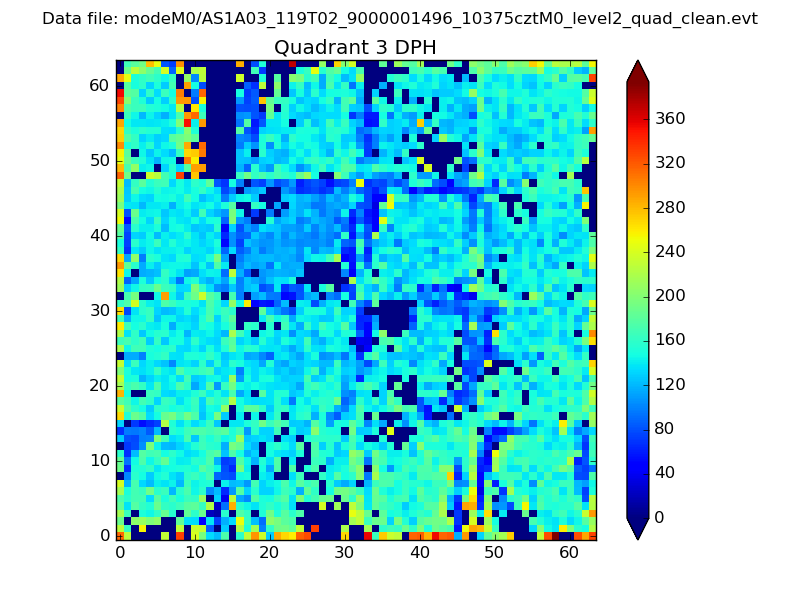 |
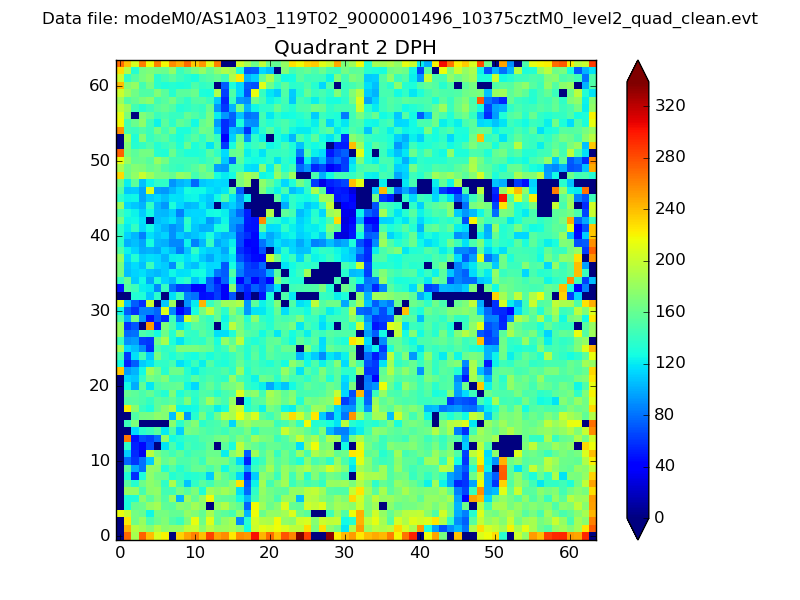 |
Quadrant C |
| Plot type | Count rate plots | Images |
|---|---|---|
| Comparison with Poisson distribution Blue bars denote a histogram of data divided into 1 sec bins. Red curve is a Poisson curve with rate = median count rate of data. |
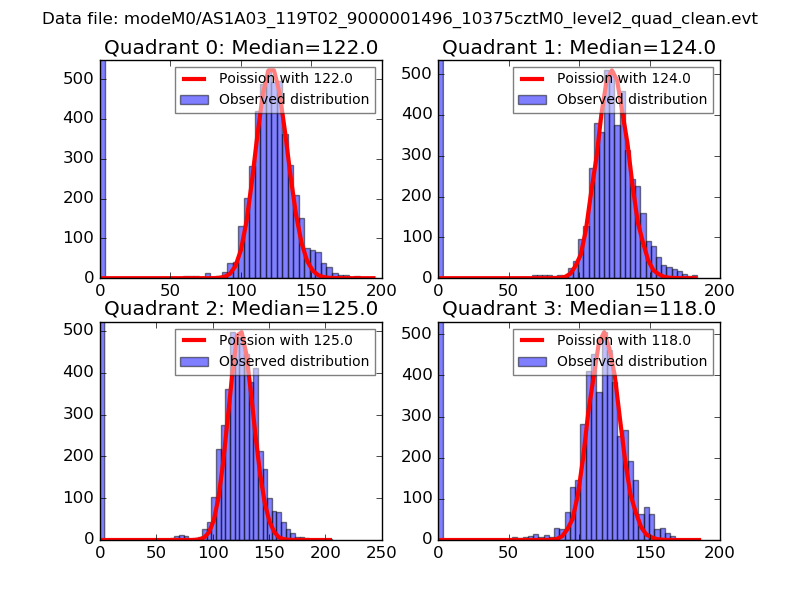 |
 |
| Quadrant-wise count rates Data is divided into 100 sec bins |
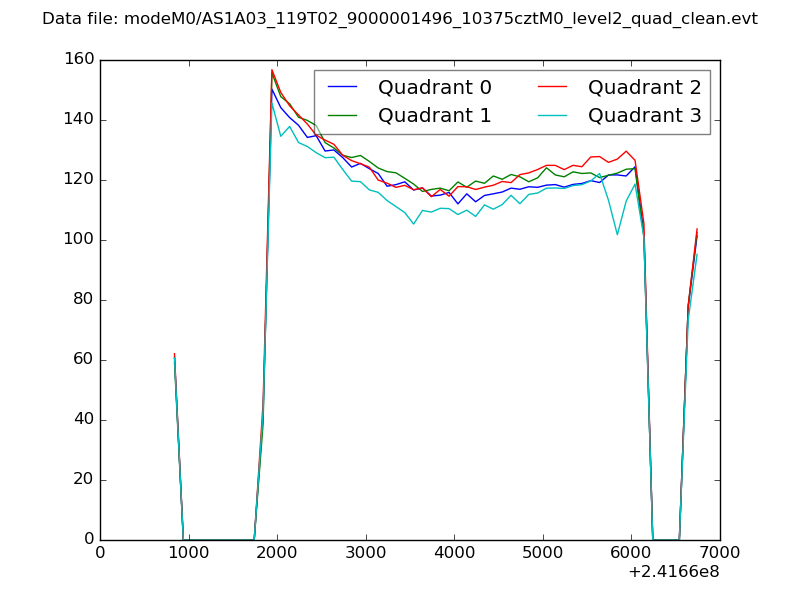 |
|
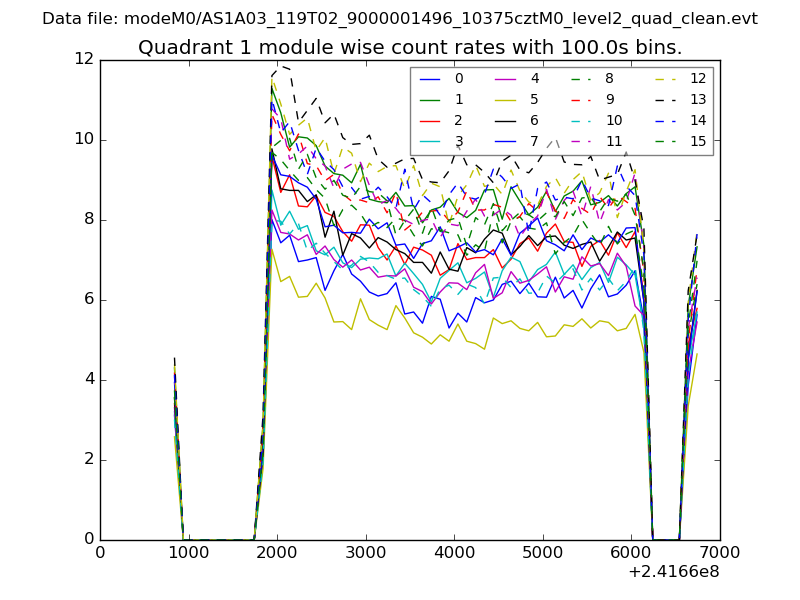
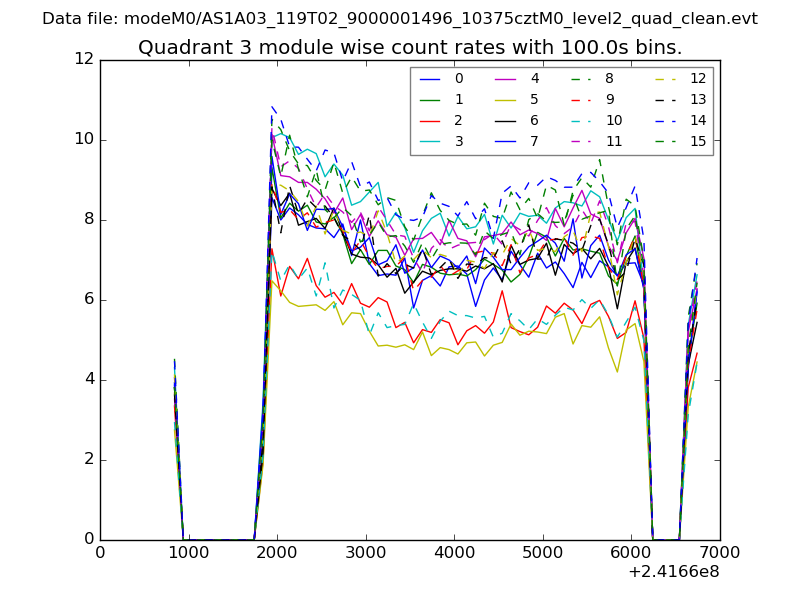
| Module-wise count rates for Quadrant A Data is divided into 100 sec bins |
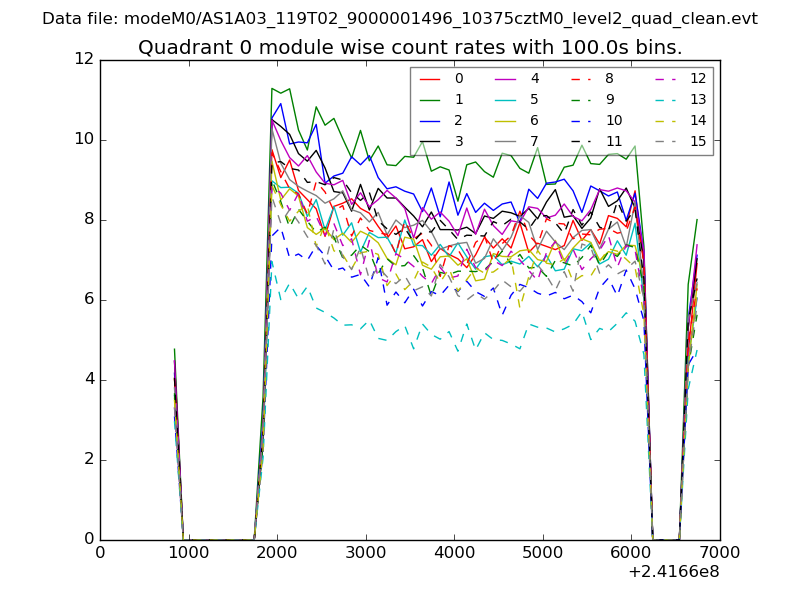 |
 |
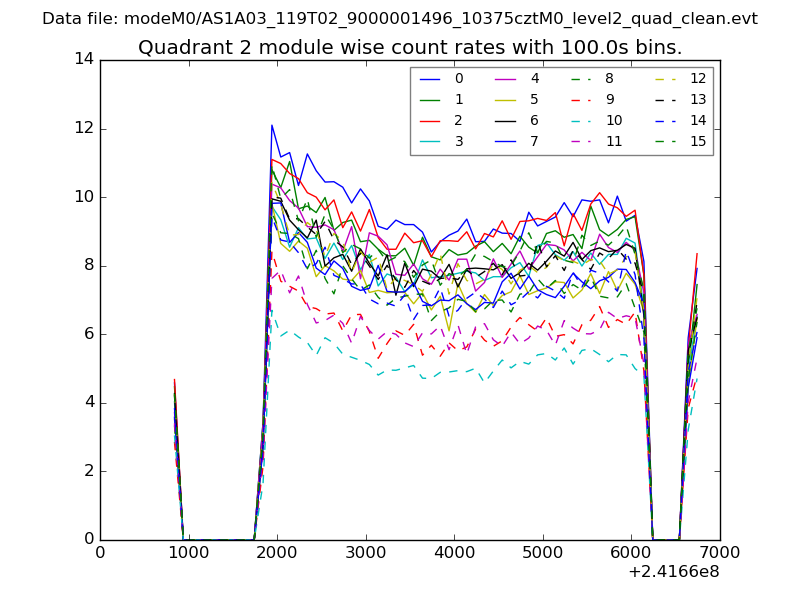
| Module-wise count rates for Quadrant B Data is divided into 100 sec bins |
 |
 |
| Module-wise count rates for Quadrant C Data is divided into 100 sec bins |
 |
 |
| Module-wise count rates for Quadrant D Data is divided into 100 sec bins |
 |
 |
| Parameter | Plot |
|---|---|
| CZT HV Monitor | 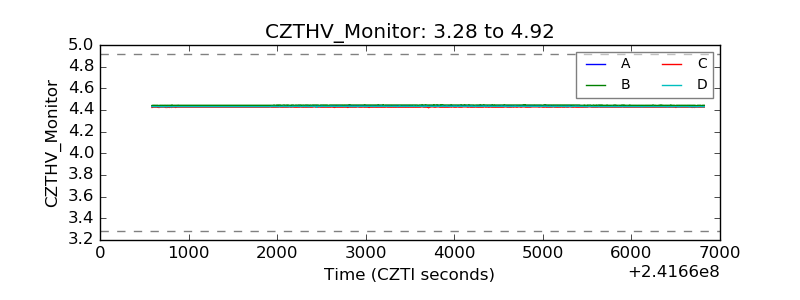 |
| D_VDD | 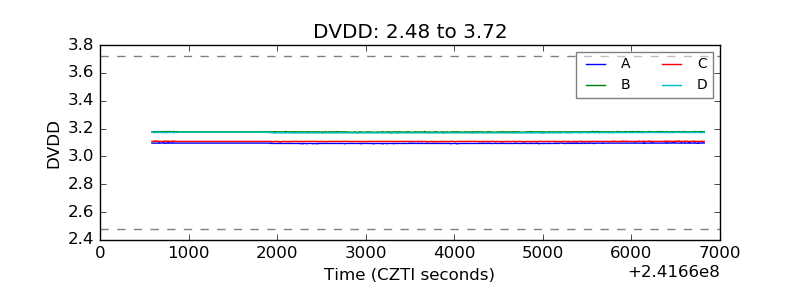 |
| Temperature 1 | 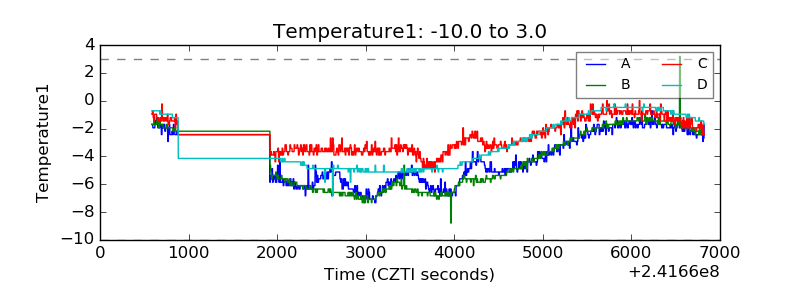 |
| Veto HV Monitor | 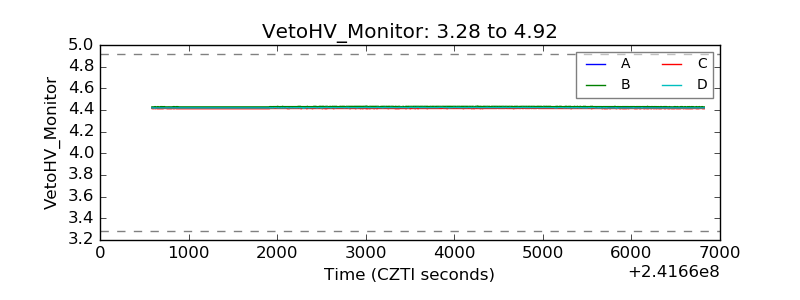 |
| Veto LLD | 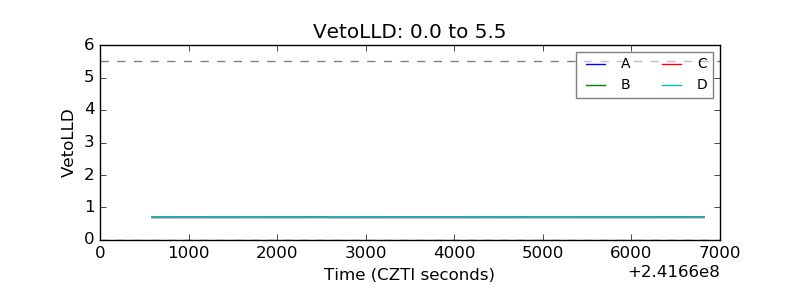 |
| Alpha Counter | 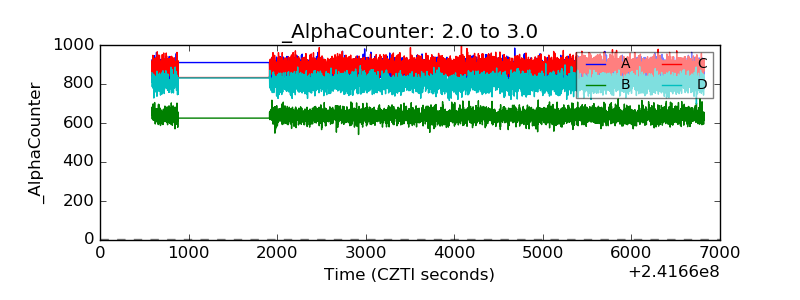 |
| _CPM_Rate | 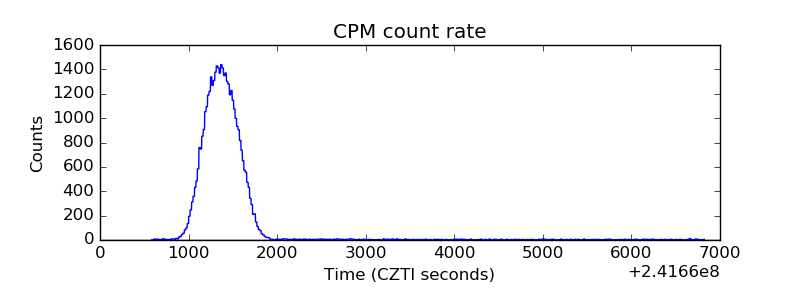 |
| CZT Counter | 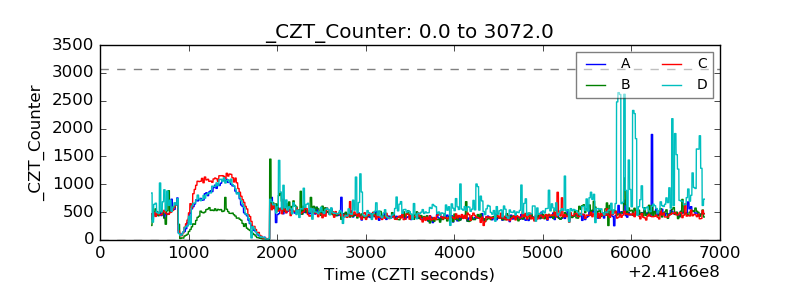 |
| +2.5 Volts monitor |  |
| +5 Volts monitor |  |
| _ROLL_ROT | 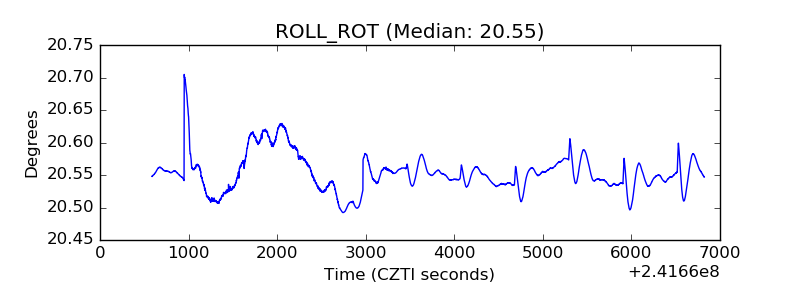 |
| _Roll_DEC | 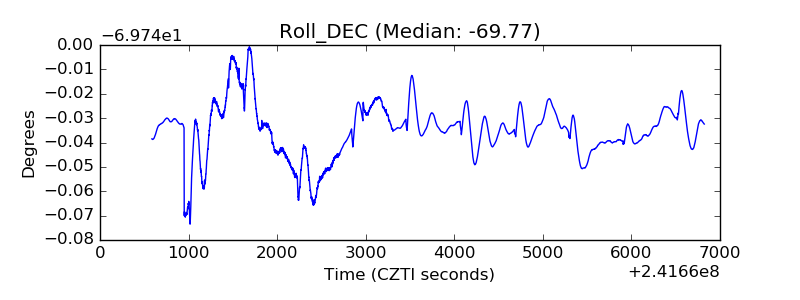 |
| _Roll_RA | 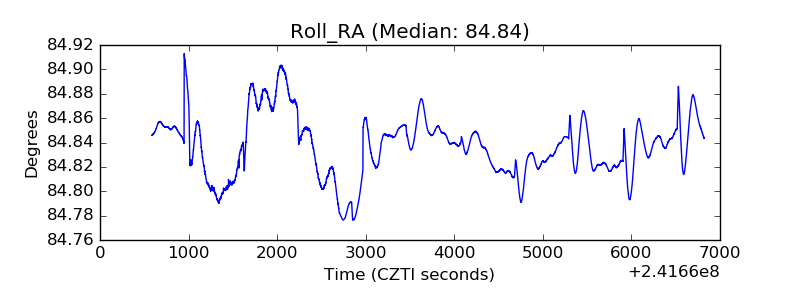 |
| Veto Counter | 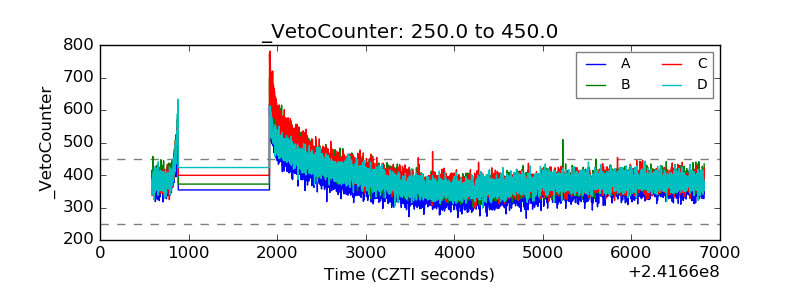 |