| Param | Original file | Final file |
|---|---|---|
| Filename | modeM0/AS1A03_073T01_9000001498cztM0_level2.fits | modeM0/AS1A03_073T01_9000001498cztM0_level2_quad_clean.evt |
| Size (bytes) | 706,314,240 | 721,751,040 |
| Size | 673.6 MB | 688.3 MB |
| Events in quadrant A | 4,282,066 | 4,346,921 |
| Events in quadrant B | 4,124,734 | 4,304,669 |
| Events in quadrant C | 4,246,712 | 4,259,208 |
| Events in quadrant D | 3,646,952 | 3,858,842 |
| Mode M9 | |||
|---|---|---|---|
| Quadrant | BADHDUFLAG | Total packets | Discarded packets |
| A | 0 | 117 | 0 |
| B | 0 | 117 | 0 |
| C | 0 | 117 | 0 |
| D | 0 | 117 | 0 |
| Mode SS | |||
|---|---|---|---|
| Quadrant | BADHDUFLAG | Total packets | Discarded packets |
| A | 0 | 1521 | 0 |
| B | 0 | 1516 | 0 |
| C | 0 | 1518 | 0 |
| D | 0 | 1518 | 0 |
| Mode M0 | |||
|---|---|---|---|
| Quadrant | BADHDUFLAG | Total packets | Discarded packets |
| A | 0 | 154122 | 0 |
| B | 0 | 162592 | 0 |
| C | 0 | 152839 | 0 |
| D | 0 | 197008 | 0 |
| Quadrant | Total seconds | Saturated seconds | Saturation percentage |
|---|---|---|---|
| A | 74268 | 803 | 1.081219% |
| B | 73997 | 1263 | 1.706826% |
| C | 74319 | 528 | 0.710451% |
| D | 74265 | 1835 | 2.470881% |
Noise dominated data is calculated using 1-second bins in cleaned event files. If a bin has >2000 counts, and if more than 50% of those come from <1% of pixels, then it is considered to be noise-dominated and hence unusable.
| Quadrant | # 1 sec bins | Bins with >0 counts | Bins with >2000 counts | High rate bins dominated by noise | Noise dominated (total time) | Noise dominated (detector-on time) | Marked lightcurve |
|---|---|---|---|---|---|---|---|
| A | 86308 | 75042 | 0 | 0 | 0.00% | 0.00% |  |
| B | 86308 | 74809 | 0 | 0 | 0.00% | 0.00% |  |
| C | 86308 | 75054 | 0 | 0 | 0.00% | 0.00% |  |
| D | 86308 | 74748 | 0 | 0 | 0.00% | 0.00% |  |
Top three noisy pixels from each quadrant. If the there are fewer than three noisy pixels in the level2.evt file, extra rows are filled as -1
| Pixel properties | Quadrant properties | ||||||
|---|---|---|---|---|---|---|---|
| Quadrant | DetID | PixID | Counts | Sigma | Mean | Median | Sigma |
| A | 0 | 29 | 3999 | 10.63 | 1113 | 1043 | 278.2 |
| A | 7 | 110 | 3460 | 8.69 | 1113 | 1043 | 278.2 |
| A | 9 | 19 | 3150 | 7.57 | 1113 | 1043 | 278.2 |
| B | 2 | 9 | 3520 | 11.55 | 1087 | 1035 | 215.1 |
| B | 12 | 226 | 2744 | 7.94 | 1087 | 1035 | 215.1 |
| B | 3 | 80 | 2726 | 7.86 | 1087 | 1035 | 215.1 |
| C | 1 | 81 | 3230 | 7.59 | 1121 | 1045 | 288.0 |
| C | 1 | 80 | 3224 | 7.57 | 1121 | 1045 | 288.0 |
| C | 1 | 65 | 2895 | 6.42 | 1121 | 1045 | 288.0 |
| D | 3 | 14 | 2681 | 6.19 | 1040 | 948 | 279.8 |
| D | 6 | 231 | 2624 | 5.99 | 1040 | 948 | 279.8 |
| D | 7 | 5 | 2588 | 5.86 | 1040 | 948 | 279.8 |
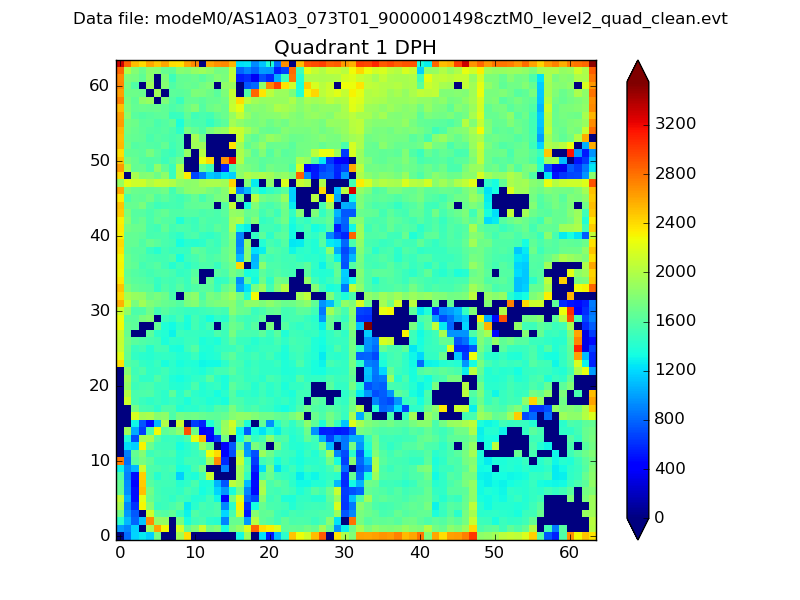
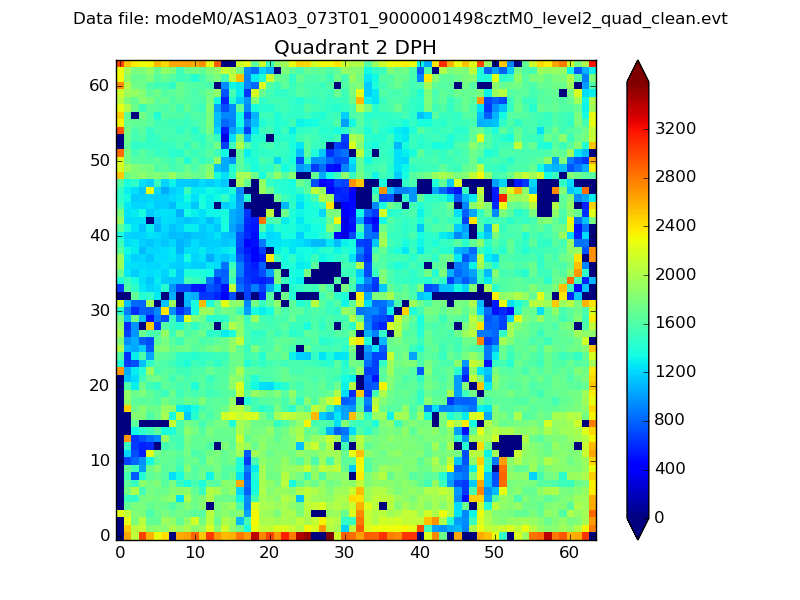
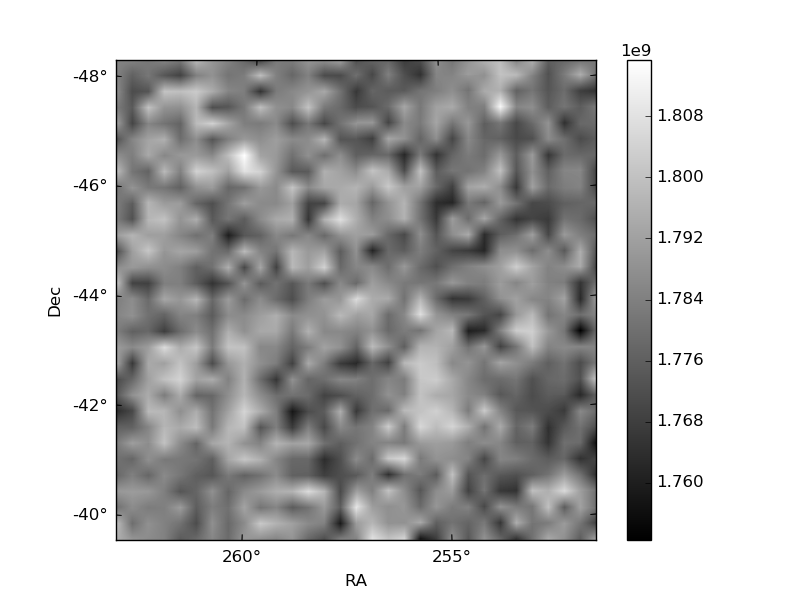
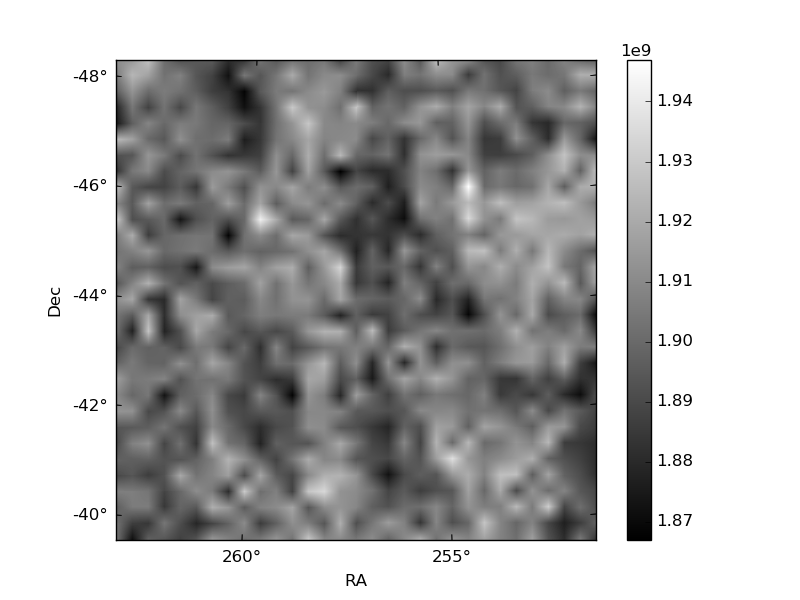
Histogram calculated using DETX and DETY for each event in the final _common_clean file
| Quadrant A |  |
 |
Quadrant B |
|---|---|---|---|
| Quadrant D | 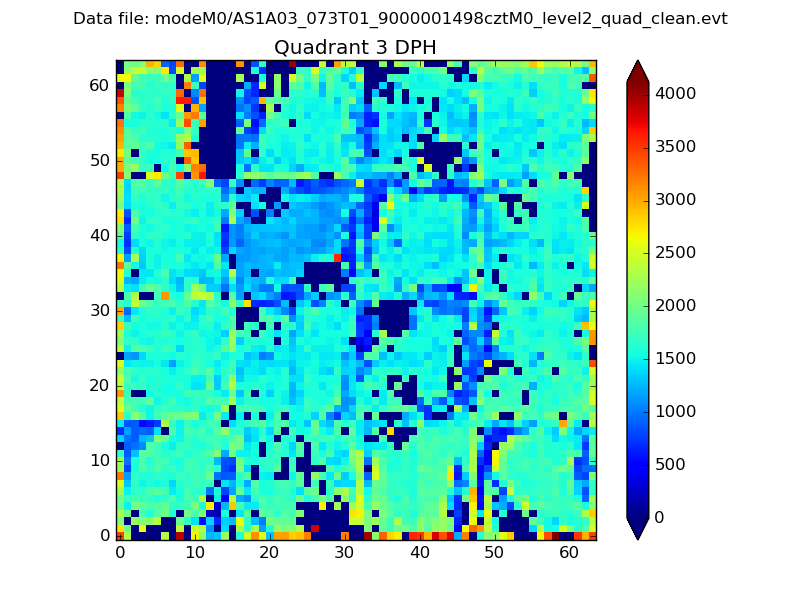 |
 |
Quadrant C |
| Plot type | Count rate plots | Images |
|---|---|---|
| Comparison with Poisson distribution Blue bars denote a histogram of data divided into 1 sec bins. Red curve is a Poisson curve with rate = median count rate of data. |
 |
 |
| Quadrant-wise count rates Data is divided into 100 sec bins |
 |
|
| Module-wise count rates for Quadrant A Data is divided into 100 sec bins |
 |
 |
| Module-wise count rates for Quadrant B Data is divided into 100 sec bins |
 |
 |
| Module-wise count rates for Quadrant C Data is divided into 100 sec bins |
 |
 |
| Module-wise count rates for Quadrant D Data is divided into 100 sec bins |
 |
 |
| Parameter | Plot |
|---|---|
| CZT HV Monitor |  |
| D_VDD |  |
| Temperature 1 |  |
| Veto HV Monitor |  |
| Veto LLD |  |
| Alpha Counter |  |
| _CPM_Rate |  |
| CZT Counter |  |
| +2.5 Volts monitor |  |
| +5 Volts monitor |  |
| _ROLL_ROT |  |
| _Roll_DEC |  |
| _Roll_RA |  |
| Veto Counter |  |