| Param | Original file | Final file |
|---|---|---|
| Filename | modeM0/AS1A03_073T01_9000001498_10375cztM0_level2.evt | modeM0/AS1A03_073T01_9000001498_10375cztM0_level2_quad_clean.evt |
| Size (bytes) | 118,782,720 | 12,179,520 |
| Size | 113.3 MB | 11.6 MB |
| Events in quadrant A | 721,067 | 67,716 |
| Events in quadrant B | 764,411 | 70,135 |
| Events in quadrant C | 724,913 | 68,653 |
| Events in quadrant D | 1,284,924 | 53,137 |
| Mode M9 | |||
|---|---|---|---|
| Quadrant | BADHDUFLAG | Total packets | Discarded packets |
| A | 0 | 5 | 0 |
| B | 0 | 5 | 0 |
| C | 0 | 5 | 0 |
| D | 0 | 5 | 0 |
| Mode SS | |||
|---|---|---|---|
| Quadrant | BADHDUFLAG | Total packets | Discarded packets |
| A | 0 | 30 | 0 |
| B | 0 | 30 | 0 |
| C | 0 | 30 | 0 |
| D | 0 | 30 | 0 |
| Mode M0 | |||
|---|---|---|---|
| Quadrant | BADHDUFLAG | Total packets | Discarded packets |
| A | 0 | 3050 | 2 |
| B | 0 | 3156 | 1 |
| C | 0 | 3044 | 1 |
| D | 0 | 4816 | 1 |
| Quadrant | Total seconds | Saturated seconds | Saturation percentage |
|---|---|---|---|
| A | 1459 | 2 | 0.137080% |
| B | 1459 | 8 | 0.548321% |
| C | 1459 | 1 | 0.068540% |
| D | 1459 | 141 | 9.664154% |
Noise dominated data is calculated using 1-second bins in cleaned event files. If a bin has >2000 counts, and if more than 50% of those come from <1% of pixels, then it is considered to be noise-dominated and hence unusable.
| Quadrant | # 1 sec bins | Bins with >0 counts | Bins with >2000 counts | High rate bins dominated by noise | Noise dominated (total time) | Noise dominated (detector-on time) | Marked lightcurve |
|---|---|---|---|---|---|---|---|
| A | 1459 | 1459 | 0 | 0 | 0.00% | 0.00% | 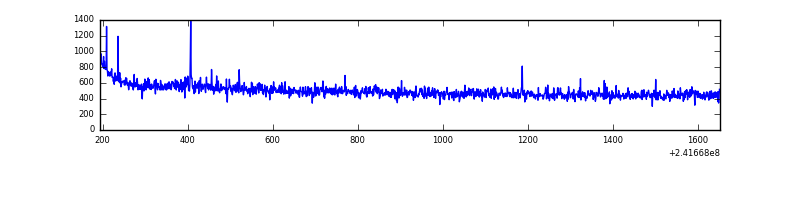 |
| B | 1459 | 1459 | 0 | 0 | 0.00% | 0.00% | 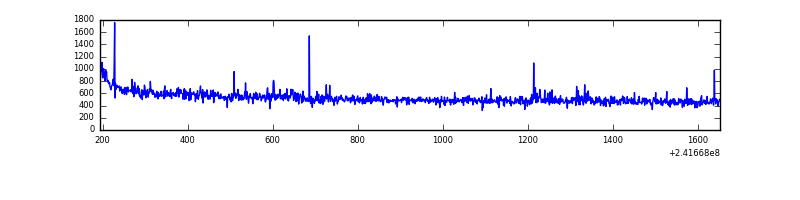 |
| C | 1459 | 1459 | 0 | 0 | 0.00% | 0.00% | 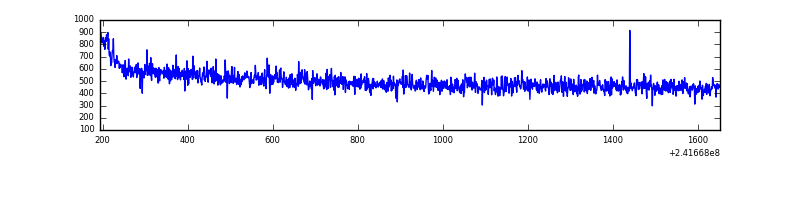 |
| D | 1459 | 1459 | 135 | 135 | 9.25% | 9.25% | 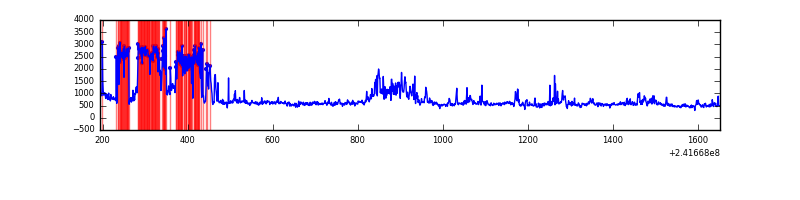 |
Top three noisy pixels from each quadrant. If the there are fewer than three noisy pixels in the level2.evt file, extra rows are filled as -1
| Pixel properties | Quadrant properties | ||||||
|---|---|---|---|---|---|---|---|
| Quadrant | DetID | PixID | Counts | Sigma | Mean | Median | Sigma |
| A | 5 | 16 | 4084 | 99.87 | 185 | 182 | 39.1 |
| A | 0 | 226 | 1598 | 36.24 | 185 | 182 | 39.1 |
| A | 3 | 1 | 1589 | 36.01 | 185 | 182 | 39.1 |
| B | 4 | 81 | 8754 | 230.67 | 191 | 187 | 37.1 |
| B | 4 | 239 | 8253 | 217.18 | 191 | 187 | 37.1 |
| B | 12 | 111 | 3887 | 99.62 | 191 | 187 | 37.1 |
| C | 13 | 61 | 1377 | 27.11 | 185 | 187 | 43.9 |
| C | 14 | 67 | 626 | 10.0 | 185 | 187 | 43.9 |
| C | 3 | 202 | 490 | 6.9 | 185 | 187 | 43.9 |
| D | 14 | 34 | 205132 | 4867.48 | 171 | 166 | 42.1 |
| D | 1 | 52 | 182738 | 4335.67 | 171 | 166 | 42.1 |
| D | 8 | 195 | 127278 | 3018.62 | 171 | 166 | 42.1 |
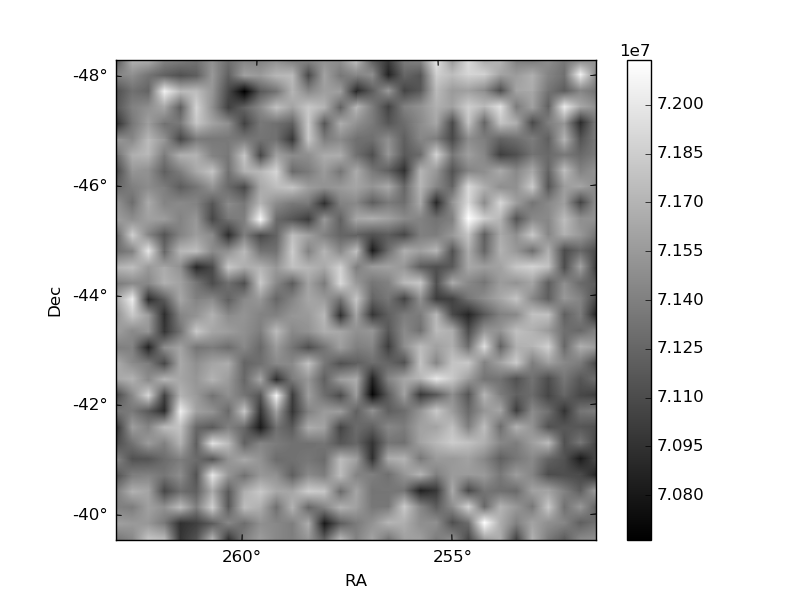
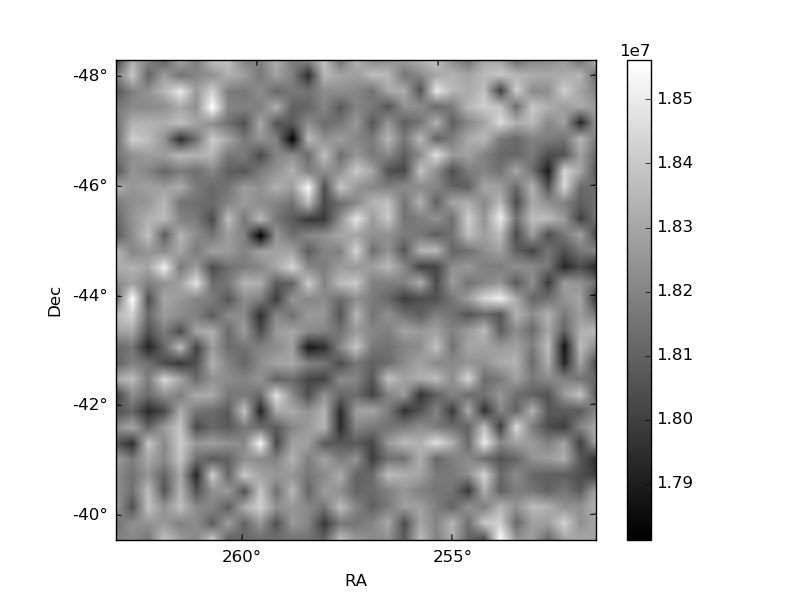
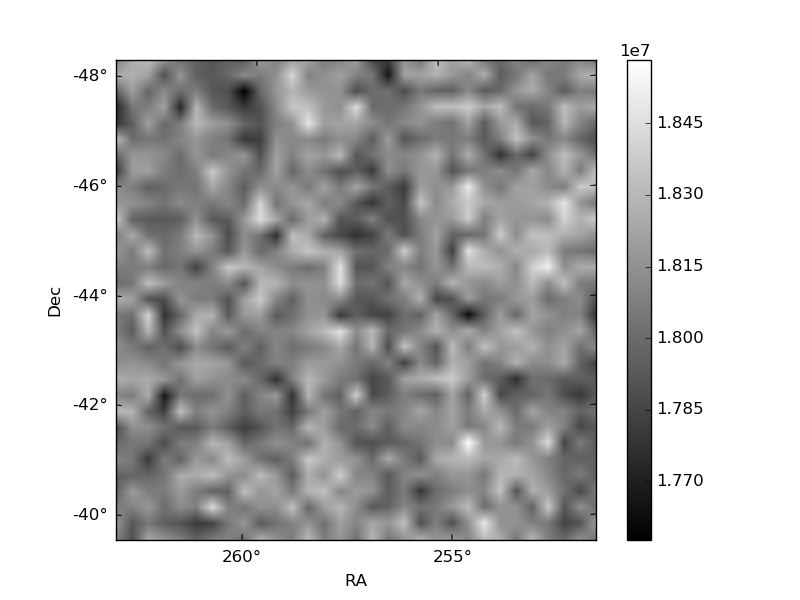
Histogram calculated using DETX and DETY for each event in the final _common_clean file
| Quadrant A | 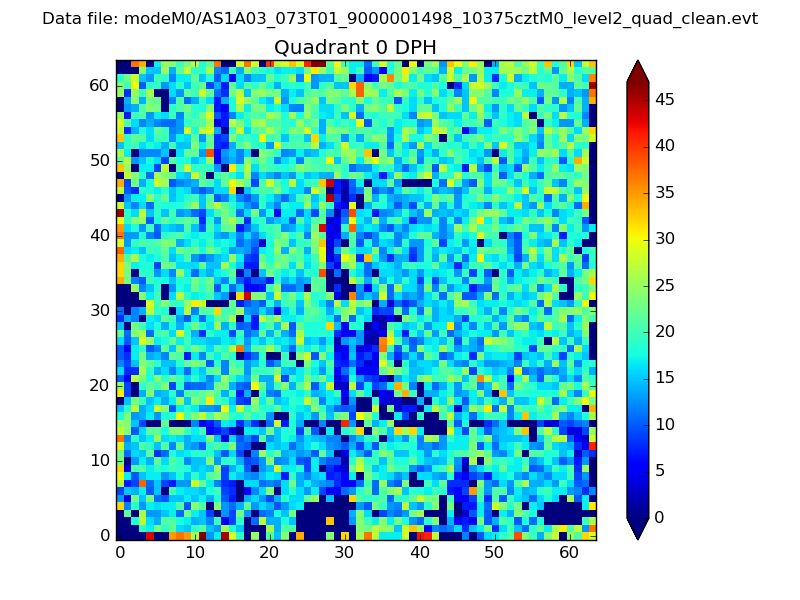 |
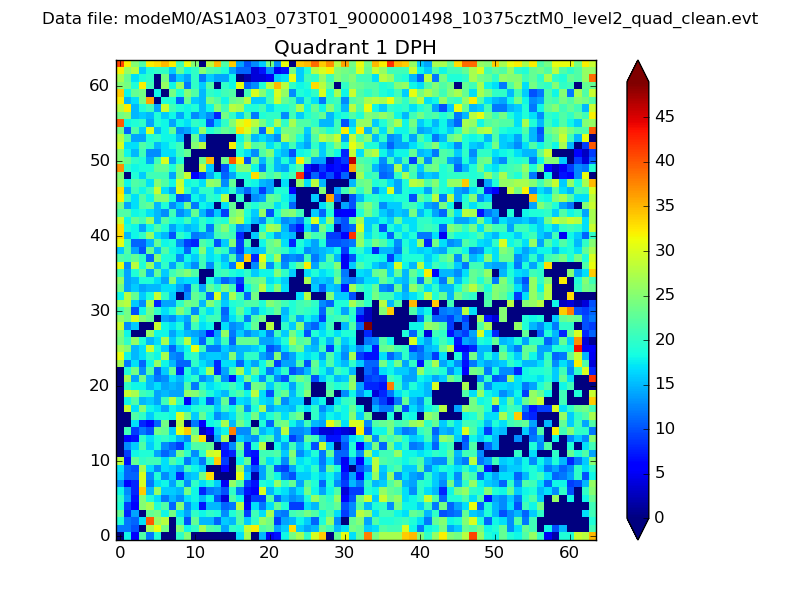 |
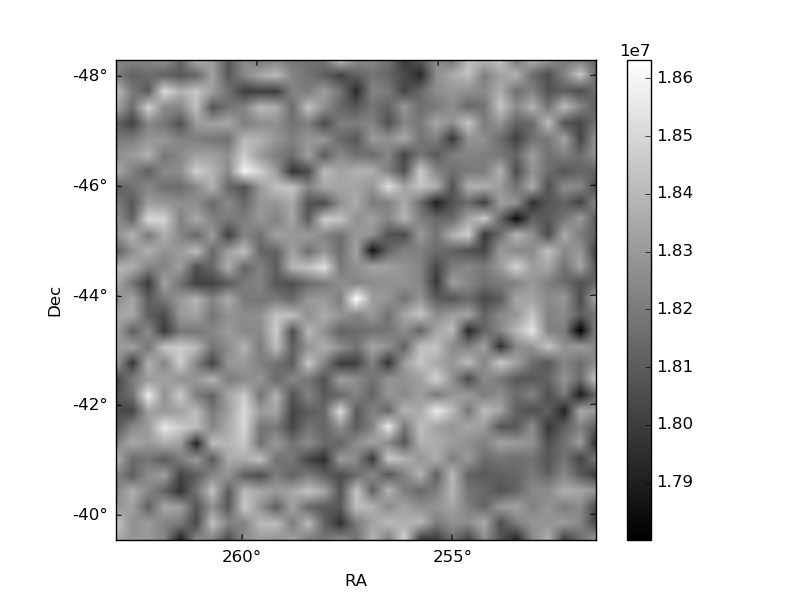
Quadrant B |
|---|---|---|---|
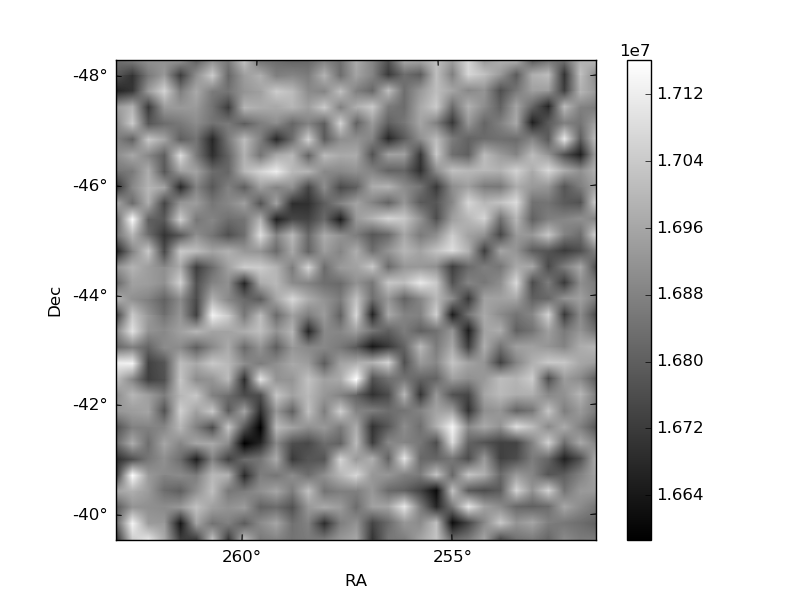
| Quadrant D | 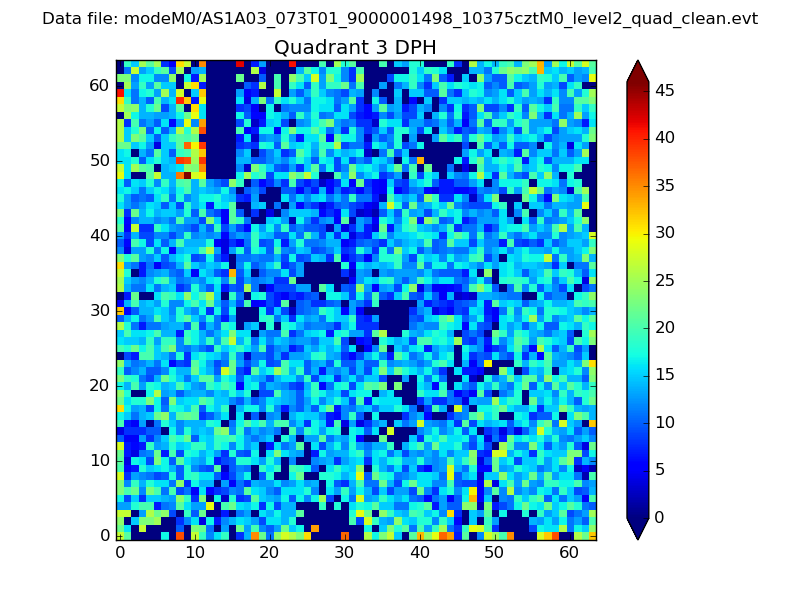 |
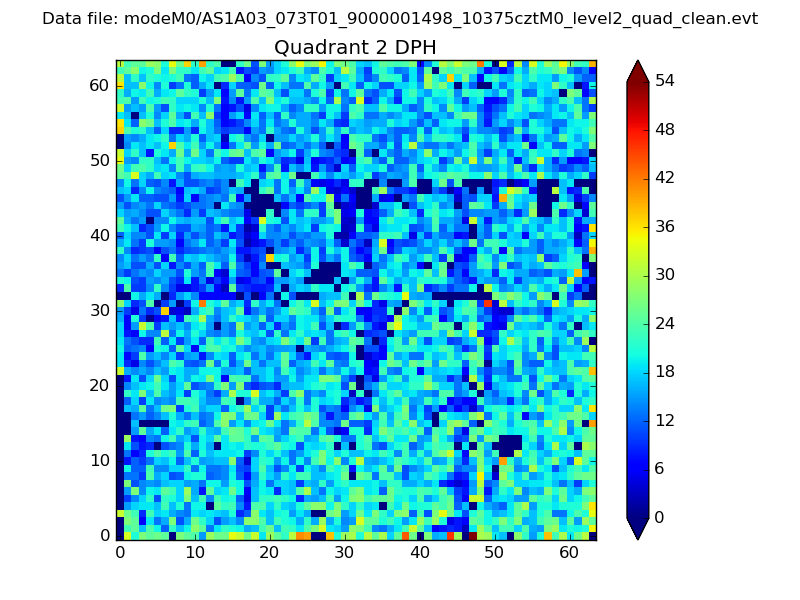 |
Quadrant C |
| Plot type | Count rate plots | Images |
|---|---|---|
| Comparison with Poisson distribution Blue bars denote a histogram of data divided into 1 sec bins. Red curve is a Poisson curve with rate = median count rate of data. |
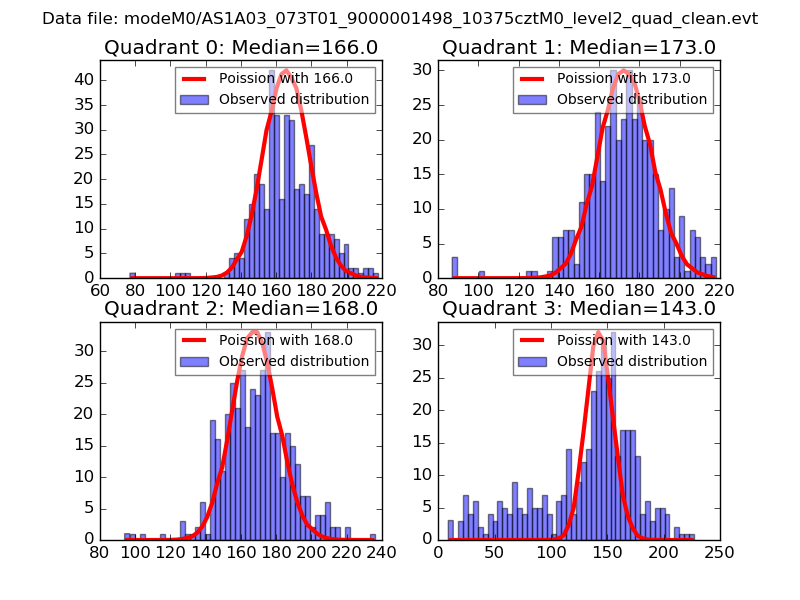 |
 |
| Quadrant-wise count rates Data is divided into 100 sec bins |
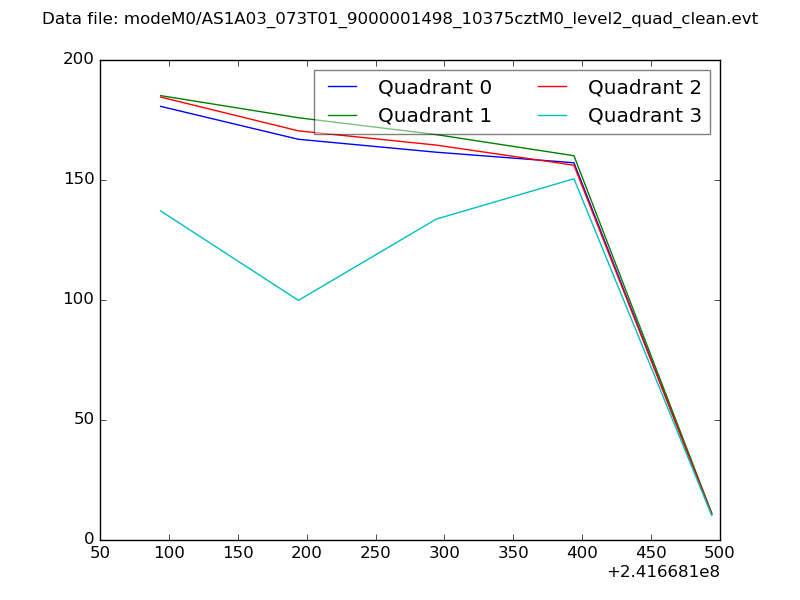 |
|
| Module-wise count rates for Quadrant A Data is divided into 100 sec bins |
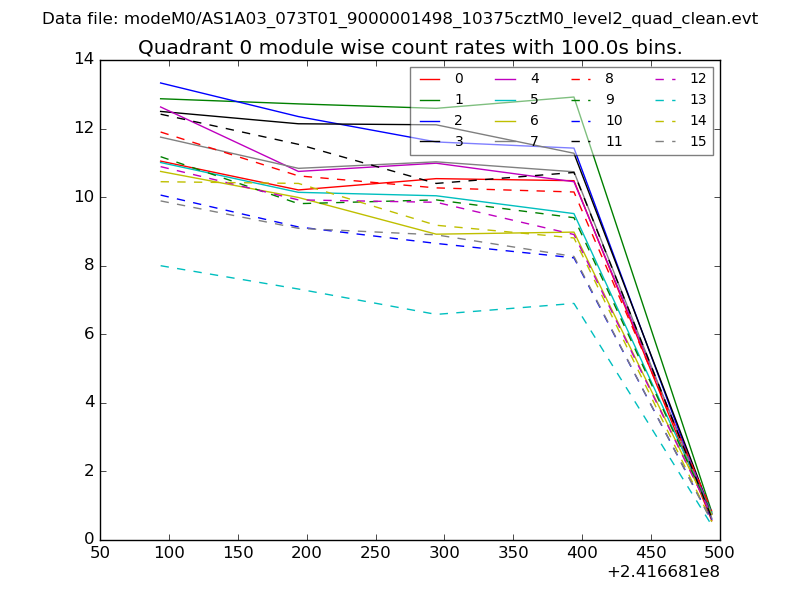 |
 |
| Module-wise count rates for Quadrant B Data is divided into 100 sec bins |
 |
 |
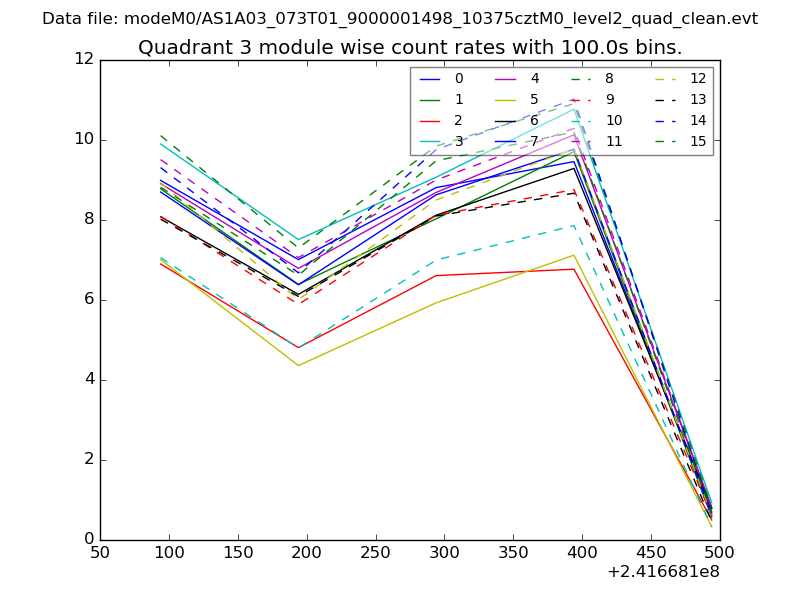
| Module-wise count rates for Quadrant C Data is divided into 100 sec bins |
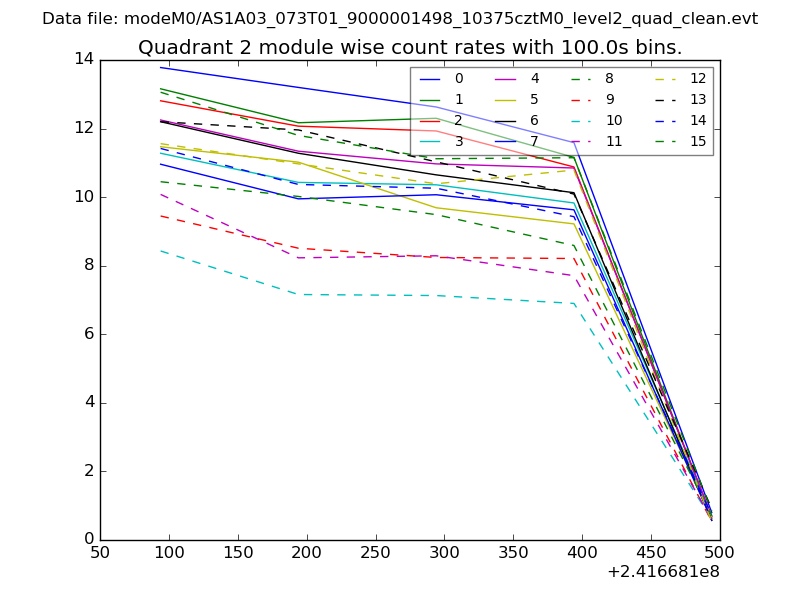 |
 |
| Module-wise count rates for Quadrant D Data is divided into 100 sec bins |
 |
 |
| Parameter | Plot |
|---|---|
| CZT HV Monitor | 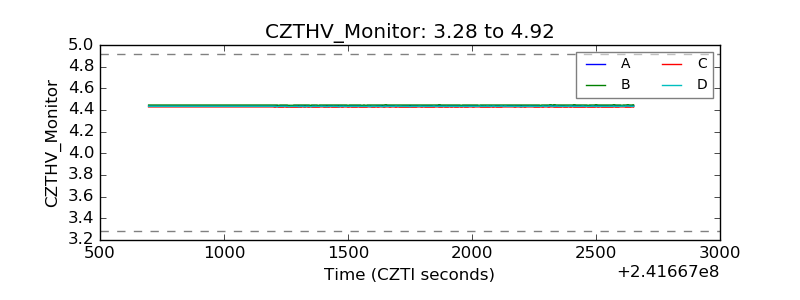 |
| D_VDD | 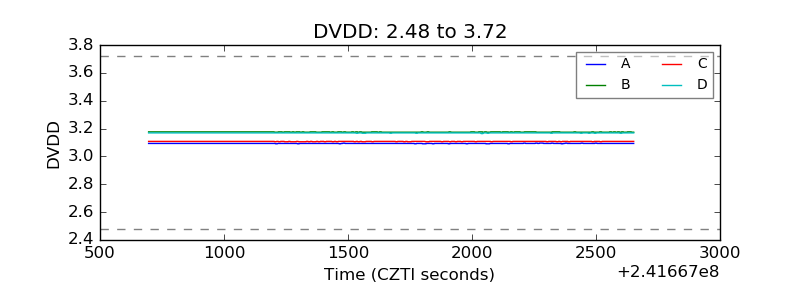 |
| Temperature 1 |  |
| Veto HV Monitor | 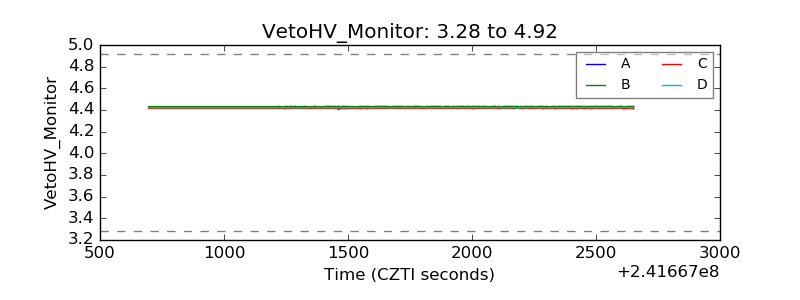 |
| Veto LLD | 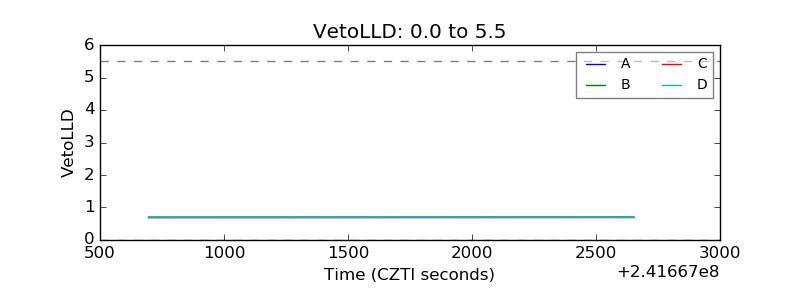 |
| Alpha Counter | 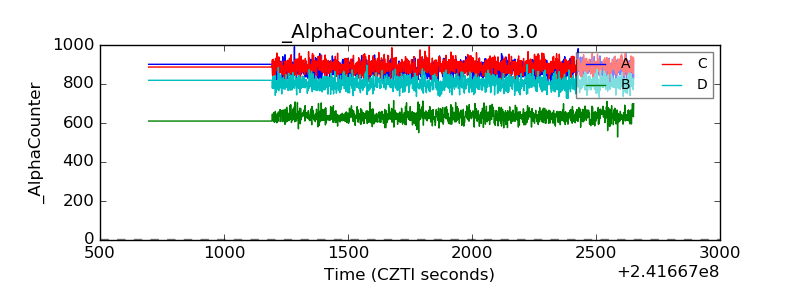 |
| _CPM_Rate | 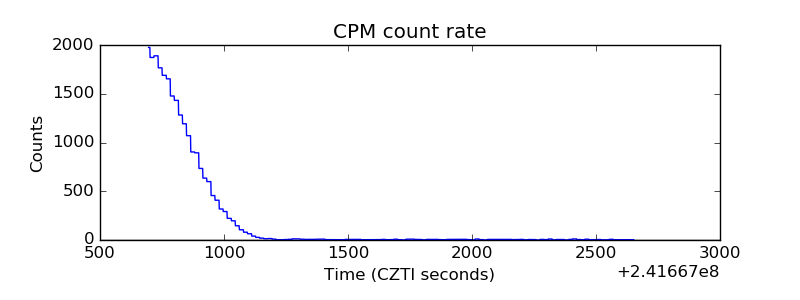 |
| CZT Counter | 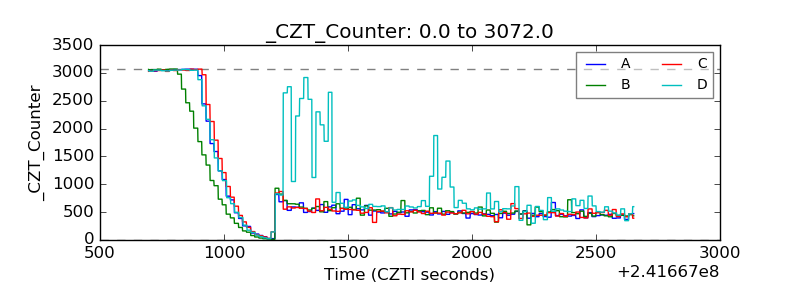 |
| +2.5 Volts monitor |  |
| +5 Volts monitor |  |
| _ROLL_ROT | 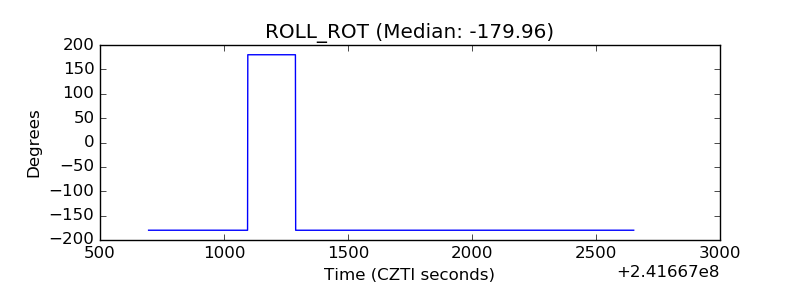 |
| _Roll_DEC | 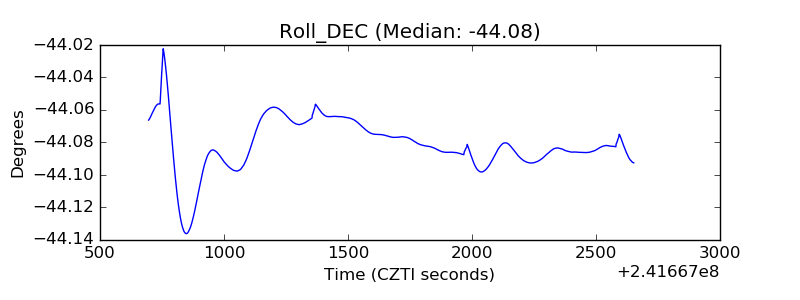 |
| _Roll_RA | 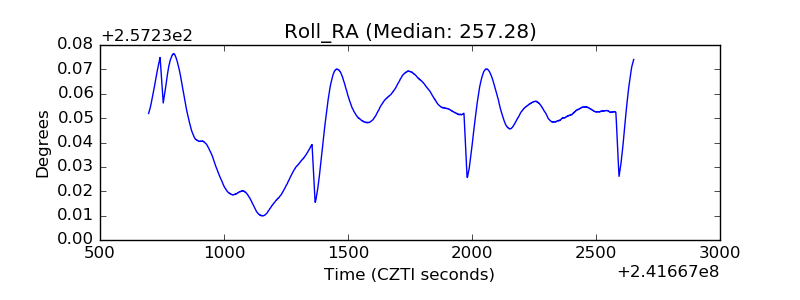 |
| Veto Counter | 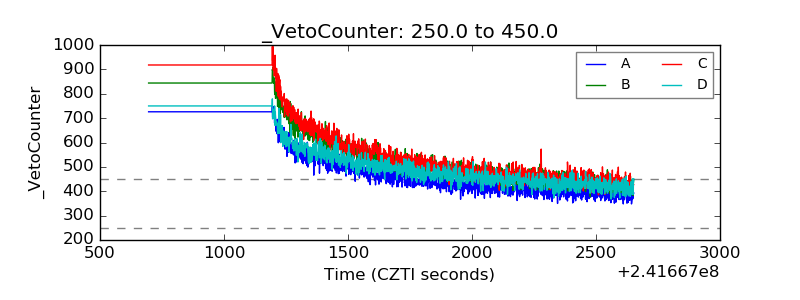 |