| Param | Original file | Final file |
|---|---|---|
| Filename | modeM0/AS1A03_073T01_9000001498_10376cztM0_level2.evt | modeM0/AS1A03_073T01_9000001498_10376cztM0_level2_quad_clean.evt |
| Size (bytes) | 474,194,880 | 66,663,360 |
| Size | 452.2 MB | 63.6 MB |
| Events in quadrant A | 3,102,277 | 395,644 |
| Events in quadrant B | 3,380,174 | 402,990 |
| Events in quadrant C | 3,085,020 | 405,344 |
| Events in quadrant D | 4,361,399 | 370,146 |
| Mode M9 | |||
|---|---|---|---|
| Quadrant | BADHDUFLAG | Total packets | Discarded packets |
| A | 0 | 13 | 0 |
| B | 0 | 13 | 0 |
| C | 0 | 13 | 0 |
| D | 0 | 13 | 0 |
| Mode SS | |||
|---|---|---|---|
| Quadrant | BADHDUFLAG | Total packets | Discarded packets |
| A | 0 | 128 | 0 |
| B | 0 | 128 | 0 |
| C | 0 | 128 | 0 |
| D | 0 | 128 | 0 |
| Mode M0 | |||
|---|---|---|---|
| Quadrant | BADHDUFLAG | Total packets | Discarded packets |
| A | 0 | 13223 | 2 |
| B | 0 | 13999 | 1 |
| C | 0 | 13215 | 1 |
| D | 0 | 17192 | 1 |
| Quadrant | Total seconds | Saturated seconds | Saturation percentage |
|---|---|---|---|
| A | 6369 | 47 | 0.737949% |
| B | 6369 | 66 | 1.036269% |
| C | 6369 | 40 | 0.628042% |
| D | 6369 | 186 | 2.920396% |
Noise dominated data is calculated using 1-second bins in cleaned event files. If a bin has >2000 counts, and if more than 50% of those come from <1% of pixels, then it is considered to be noise-dominated and hence unusable.
| Quadrant | # 1 sec bins | Bins with >0 counts | Bins with >2000 counts | High rate bins dominated by noise | Noise dominated (total time) | Noise dominated (detector-on time) | Marked lightcurve |
|---|---|---|---|---|---|---|---|
| A | 7609 | 6370 | 0 | 0 | 0.00% | 0.00% | 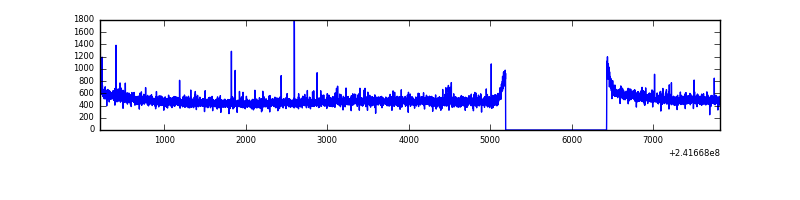 |
| B | 7609 | 6370 | 7 | 7 | 0.09% | 0.11% | 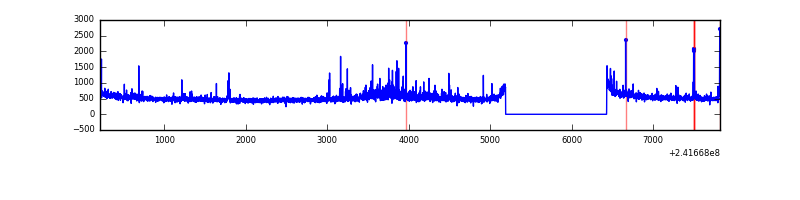 |
| C | 7609 | 6370 | 0 | 0 | 0.00% | 0.00% | 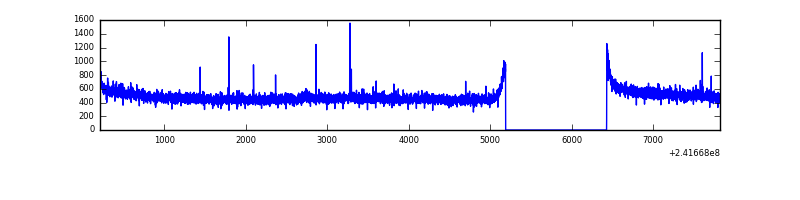 |
| D | 7609 | 6370 | 142 | 142 | 1.87% | 2.23% | 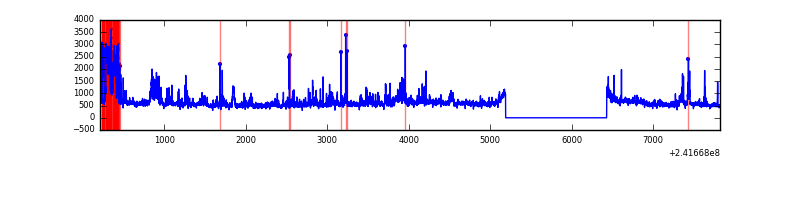 |
Top three noisy pixels from each quadrant. If the there are fewer than three noisy pixels in the level2.evt file, extra rows are filled as -1
| Pixel properties | Quadrant properties | ||||||
|---|---|---|---|---|---|---|---|
| Quadrant | DetID | PixID | Counts | Sigma | Mean | Median | Sigma |
| A | 5 | 16 | 14972 | 88.91 | 798 | 782 | 159.6 |
| A | 3 | 1 | 14968 | 88.89 | 798 | 782 | 159.6 |
| A | 0 | 226 | 7373 | 41.3 | 798 | 782 | 159.6 |
| B | 0 | 214 | 108468 | 722.34 | 804 | 787 | 149.1 |
| B | 4 | 239 | 64270 | 425.86 | 804 | 787 | 149.1 |
| B | 11 | 51 | 37819 | 248.42 | 804 | 787 | 149.1 |
| C | 14 | 234 | 10317 | 53.11 | 787 | 792 | 179.3 |
| C | 13 | 61 | 5830 | 28.09 | 787 | 792 | 179.3 |
| C | 15 | 48 | 3709 | 16.27 | 787 | 792 | 179.3 |
| D | 8 | 195 | 540801 | 2970.48 | 764 | 745 | 181.8 |
| D | 1 | 52 | 349965 | 1920.82 | 764 | 745 | 181.8 |
| D | 14 | 34 | 208768 | 1144.19 | 764 | 745 | 181.8 |
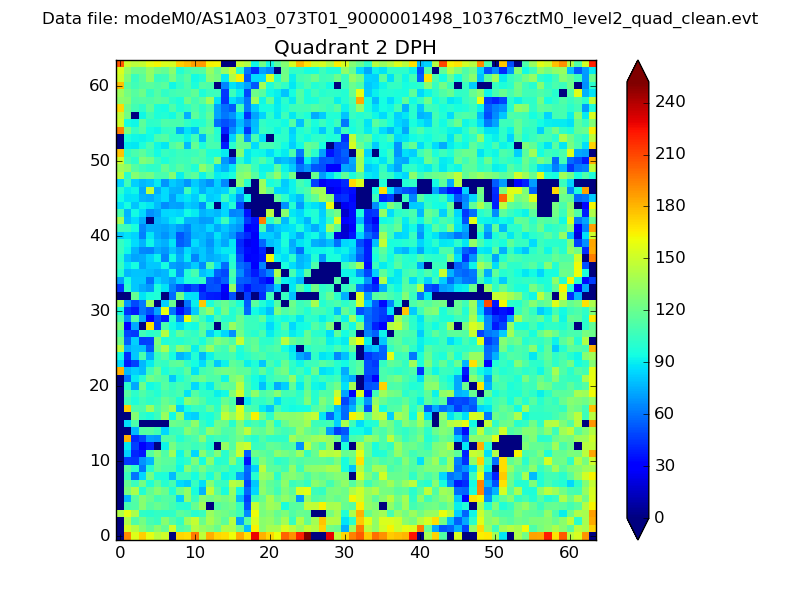
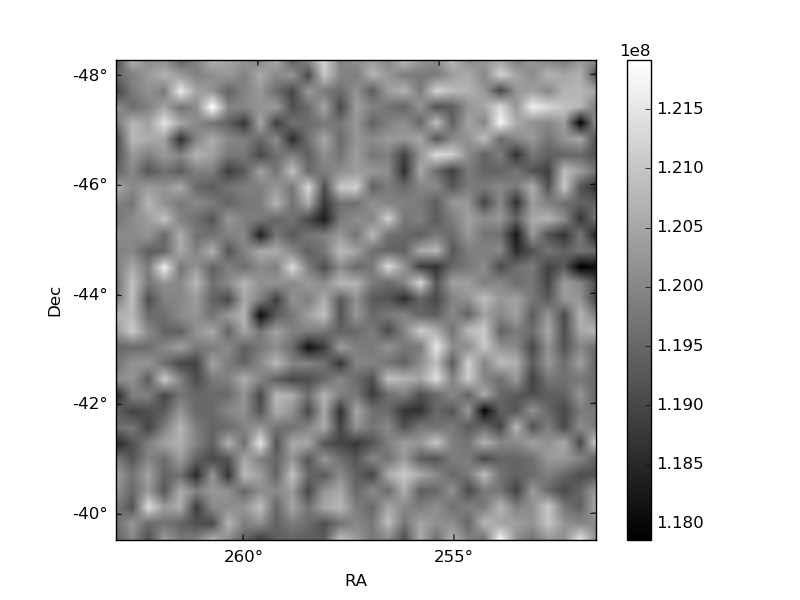
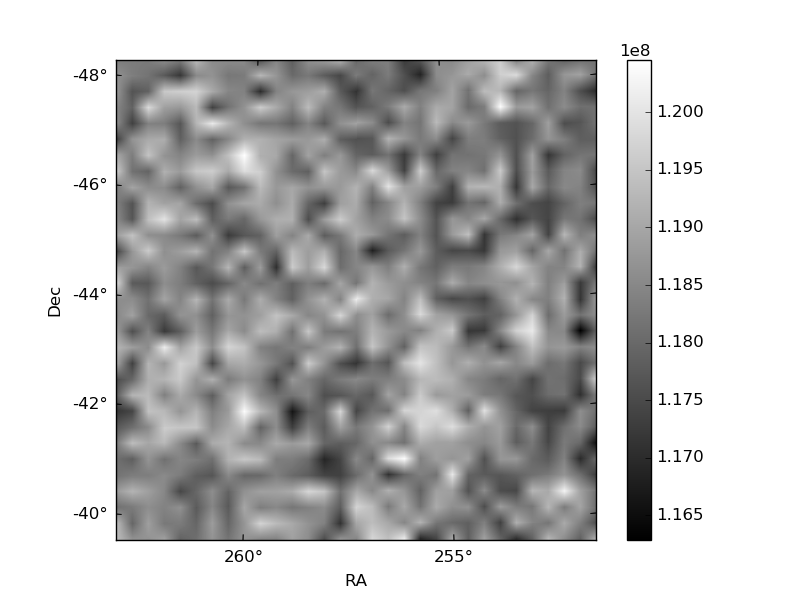
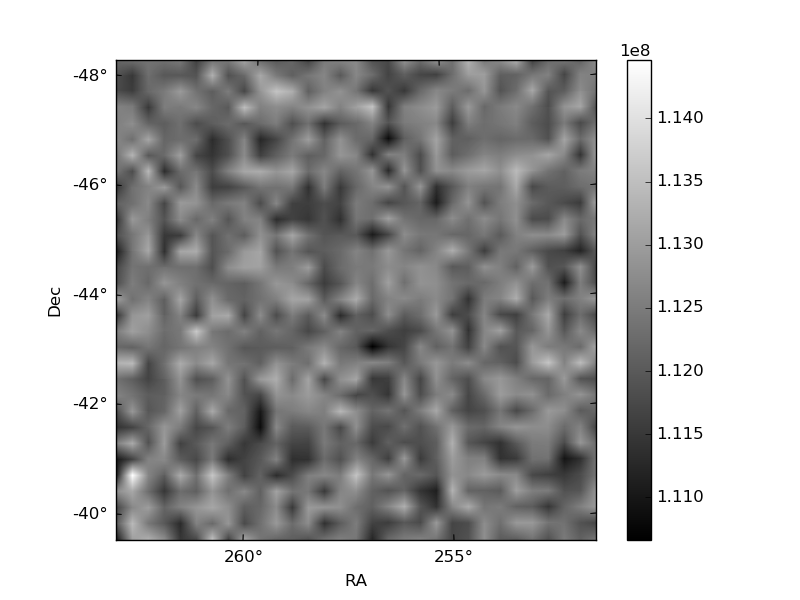
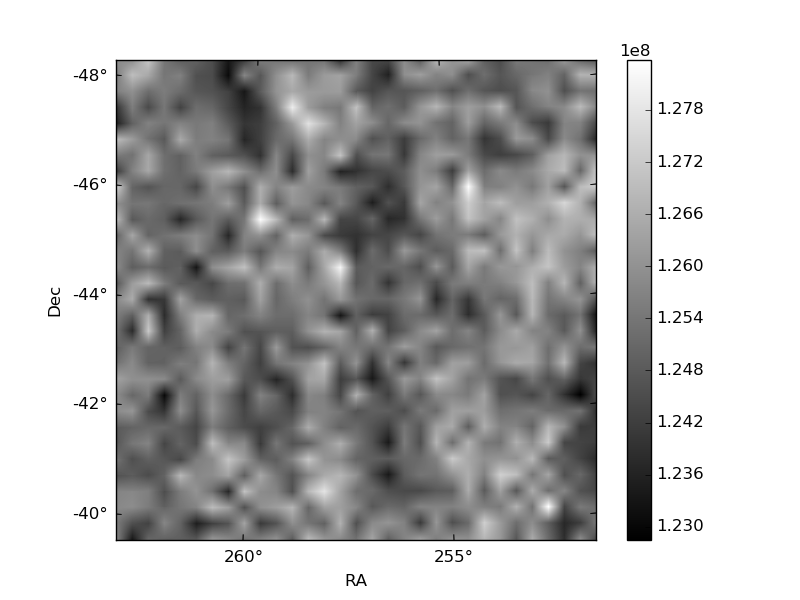
Histogram calculated using DETX and DETY for each event in the final _common_clean file
| Quadrant A |  |
 |
Quadrant B |
|---|---|---|---|
| Quadrant D | 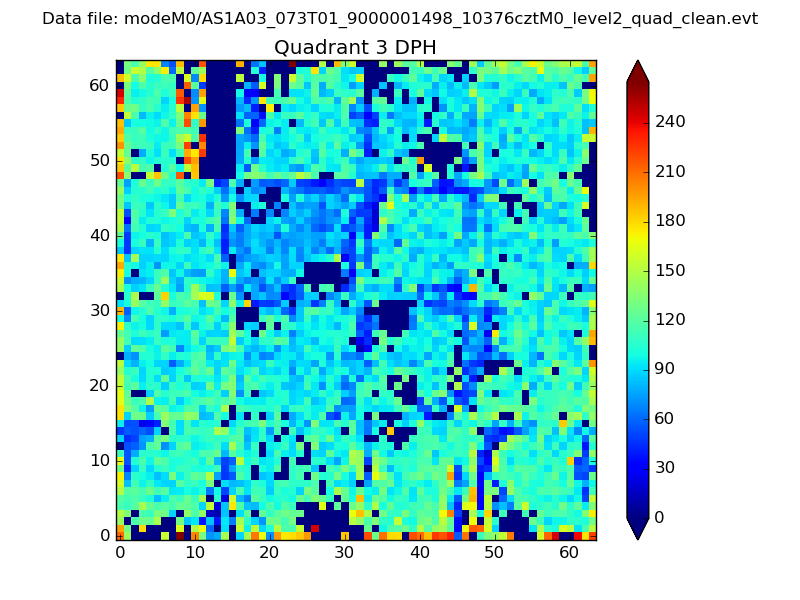 |
 |
Quadrant C |
| Plot type | Count rate plots | Images |
|---|---|---|
| Comparison with Poisson distribution Blue bars denote a histogram of data divided into 1 sec bins. Red curve is a Poisson curve with rate = median count rate of data. |
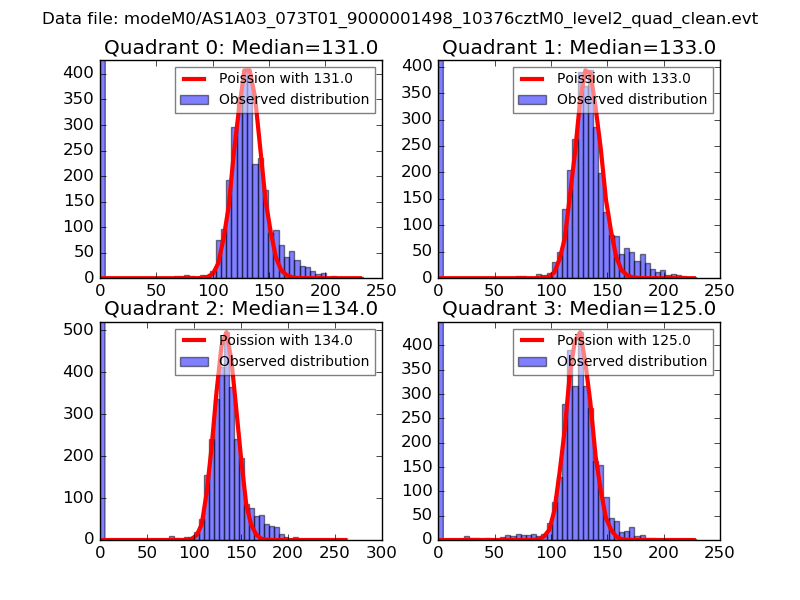 |
 |
| Quadrant-wise count rates Data is divided into 100 sec bins |
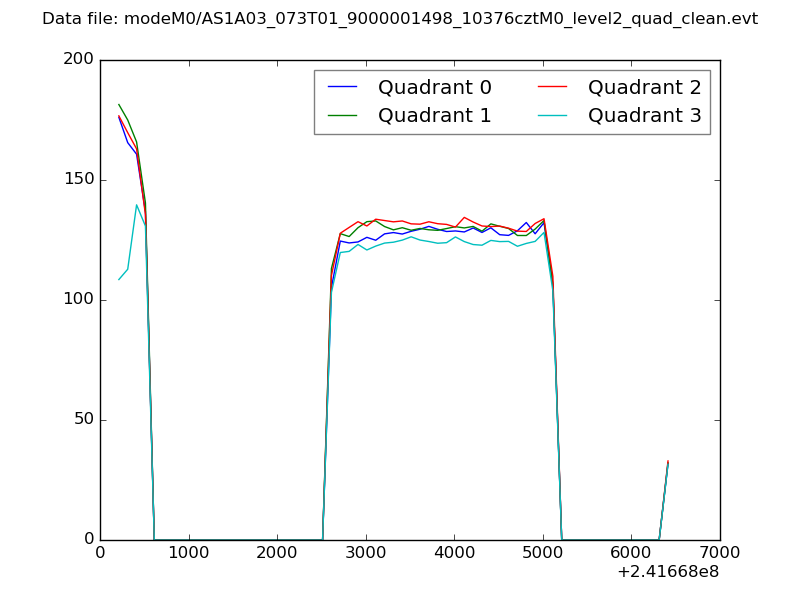 |
|
| Module-wise count rates for Quadrant A Data is divided into 100 sec bins |
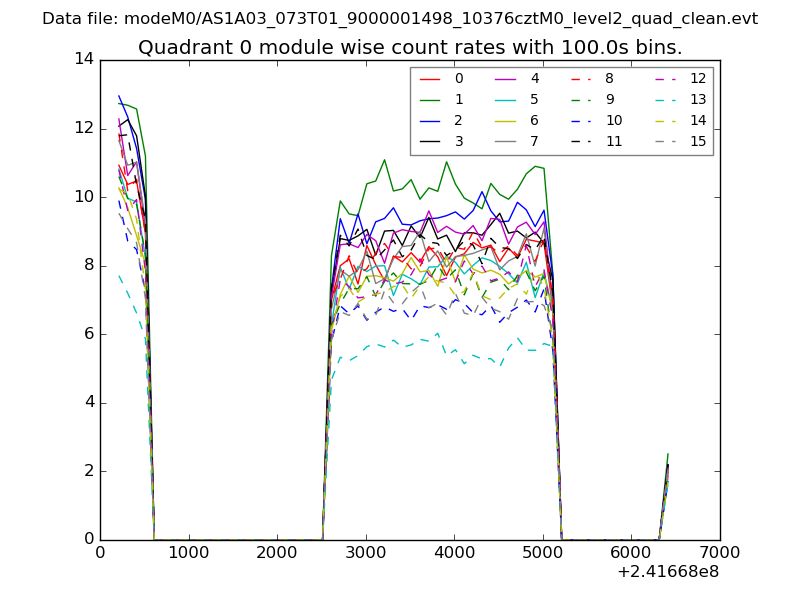 |
 |
| Module-wise count rates for Quadrant B Data is divided into 100 sec bins |
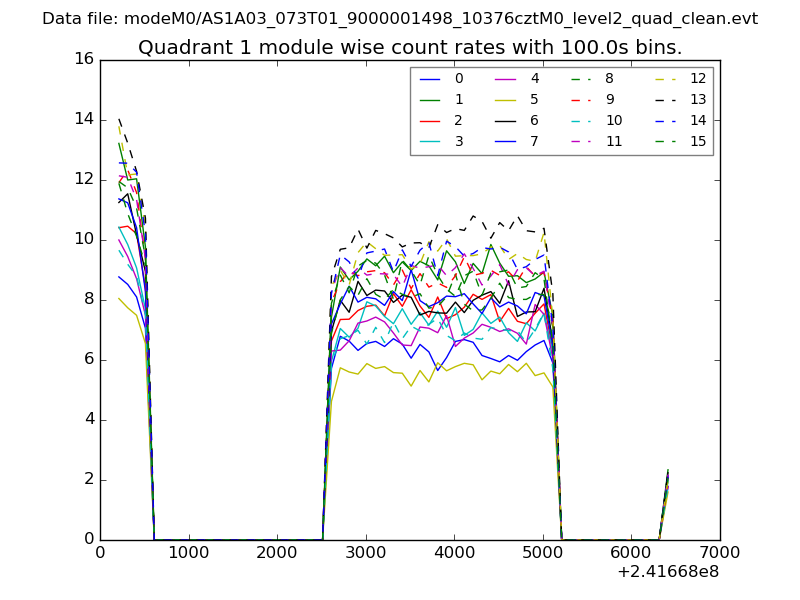 |
 |
| Module-wise count rates for Quadrant C Data is divided into 100 sec bins |
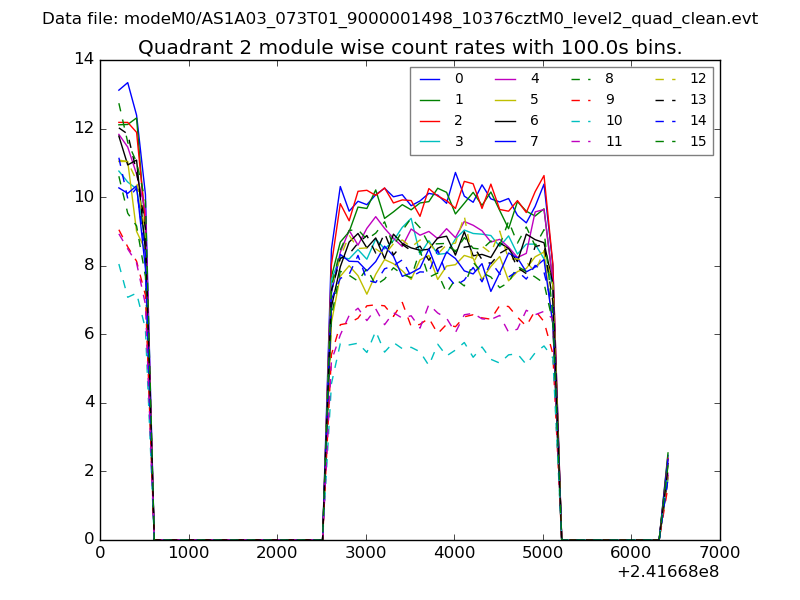 |
 |
| Module-wise count rates for Quadrant D Data is divided into 100 sec bins |
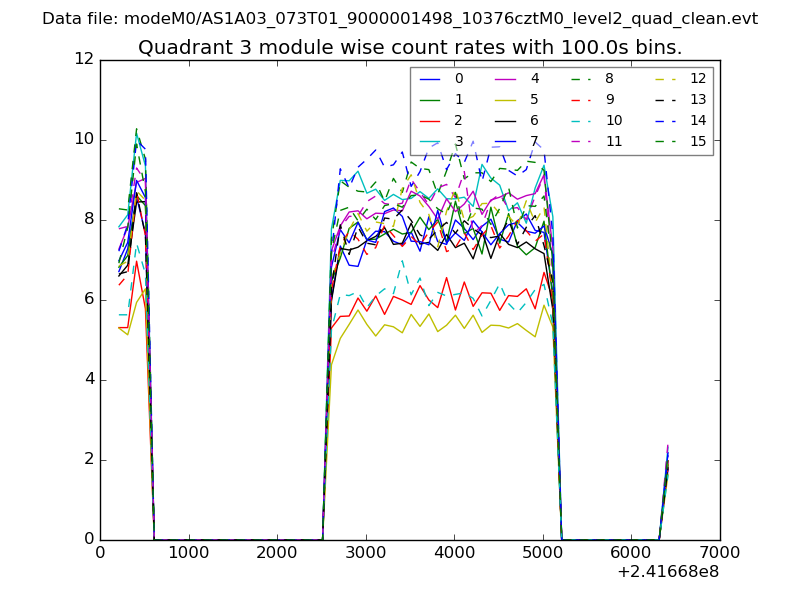 |
 |
| Parameter | Plot |
|---|---|
| CZT HV Monitor | 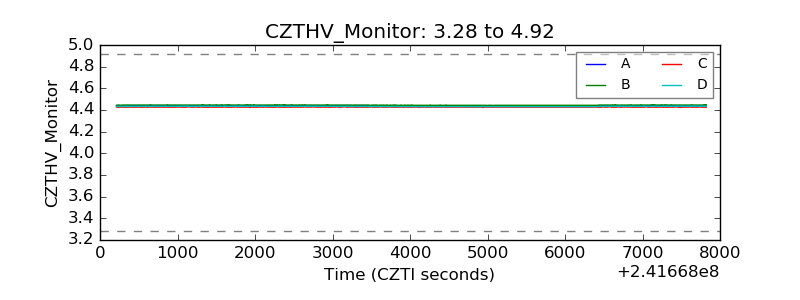 |
| D_VDD | 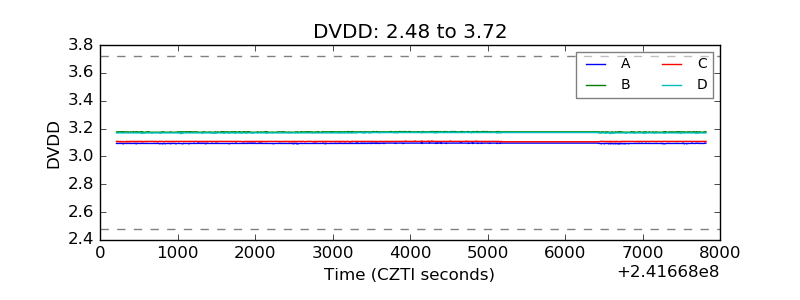 |
| Temperature 1 | 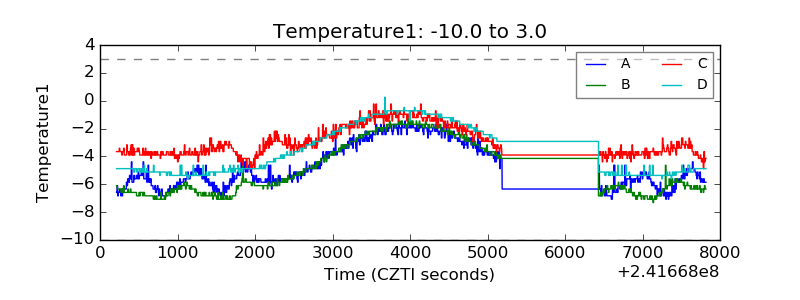 |
| Veto HV Monitor | 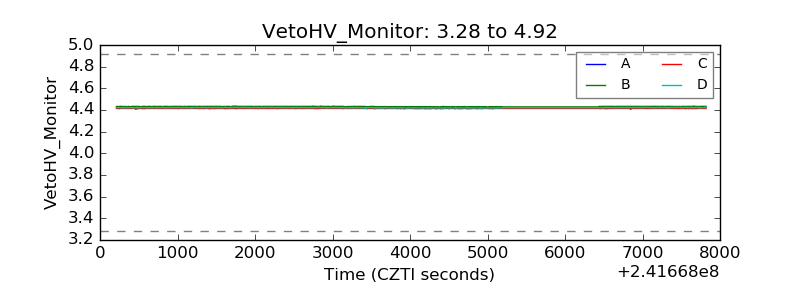 |
| Veto LLD | 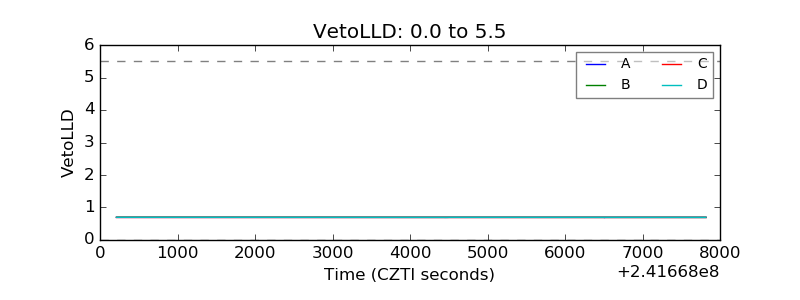 |
| Alpha Counter | 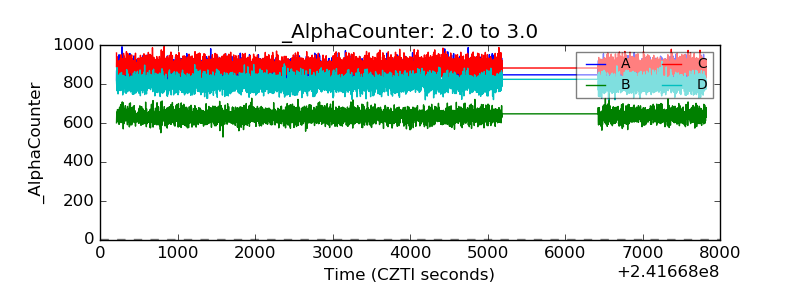 |
| _CPM_Rate | 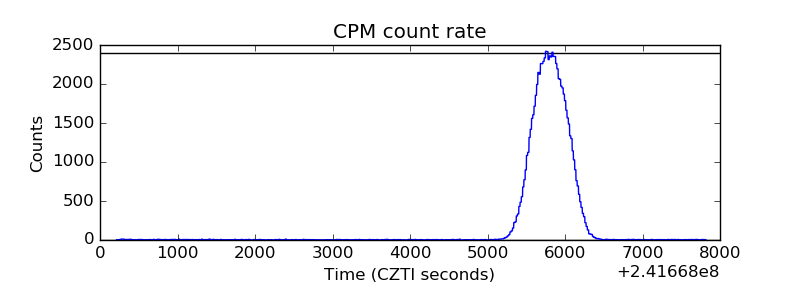 |
| CZT Counter | 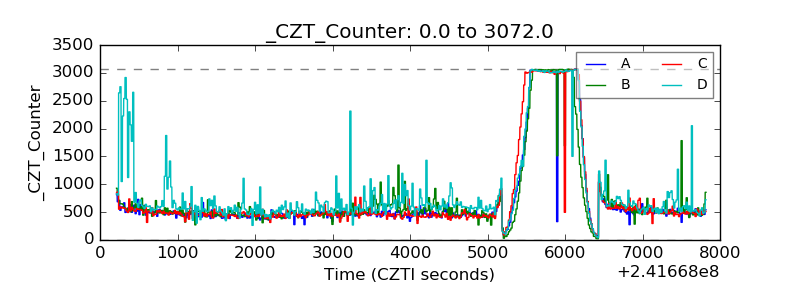 |
| +2.5 Volts monitor |  |
| +5 Volts monitor |  |
| _ROLL_ROT | 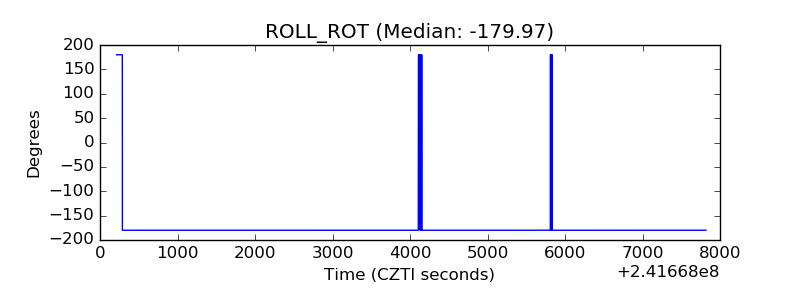 |
| _Roll_DEC | 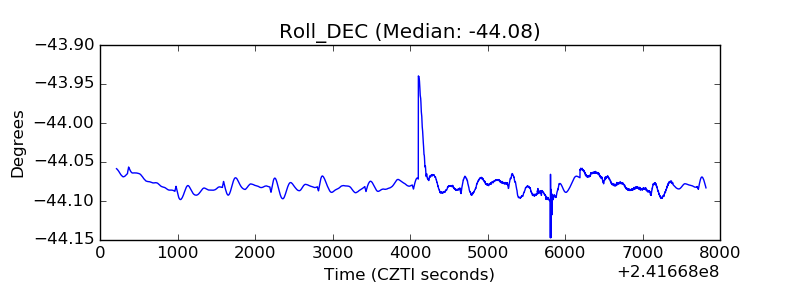 |
| _Roll_RA | 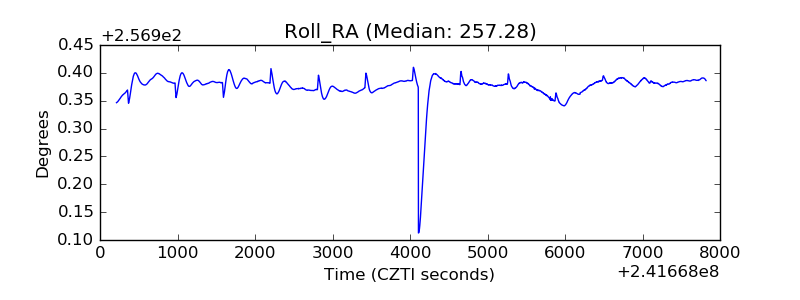 |
| Veto Counter | 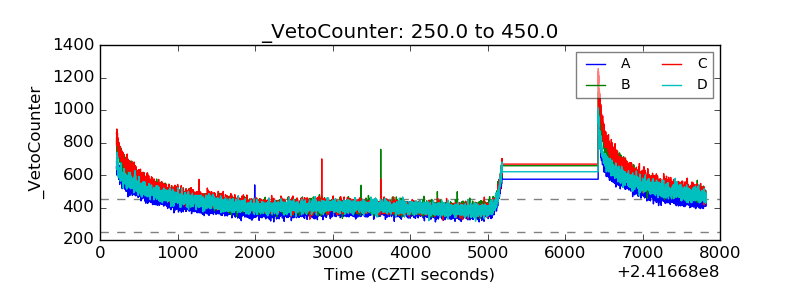 |