| Param | Original file | Final file |
|---|---|---|
| Filename | modeM0/AS1A03_073T01_9000001498_10378cztM0_level2.evt | modeM0/AS1A03_073T01_9000001498_10378cztM0_level2_quad_clean.evt |
| Size (bytes) | 451,497,600 | 74,574,720 |
| Size | 430.6 MB | 71.1 MB |
| Events in quadrant A | 3,187,987 | 455,662 |
| Events in quadrant B | 3,406,761 | 460,776 |
| Events in quadrant C | 3,132,387 | 466,597 |
| Events in quadrant D | 3,524,112 | 441,033 |
| Mode M9 | |||
|---|---|---|---|
| Quadrant | BADHDUFLAG | Total packets | Discarded packets |
| A | 0 | 19 | 0 |
| B | 0 | 19 | 0 |
| C | 0 | 19 | 0 |
| D | 0 | 20 | 0 |
| Mode SS | |||
|---|---|---|---|
| Quadrant | BADHDUFLAG | Total packets | Discarded packets |
| A | 0 | 128 | 0 |
| B | 0 | 128 | 0 |
| C | 0 | 128 | 0 |
| D | 0 | 128 | 0 |
| Mode M0 | |||
|---|---|---|---|
| Quadrant | BADHDUFLAG | Total packets | Discarded packets |
| A | 0 | 13172 | 3 |
| B | 0 | 13761 | 7 |
| C | 0 | 13038 | 4 |
| D | 0 | 14259 | 2 |
| Quadrant | Total seconds | Saturated seconds | Saturation percentage |
|---|---|---|---|
| A | 6212 | 68 | 1.094656% |
| B | 6210 | 136 | 2.190016% |
| C | 6211 | 56 | 0.901626% |
| D | 6212 | 89 | 1.432711% |
Noise dominated data is calculated using 1-second bins in cleaned event files. If a bin has >2000 counts, and if more than 50% of those come from <1% of pixels, then it is considered to be noise-dominated and hence unusable.
| Quadrant | # 1 sec bins | Bins with >0 counts | Bins with >2000 counts | High rate bins dominated by noise | Noise dominated (total time) | Noise dominated (detector-on time) | Marked lightcurve |
|---|---|---|---|---|---|---|---|
| A | 7542 | 6212 | 1 | 1 | 0.01% | 0.02% | 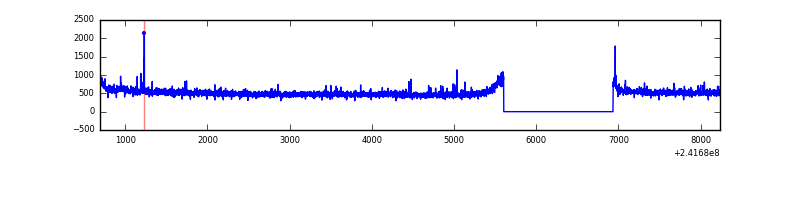 |
| B | 7542 | 6212 | 33 | 33 | 0.44% | 0.53% |  |
| C | 7542 | 6212 | 1 | 1 | 0.01% | 0.02% | 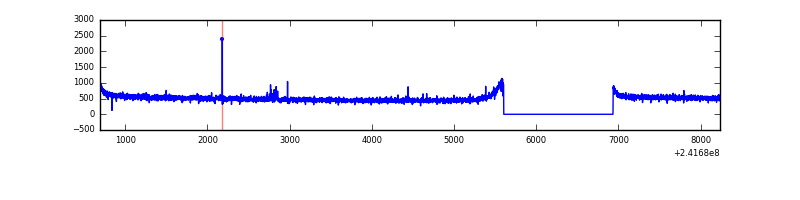 |
| D | 7542 | 6212 | 32 | 32 | 0.42% | 0.52% |  |
Top three noisy pixels from each quadrant. If the there are fewer than three noisy pixels in the level2.evt file, extra rows are filled as -1
| Pixel properties | Quadrant properties | ||||||
|---|---|---|---|---|---|---|---|
| Quadrant | DetID | PixID | Counts | Sigma | Mean | Median | Sigma |
| A | 3 | 1 | 20109 | 119.97 | 814 | 799 | 161.0 |
| A | 8 | 15 | 18246 | 108.4 | 814 | 799 | 161.0 |
| A | 5 | 16 | 15843 | 93.47 | 814 | 799 | 161.0 |
| B | 4 | 239 | 197629 | 1313.1 | 812 | 796 | 149.9 |
| B | 0 | 214 | 21389 | 137.38 | 812 | 796 | 149.9 |
| B | 0 | 197 | 16081 | 101.97 | 812 | 796 | 149.9 |
| C | 14 | 234 | 13393 | 69.51 | 799 | 805 | 181.1 |
| C | 13 | 61 | 6010 | 28.74 | 799 | 805 | 181.1 |
| C | 14 | 67 | 2477 | 9.23 | 799 | 805 | 181.1 |
| D | 2 | 33 | 213951 | 1147.08 | 791 | 771 | 185.8 |
| D | 8 | 195 | 110225 | 588.95 | 791 | 771 | 185.8 |
| D | 1 | 20 | 89711 | 478.57 | 791 | 771 | 185.8 |
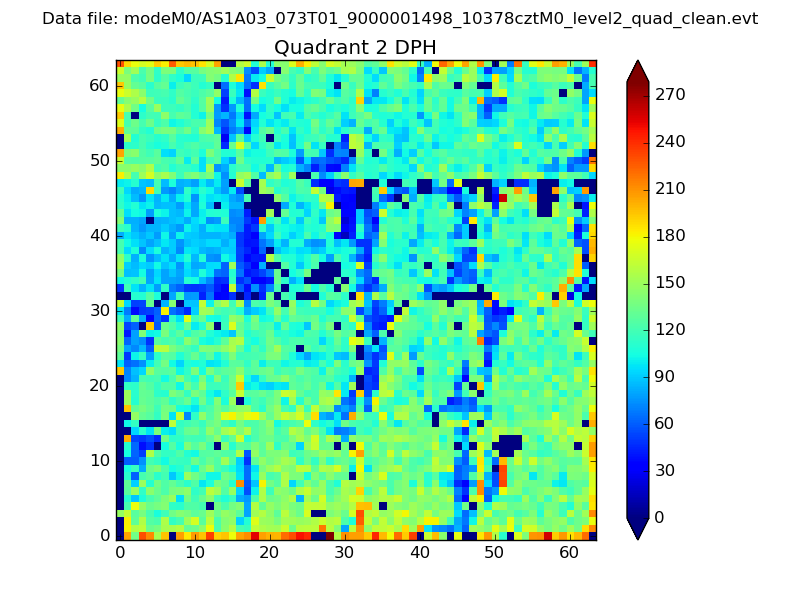
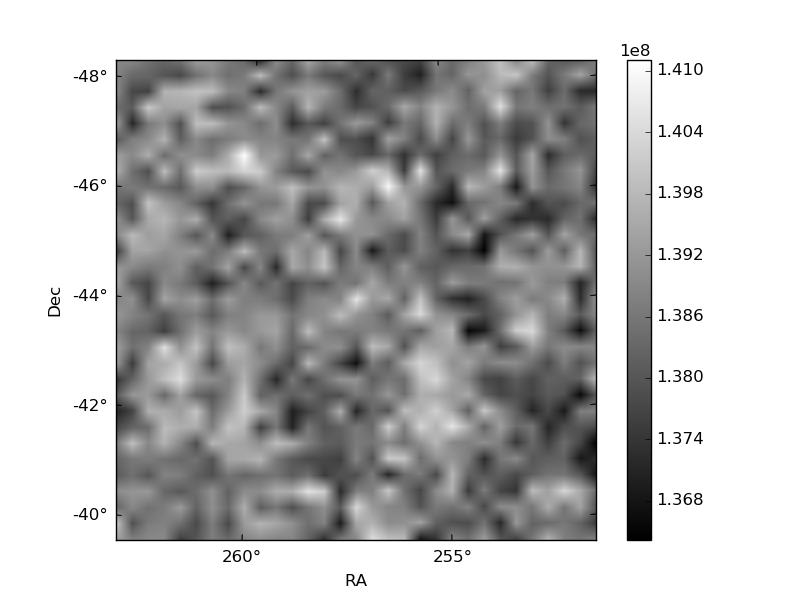
Histogram calculated using DETX and DETY for each event in the final _common_clean file
| Quadrant A | 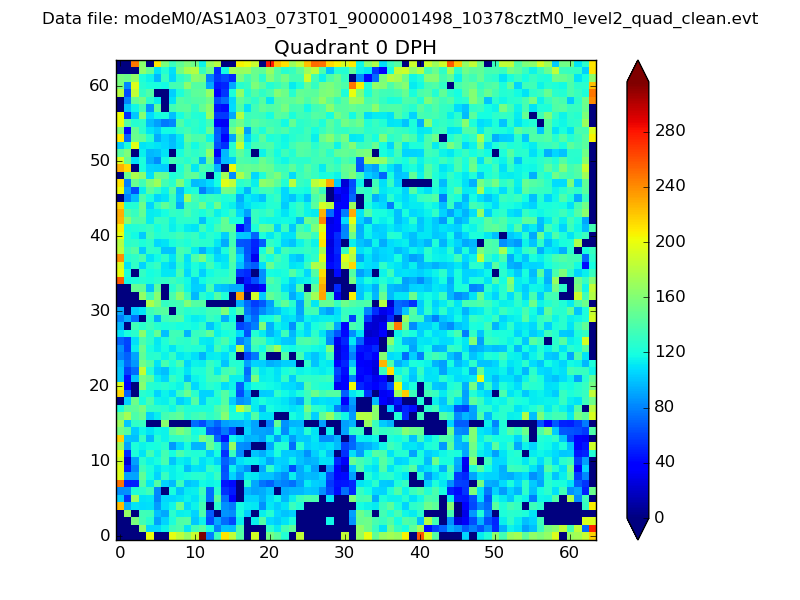 |
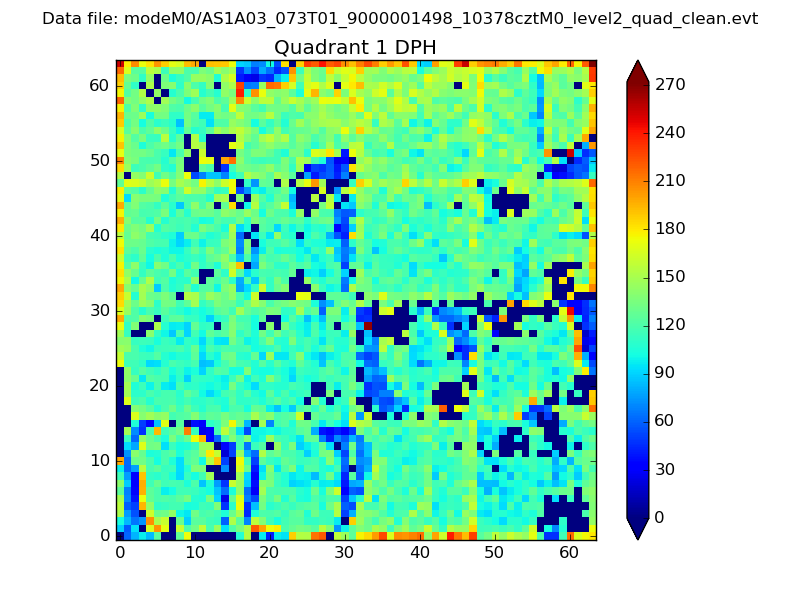 |
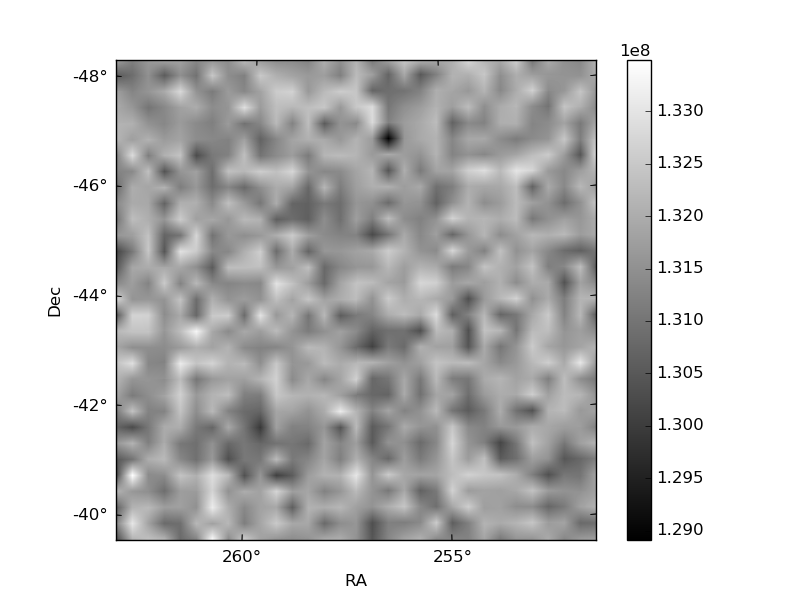
Quadrant B |
|---|---|---|---|
| Quadrant D | 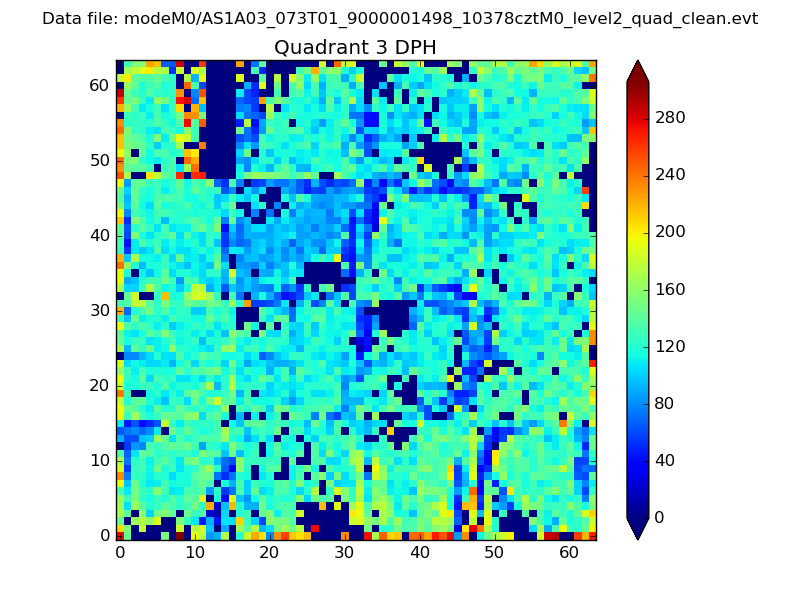 |
 |
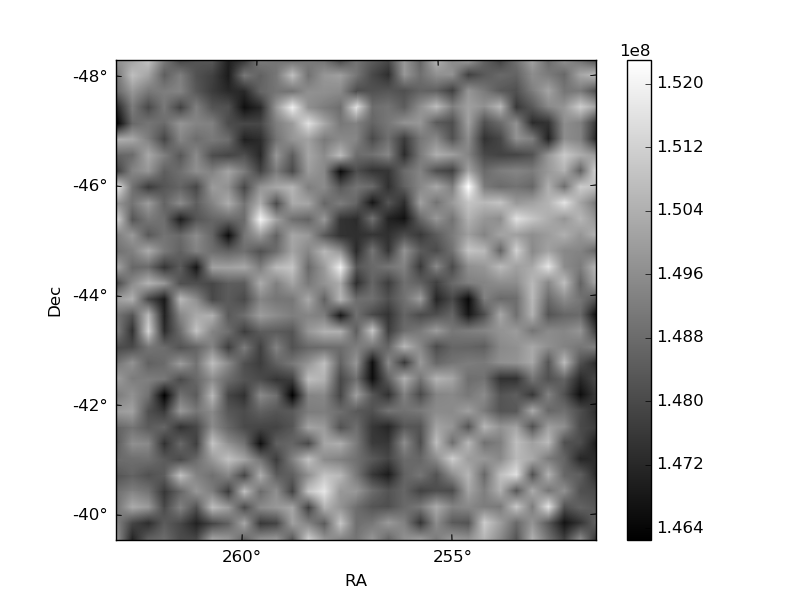
Quadrant C |
| Plot type | Count rate plots | Images |
|---|---|---|
| Comparison with Poisson distribution Blue bars denote a histogram of data divided into 1 sec bins. Red curve is a Poisson curve with rate = median count rate of data. |
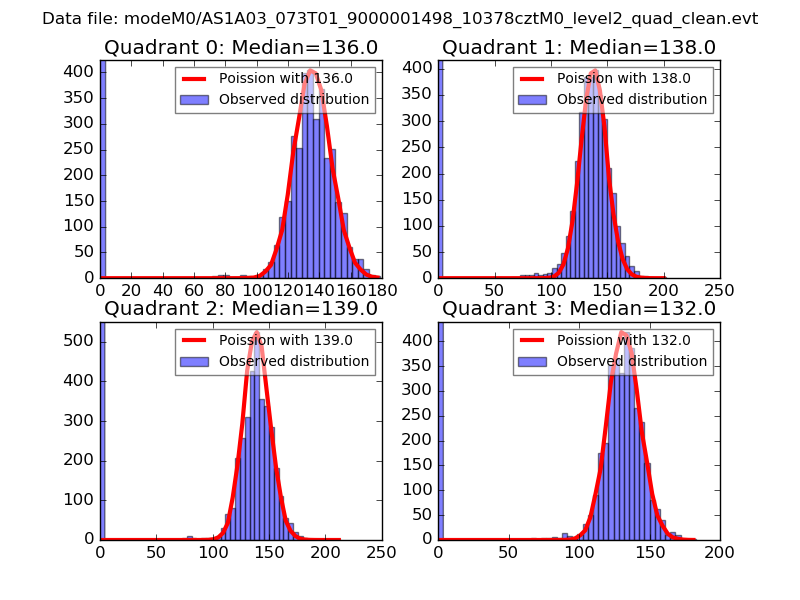 |
 |
| Quadrant-wise count rates Data is divided into 100 sec bins |
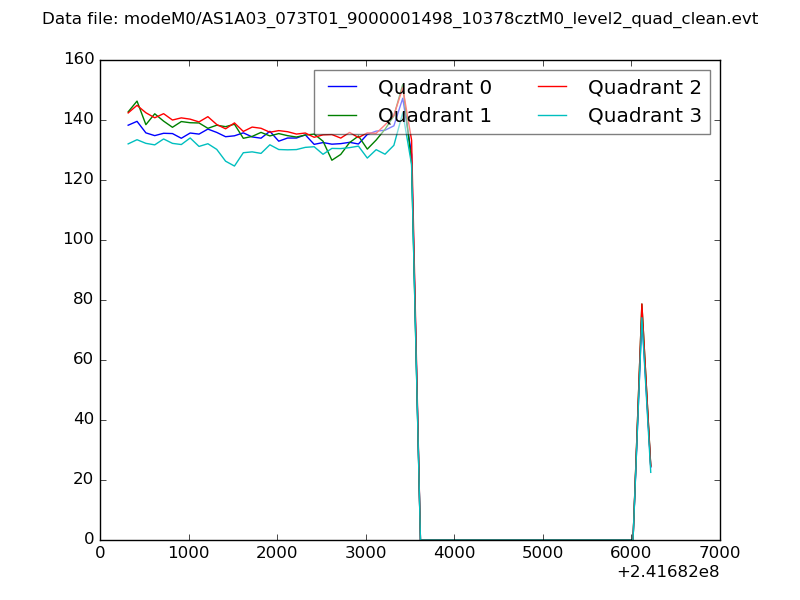 |
|
| Module-wise count rates for Quadrant A Data is divided into 100 sec bins |
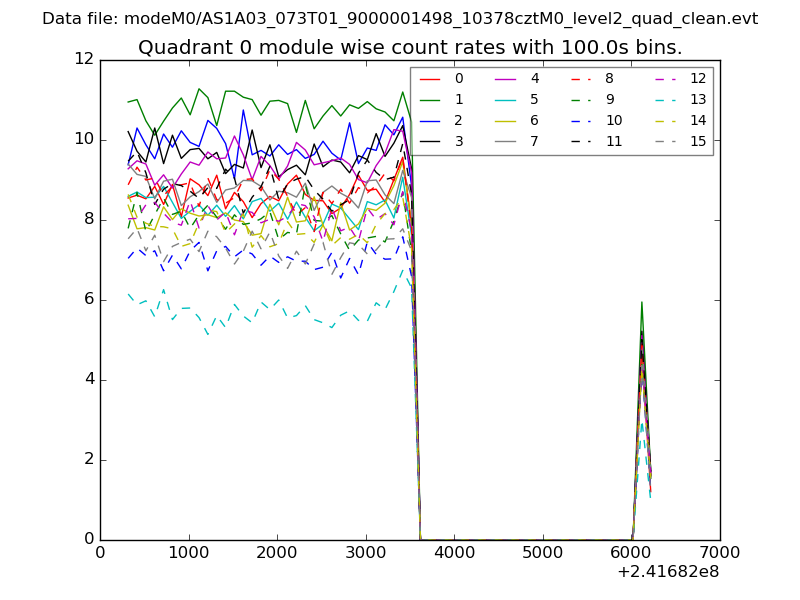 |
 |
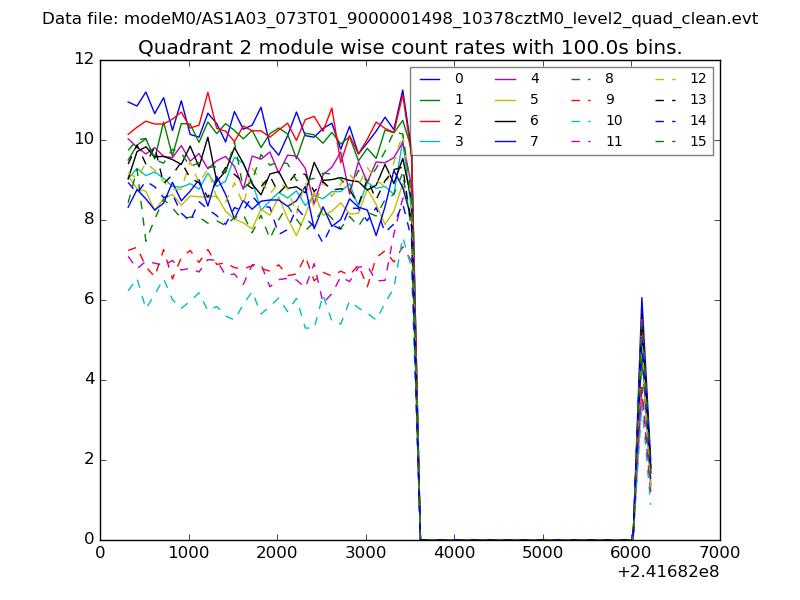
| Module-wise count rates for Quadrant B Data is divided into 100 sec bins |
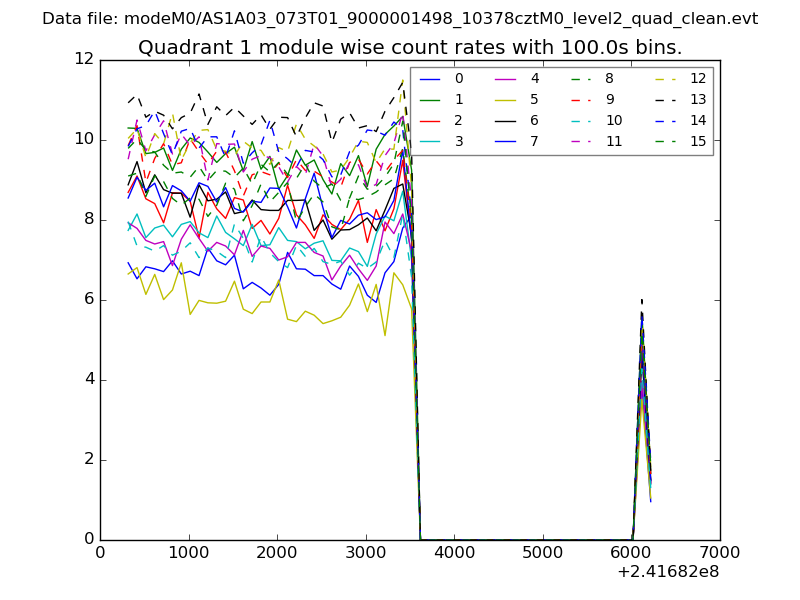 |
 |
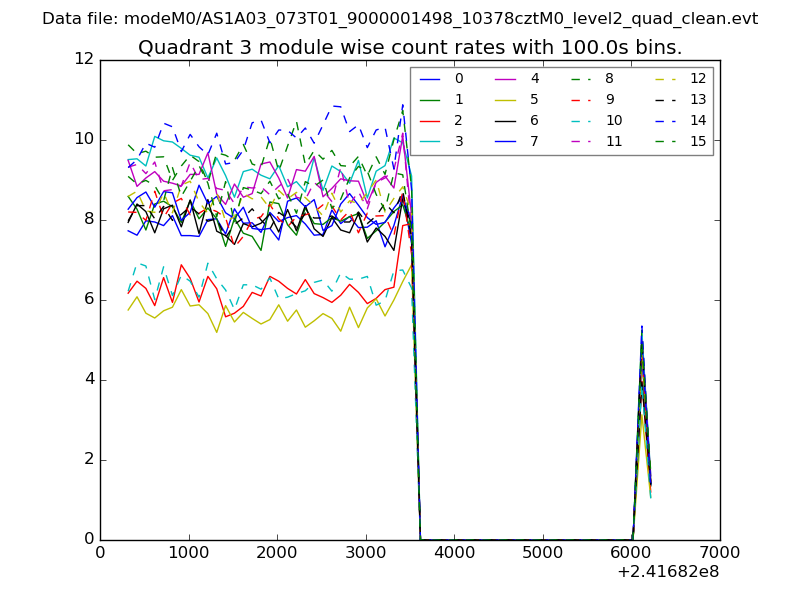
| Module-wise count rates for Quadrant C Data is divided into 100 sec bins |
 |
 |
| Module-wise count rates for Quadrant D Data is divided into 100 sec bins |
 |
 |
| Parameter | Plot |
|---|---|
| CZT HV Monitor | 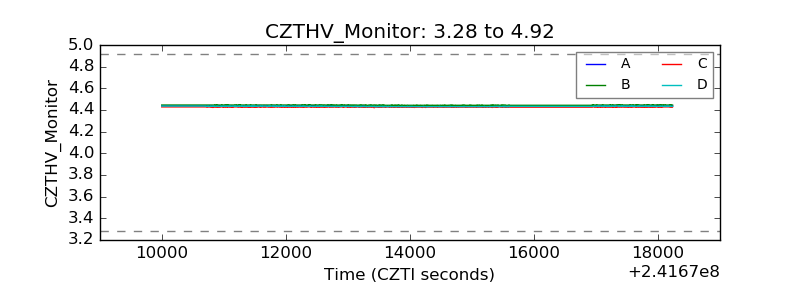 |
| D_VDD | 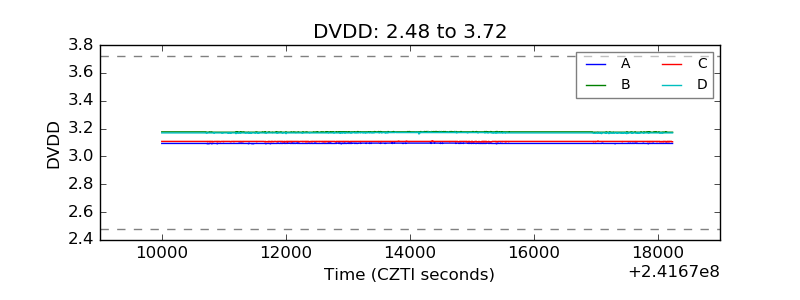 |
| Temperature 1 | 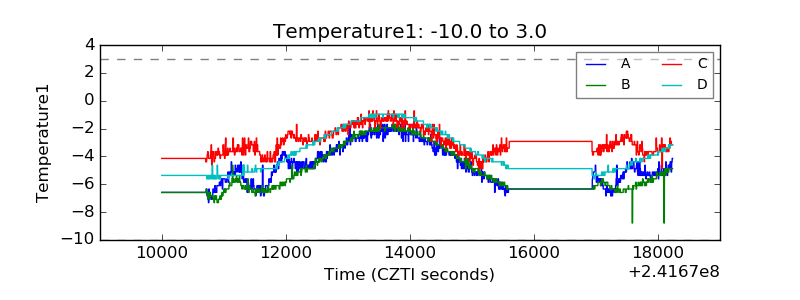 |
| Veto HV Monitor | 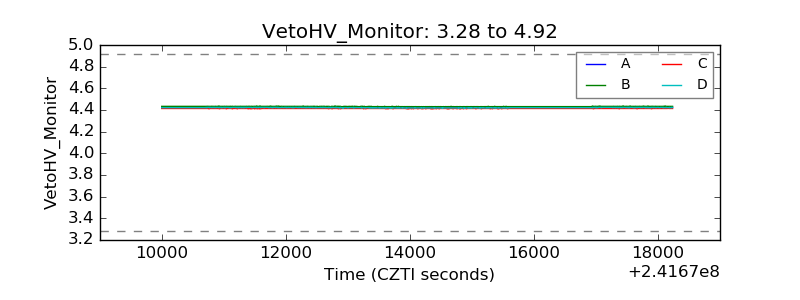 |
| Veto LLD | 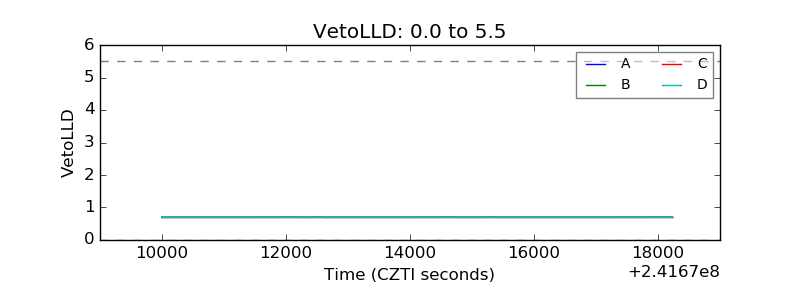 |
| Alpha Counter | 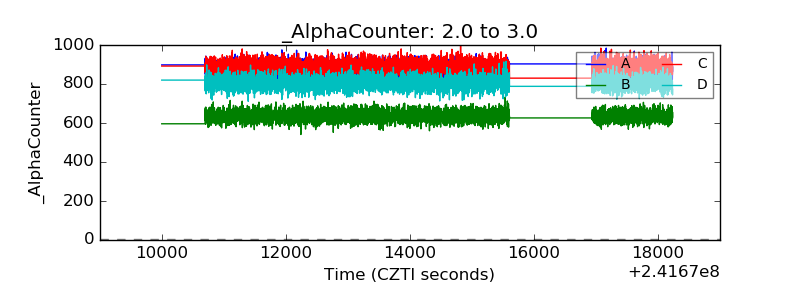 |
| _CPM_Rate | 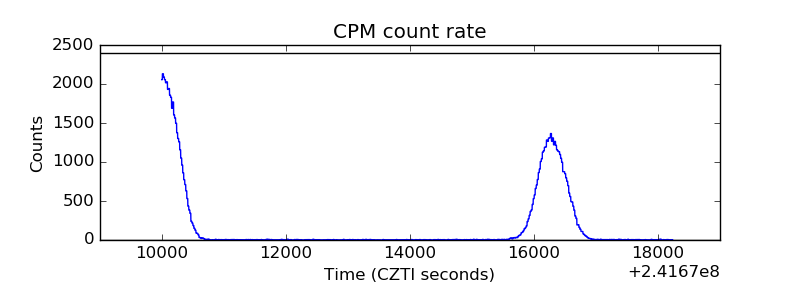 |
| CZT Counter | 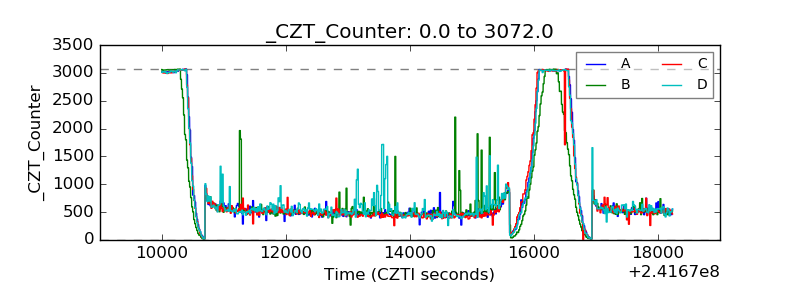 |
| +2.5 Volts monitor |  |
| +5 Volts monitor |  |
| _ROLL_ROT | 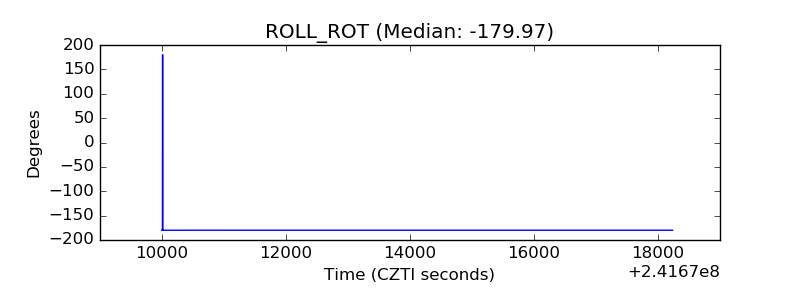 |
| _Roll_DEC | 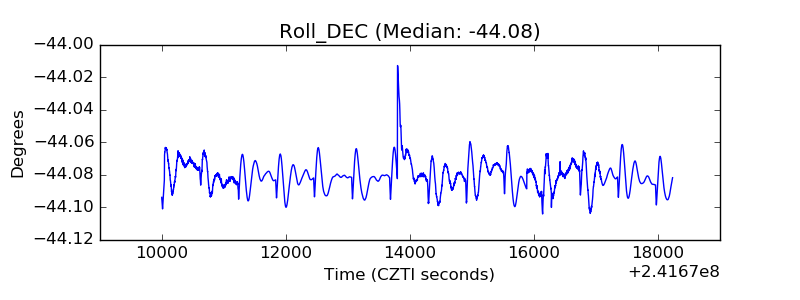 |
| _Roll_RA | 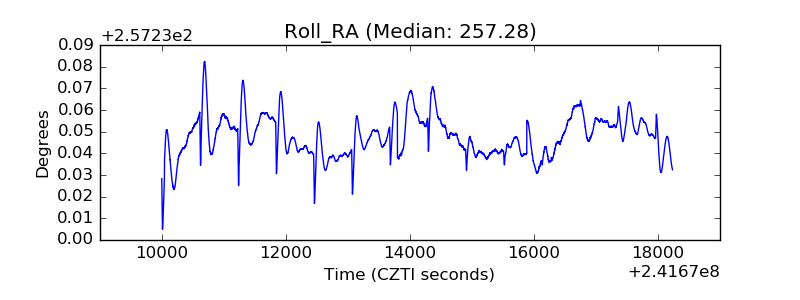 |
| Veto Counter | 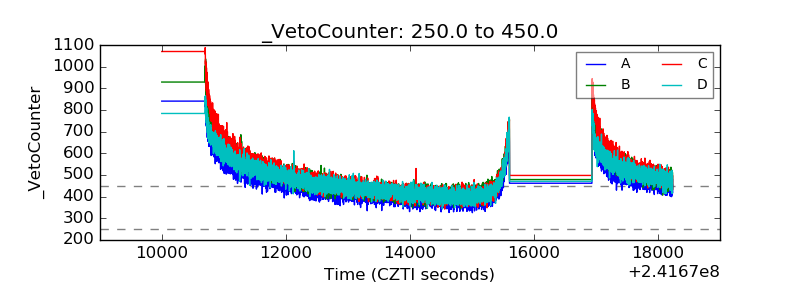 |