| Param | Original file | Final file |
|---|---|---|
| Filename | modeM0/AS1A03_073T01_9000001498_10379cztM0_level2.evt | modeM0/AS1A03_073T01_9000001498_10379cztM0_level2_quad_clean.evt |
| Size (bytes) | 463,144,320 | 90,239,040 |
| Size | 441.7 MB | 86.1 MB |
| Events in quadrant A | 3,183,948 | 574,855 |
| Events in quadrant B | 3,383,514 | 581,784 |
| Events in quadrant C | 3,142,406 | 583,152 |
| Events in quadrant D | 3,884,140 | 548,949 |
| Mode M9 | |||
|---|---|---|---|
| Quadrant | BADHDUFLAG | Total packets | Discarded packets |
| A | 0 | 19 | 0 |
| B | 0 | 19 | 0 |
| C | 0 | 19 | 0 |
| D | 0 | 20 | 0 |
| Mode SS | |||
|---|---|---|---|
| Quadrant | BADHDUFLAG | Total packets | Discarded packets |
| A | 0 | 128 | 0 |
| B | 0 | 128 | 0 |
| C | 0 | 128 | 0 |
| D | 0 | 128 | 0 |
| Mode M0 | |||
|---|---|---|---|
| Quadrant | BADHDUFLAG | Total packets | Discarded packets |
| A | 0 | 13293 | 2 |
| B | 0 | 13837 | 1 |
| C | 0 | 13309 | 1 |
| D | 0 | 15595 | 1 |
| Quadrant | Total seconds | Saturated seconds | Saturation percentage |
|---|---|---|---|
| A | 6367 | 147 | 2.308780% |
| B | 6367 | 175 | 2.748547% |
| C | 6367 | 141 | 2.214544% |
| D | 6367 | 177 | 2.779959% |
Noise dominated data is calculated using 1-second bins in cleaned event files. If a bin has >2000 counts, and if more than 50% of those come from <1% of pixels, then it is considered to be noise-dominated and hence unusable.
| Quadrant | # 1 sec bins | Bins with >0 counts | Bins with >2000 counts | High rate bins dominated by noise | Noise dominated (total time) | Noise dominated (detector-on time) | Marked lightcurve |
|---|---|---|---|---|---|---|---|
| A | 7557 | 6367 | 0 | 0 | 0.00% | 0.00% |  |
| B | 7557 | 6367 | 18 | 18 | 0.24% | 0.28% |  |
| C | 7557 | 6367 | 6 | 6 | 0.08% | 0.09% | 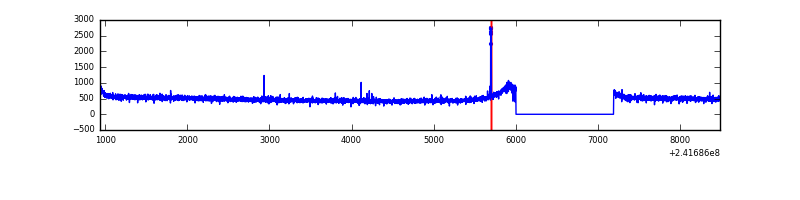 |
| D | 7557 | 6367 | 25 | 25 | 0.33% | 0.39% |  |
Top three noisy pixels from each quadrant. If the there are fewer than three noisy pixels in the level2.evt file, extra rows are filled as -1
| Pixel properties | Quadrant properties | ||||||
|---|---|---|---|---|---|---|---|
| Quadrant | DetID | PixID | Counts | Sigma | Mean | Median | Sigma |
| A | 8 | 15 | 25215 | 149.1 | 817 | 801 | 163.7 |
| A | 3 | 1 | 11458 | 65.08 | 817 | 801 | 163.7 |
| A | 0 | 226 | 7560 | 41.28 | 817 | 801 | 163.7 |
| B | 4 | 239 | 148094 | 962.63 | 813 | 794 | 153.0 |
| B | 0 | 214 | 34918 | 223.01 | 813 | 794 | 153.0 |
| B | 11 | 51 | 19161 | 120.03 | 813 | 794 | 153.0 |
| C | 11 | 7 | 19637 | 103.1 | 798 | 802 | 182.7 |
| C | 14 | 234 | 7293 | 35.53 | 798 | 802 | 182.7 |
| C | 13 | 61 | 5899 | 27.9 | 798 | 802 | 182.7 |
| D | 8 | 195 | 480669 | 2592.04 | 788 | 769 | 185.1 |
| D | 2 | 33 | 172471 | 927.4 | 788 | 769 | 185.1 |
| D | 1 | 20 | 113516 | 608.97 | 788 | 769 | 185.1 |
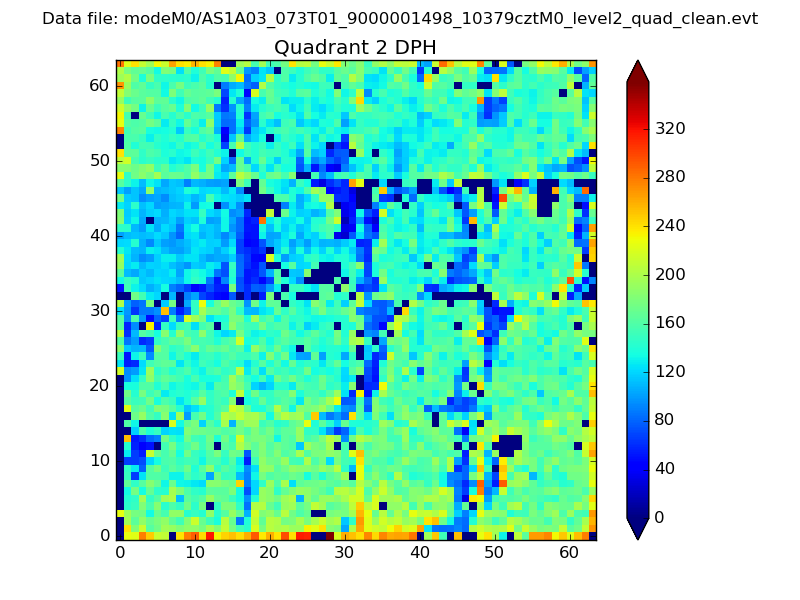
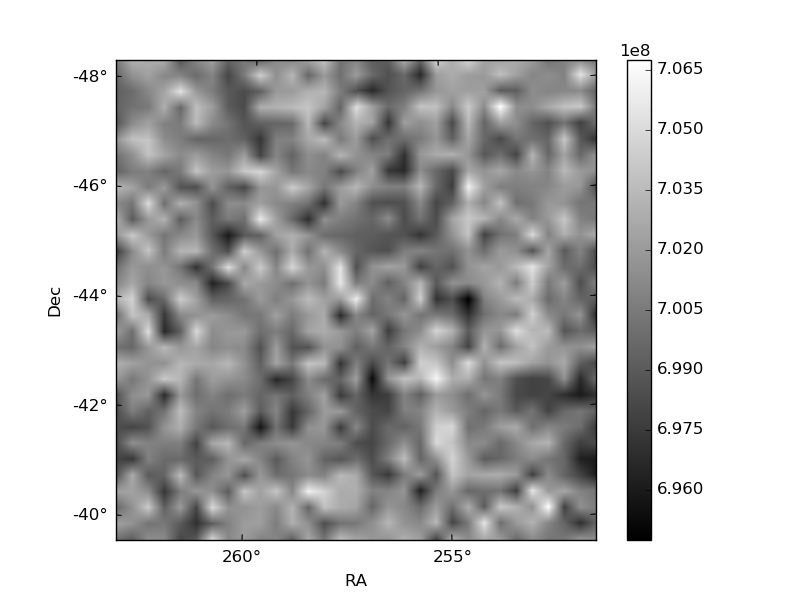
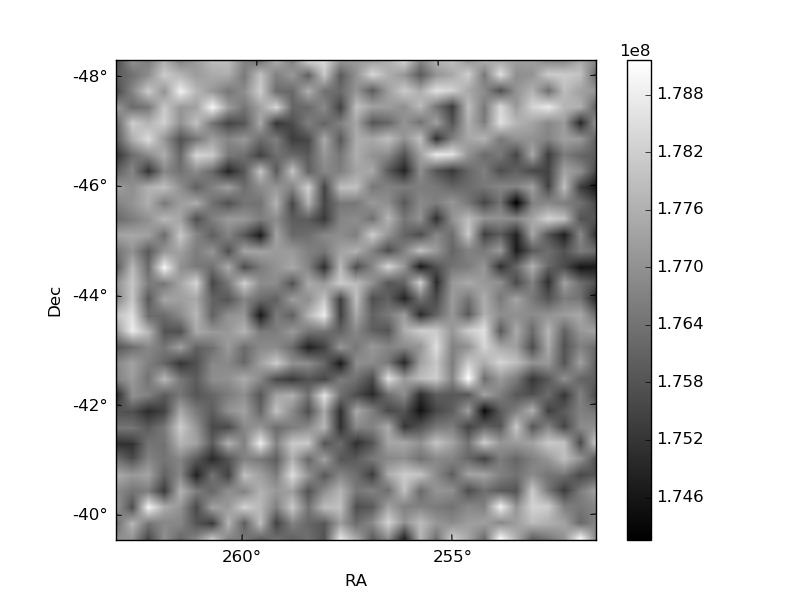
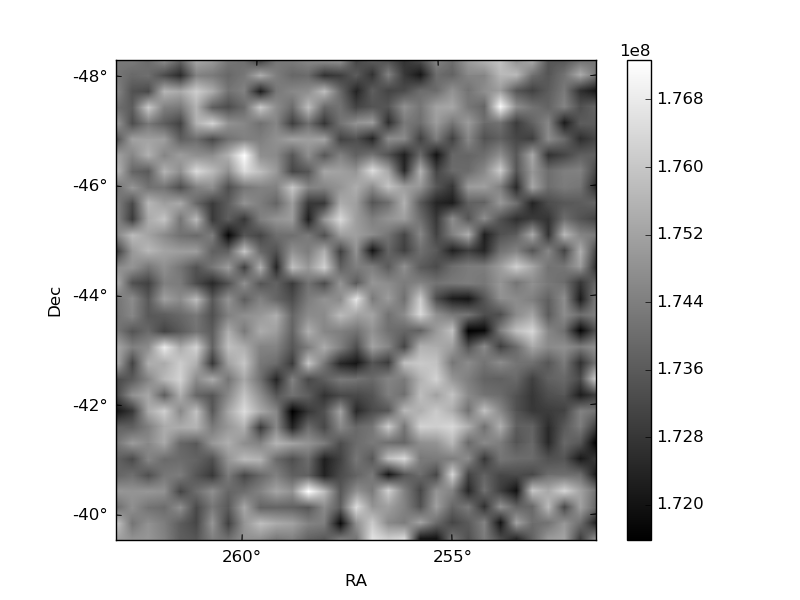
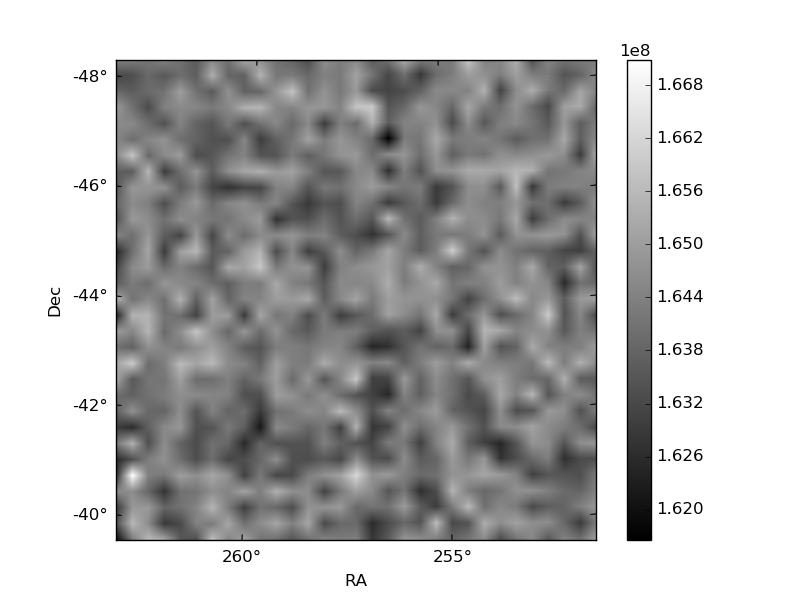
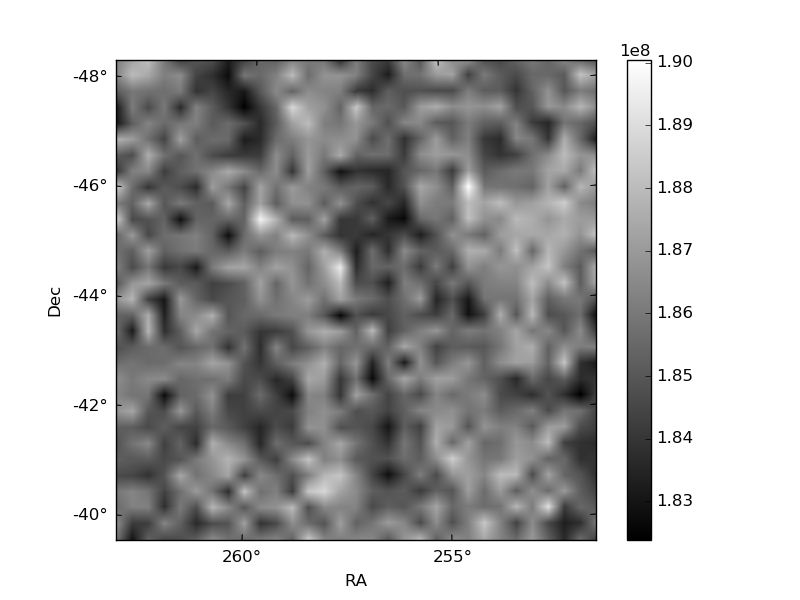
Histogram calculated using DETX and DETY for each event in the final _common_clean file
| Quadrant A | 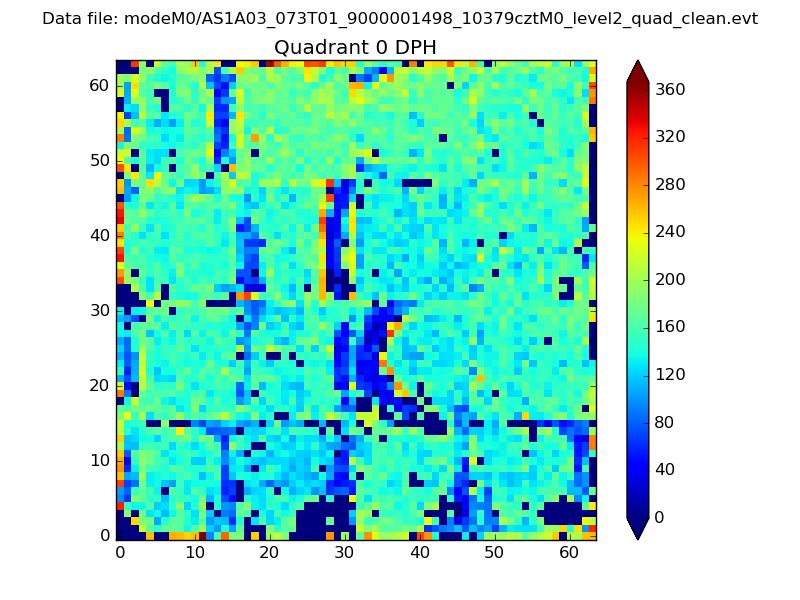 |
 |
Quadrant B |
|---|---|---|---|
| Quadrant D |  |
 |
Quadrant C |
| Plot type | Count rate plots | Images |
|---|---|---|
| Comparison with Poisson distribution Blue bars denote a histogram of data divided into 1 sec bins. Red curve is a Poisson curve with rate = median count rate of data. |
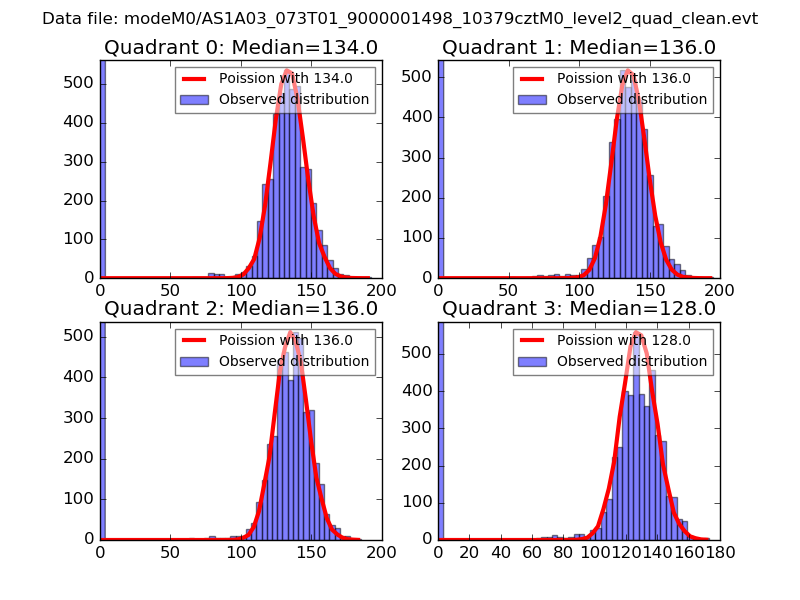 |
 |
| Quadrant-wise count rates Data is divided into 100 sec bins |
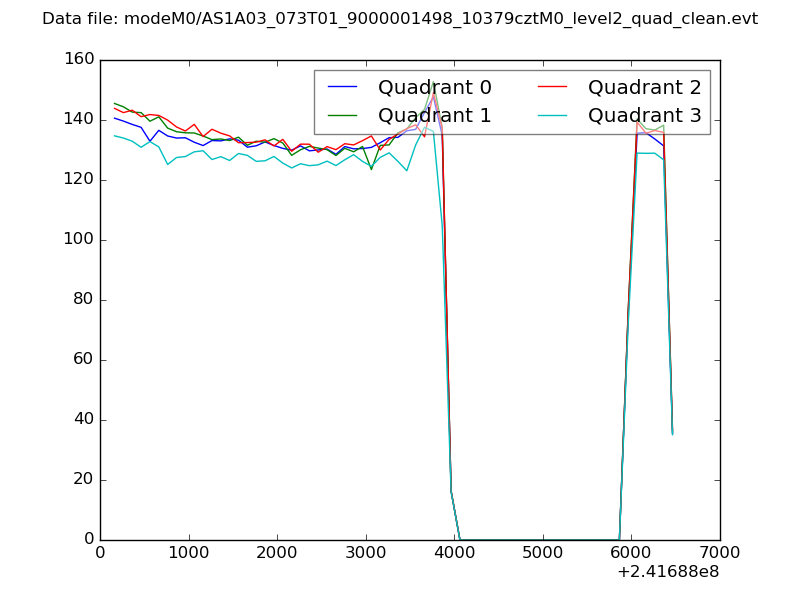 |
|
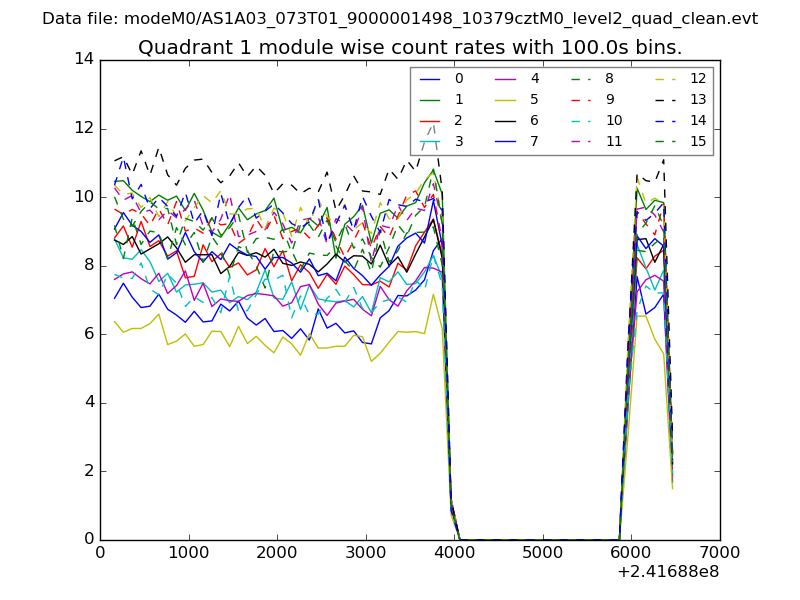
| Module-wise count rates for Quadrant A Data is divided into 100 sec bins |
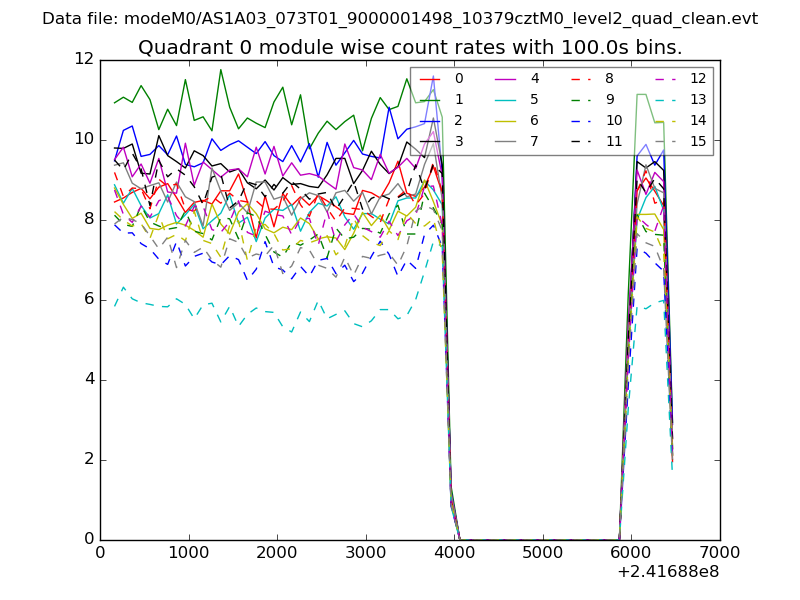 |
 |
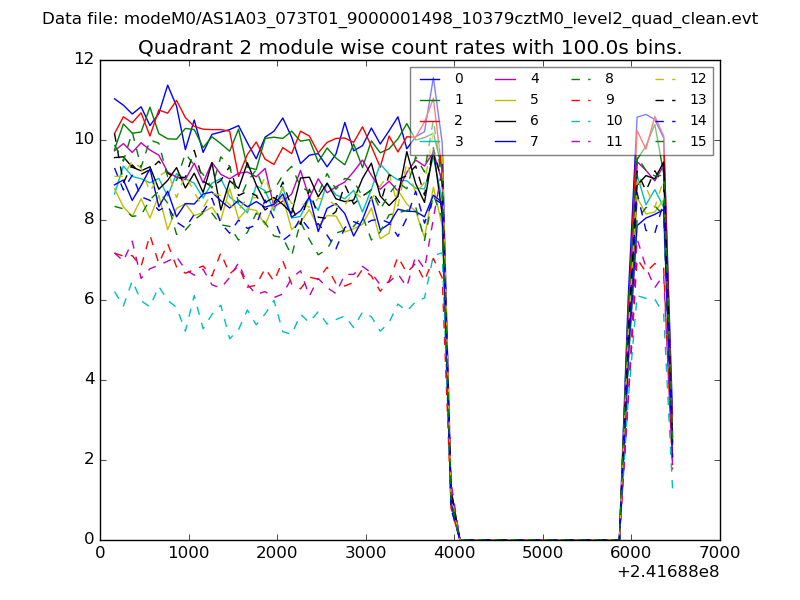
| Module-wise count rates for Quadrant B Data is divided into 100 sec bins |
 |
 |
| Module-wise count rates for Quadrant C Data is divided into 100 sec bins |
 |
 |
| Module-wise count rates for Quadrant D Data is divided into 100 sec bins |
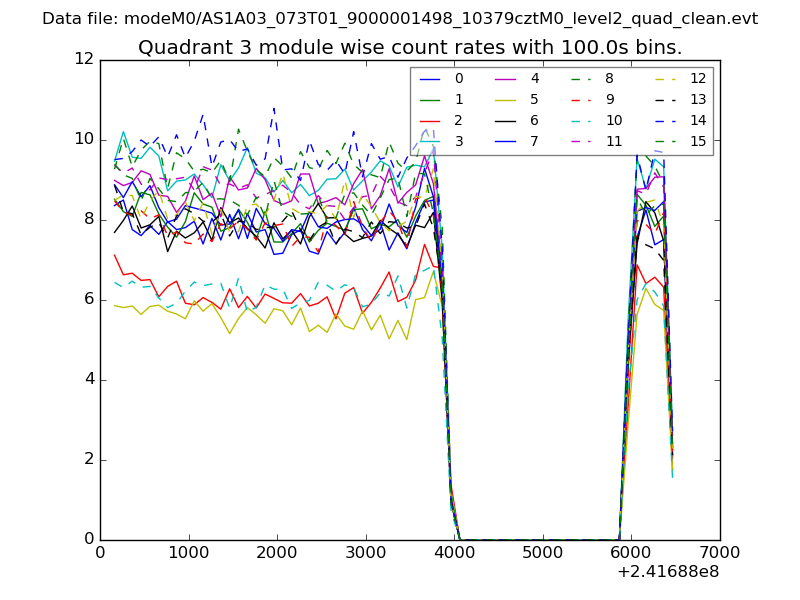 |
 |
| Parameter | Plot |
|---|---|
| CZT HV Monitor | 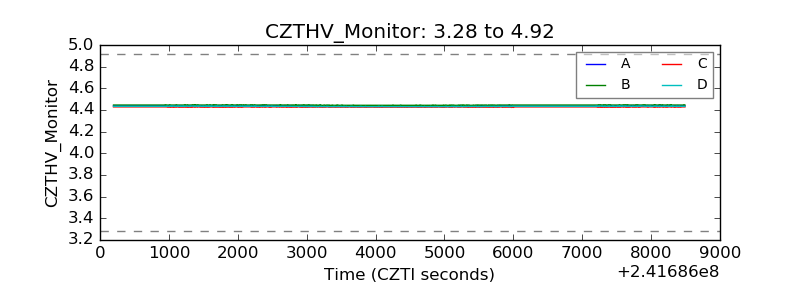 |
| D_VDD |  |
| Temperature 1 | 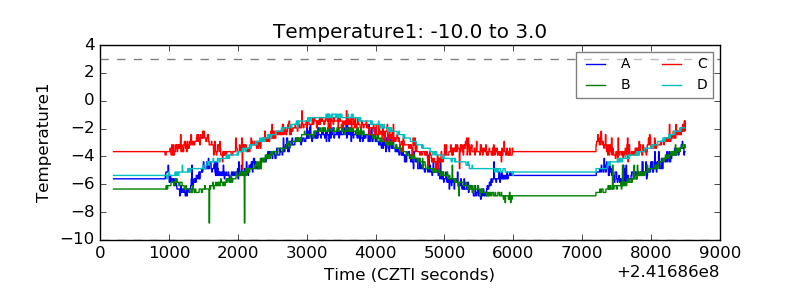 |
| Veto HV Monitor | 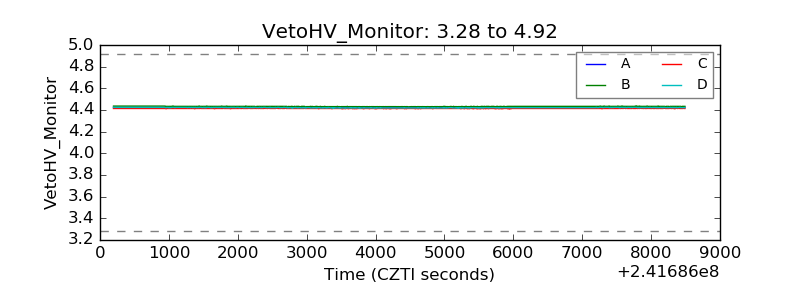 |
| Veto LLD | 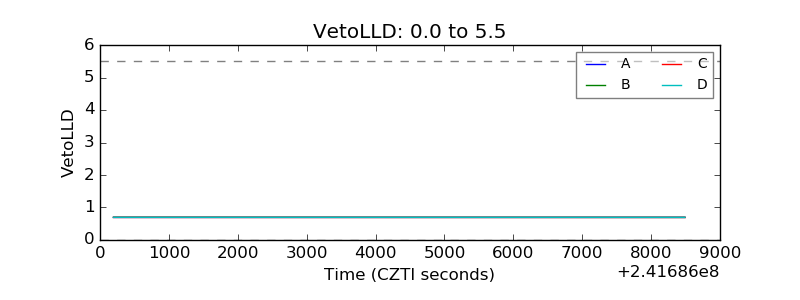 |
| Alpha Counter | 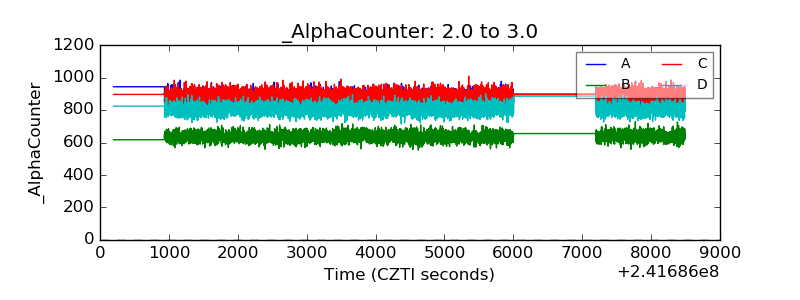 |
| _CPM_Rate | 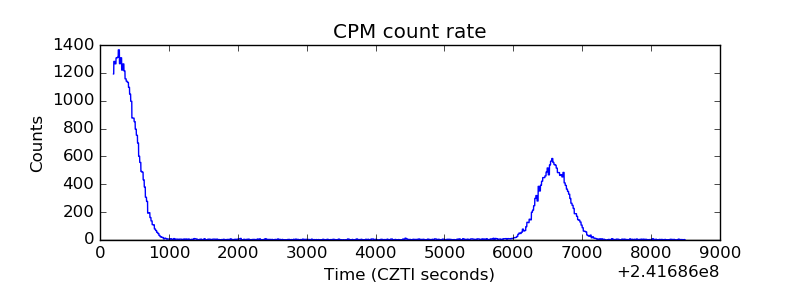 |
| CZT Counter | 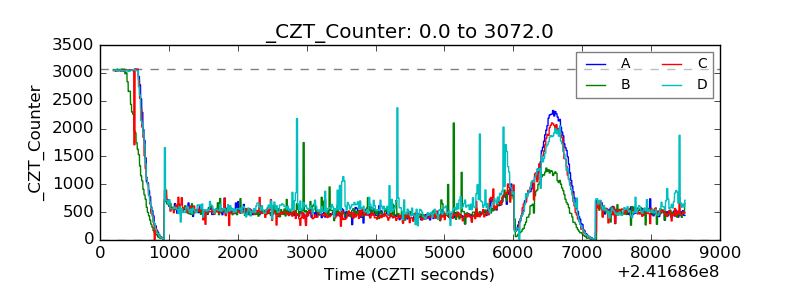 |
| +2.5 Volts monitor |  |
| +5 Volts monitor |  |
| _ROLL_ROT | 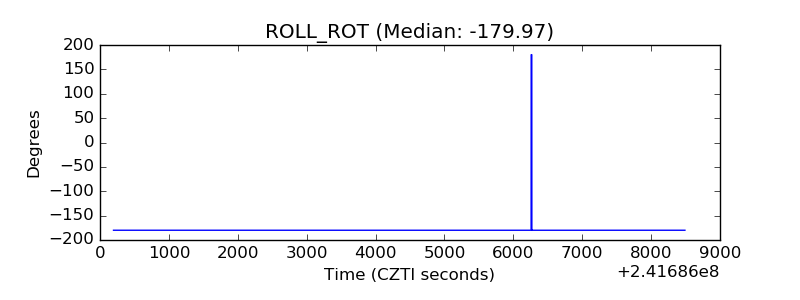 |
| _Roll_DEC | 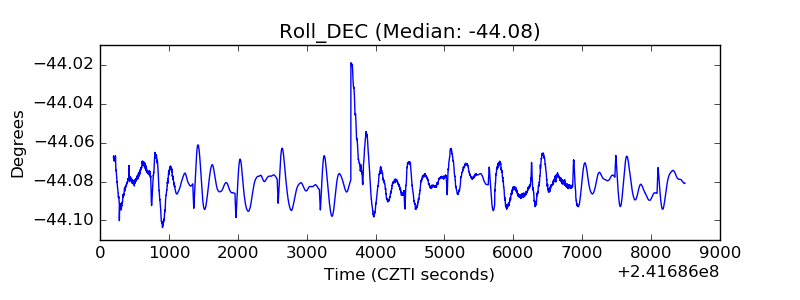 |
| _Roll_RA | 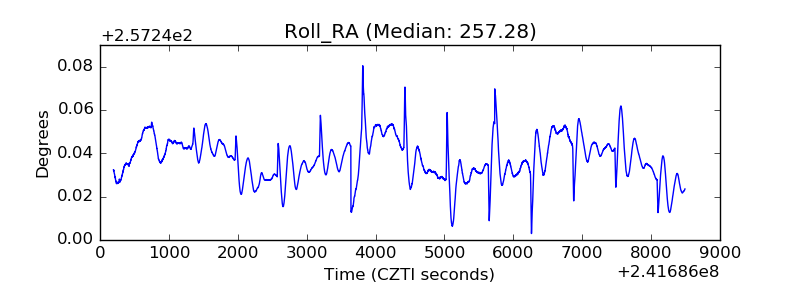 |
| Veto Counter | 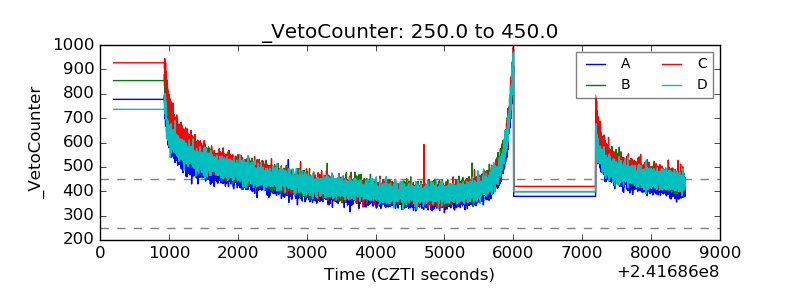 |