| Param | Original file | Final file |
|---|---|---|
| Filename | modeM0/AS1A03_073T01_9000001498_10380cztM0_level2.evt | modeM0/AS1A03_073T01_9000001498_10380cztM0_level2_quad_clean.evt |
| Size (bytes) | 479,234,880 | 94,576,320 |
| Size | 457.0 MB | 90.2 MB |
| Events in quadrant A | 3,140,163 | 605,488 |
| Events in quadrant B | 3,561,199 | 608,112 |
| Events in quadrant C | 3,155,116 | 611,408 |
| Events in quadrant D | 4,207,564 | 577,717 |
| Mode M9 | |||
|---|---|---|---|
| Quadrant | BADHDUFLAG | Total packets | Discarded packets |
| A | 0 | 20 | 0 |
| B | 0 | 20 | 0 |
| C | 0 | 20 | 0 |
| D | 0 | 21 | 0 |
| Mode SS | |||
|---|---|---|---|
| Quadrant | BADHDUFLAG | Total packets | Discarded packets |
| A | 0 | 132 | 0 |
| B | 0 | 132 | 0 |
| C | 0 | 132 | 0 |
| D | 0 | 132 | 0 |
| Mode M0 | |||
|---|---|---|---|
| Quadrant | BADHDUFLAG | Total packets | Discarded packets |
| A | 0 | 13602 | 1 |
| B | 0 | 14666 | 0 |
| C | 0 | 13759 | 0 |
| D | 0 | 16821 | 0 |
| Quadrant | Total seconds | Saturated seconds | Saturation percentage |
|---|---|---|---|
| A | 6627 | 104 | 1.569338% |
| B | 6627 | 143 | 2.157839% |
| C | 6627 | 79 | 1.192093% |
| D | 6627 | 122 | 1.840954% |
Noise dominated data is calculated using 1-second bins in cleaned event files. If a bin has >2000 counts, and if more than 50% of those come from <1% of pixels, then it is considered to be noise-dominated and hence unusable.
| Quadrant | # 1 sec bins | Bins with >0 counts | Bins with >2000 counts | High rate bins dominated by noise | Noise dominated (total time) | Noise dominated (detector-on time) | Marked lightcurve |
|---|---|---|---|---|---|---|---|
| A | 7562 | 6627 | 0 | 0 | 0.00% | 0.00% | 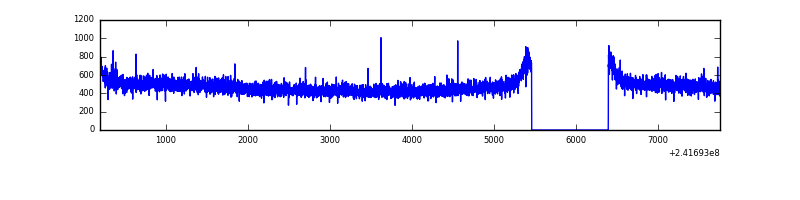 |
| B | 7562 | 6627 | 26 | 26 | 0.34% | 0.39% | 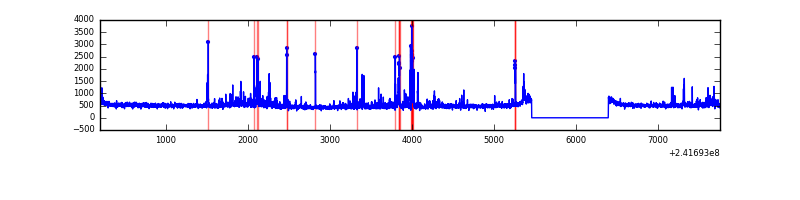 |
| C | 7562 | 6627 | 1 | 1 | 0.01% | 0.02% | 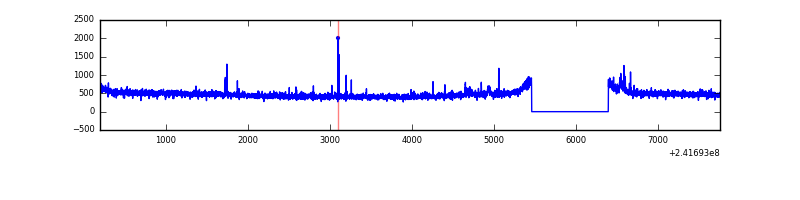 |
| D | 7562 | 6627 | 26 | 26 | 0.34% | 0.39% | 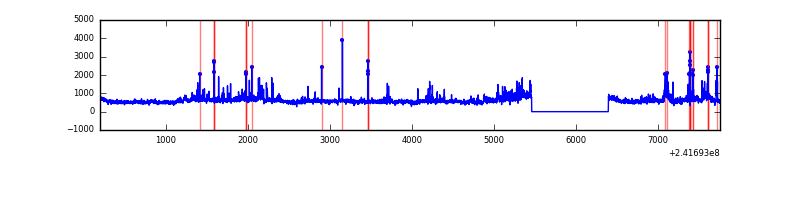 |
Top three noisy pixels from each quadrant. If the there are fewer than three noisy pixels in the level2.evt file, extra rows are filled as -1
| Pixel properties | Quadrant properties | ||||||
|---|---|---|---|---|---|---|---|
| Quadrant | DetID | PixID | Counts | Sigma | Mean | Median | Sigma |
| A | 0 | 226 | 7395 | 40.48 | 813 | 797 | 163.0 |
| A | 12 | 194 | 6911 | 37.51 | 813 | 797 | 163.0 |
| A | 13 | 251 | 4588 | 23.26 | 813 | 797 | 163.0 |
| B | 4 | 239 | 190061 | 1230.5 | 809 | 788 | 153.8 |
| B | 11 | 51 | 101839 | 656.95 | 809 | 788 | 153.8 |
| B | 0 | 214 | 79868 | 514.11 | 809 | 788 | 153.8 |
| C | 15 | 48 | 48182 | 260.82 | 792 | 795 | 181.7 |
| C | 14 | 234 | 17443 | 91.63 | 792 | 795 | 181.7 |
| C | 13 | 61 | 5952 | 28.38 | 792 | 795 | 181.7 |
| D | 8 | 195 | 598250 | 3198.88 | 786 | 765 | 186.8 |
| D | 1 | 20 | 266058 | 1420.36 | 786 | 765 | 186.8 |
| D | 2 | 33 | 183167 | 976.57 | 786 | 765 | 186.8 |
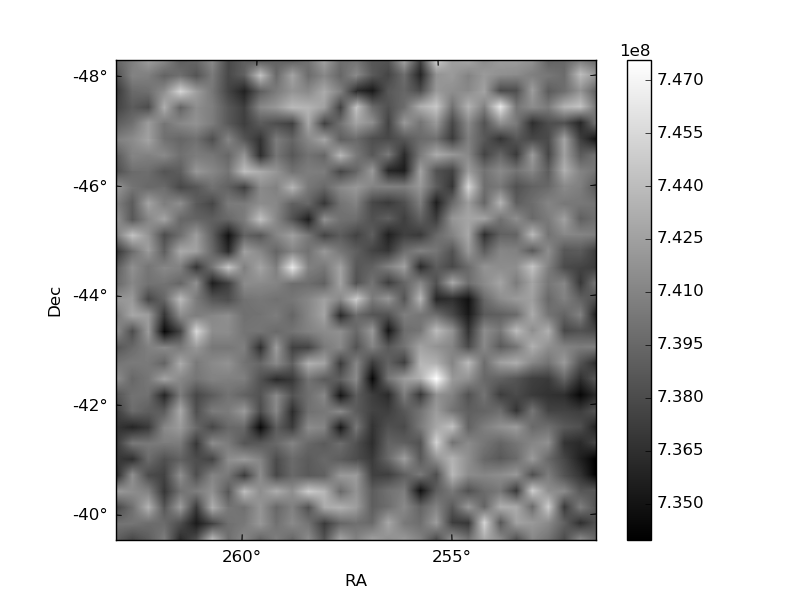
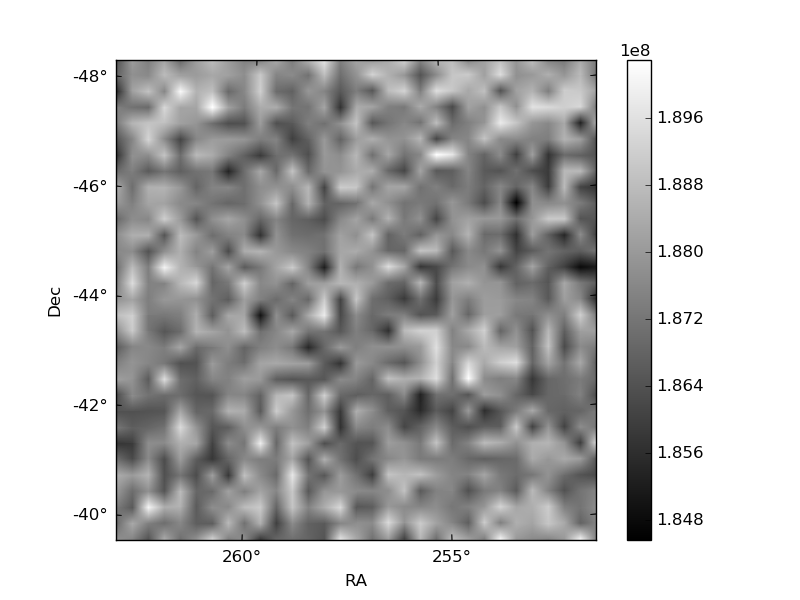
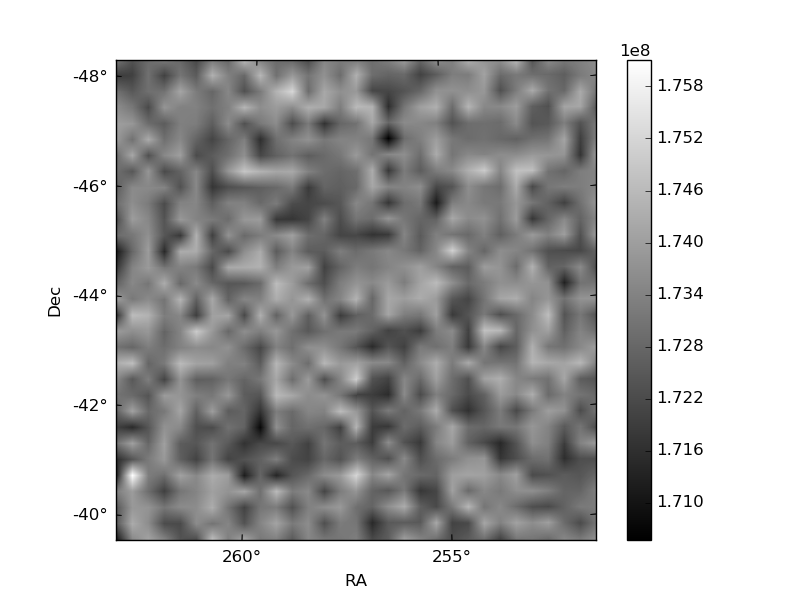
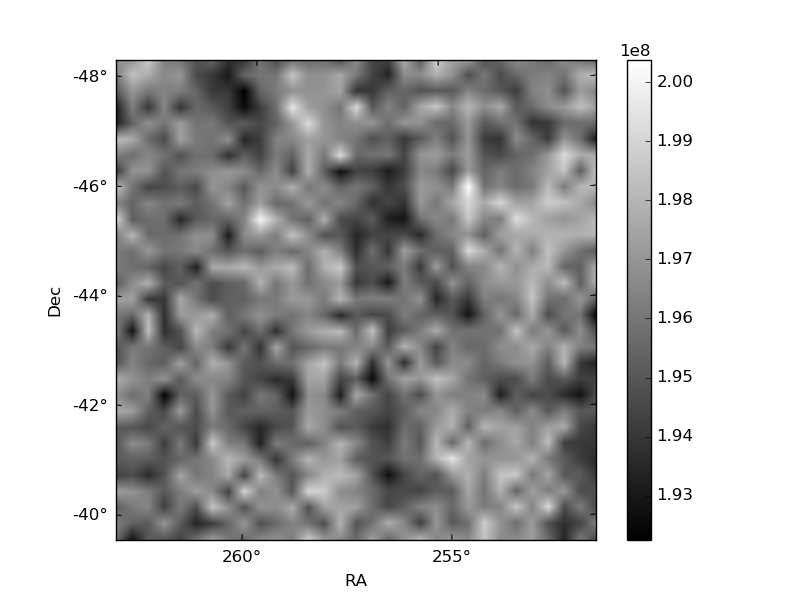
Histogram calculated using DETX and DETY for each event in the final _common_clean file
| Quadrant A | 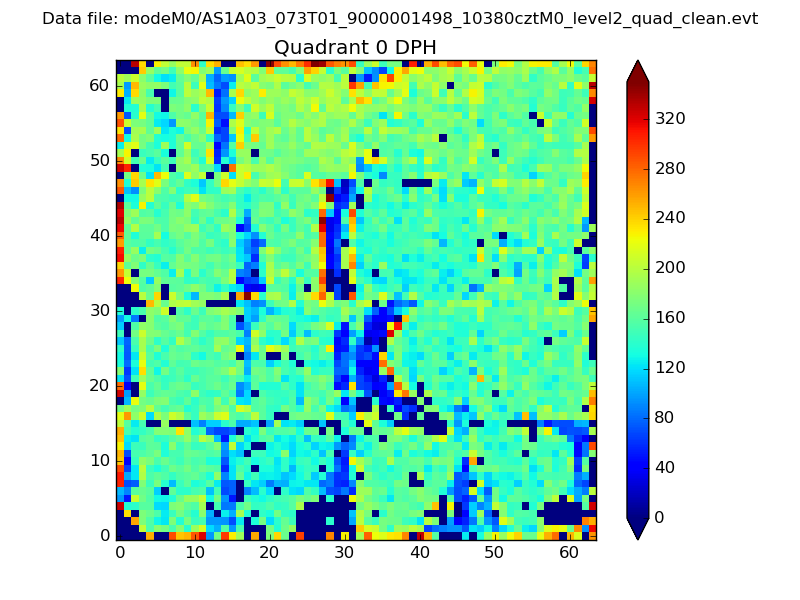 |
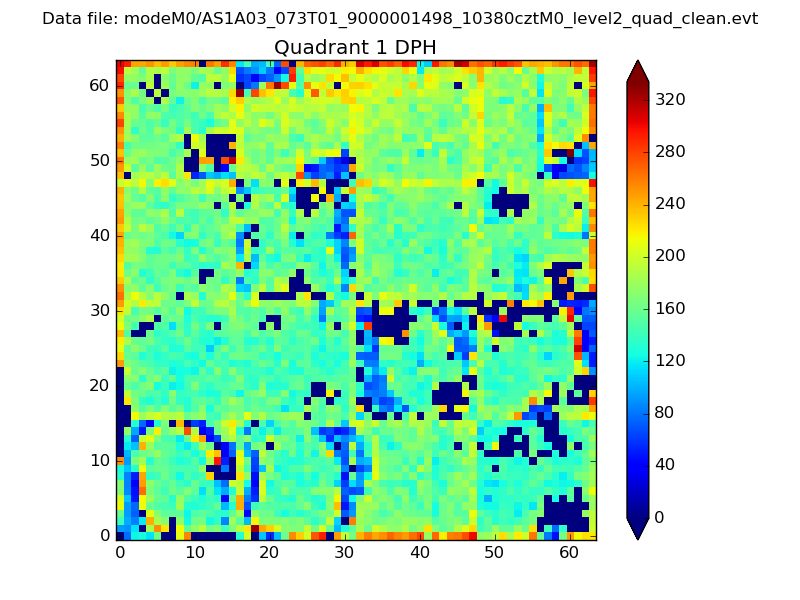 |
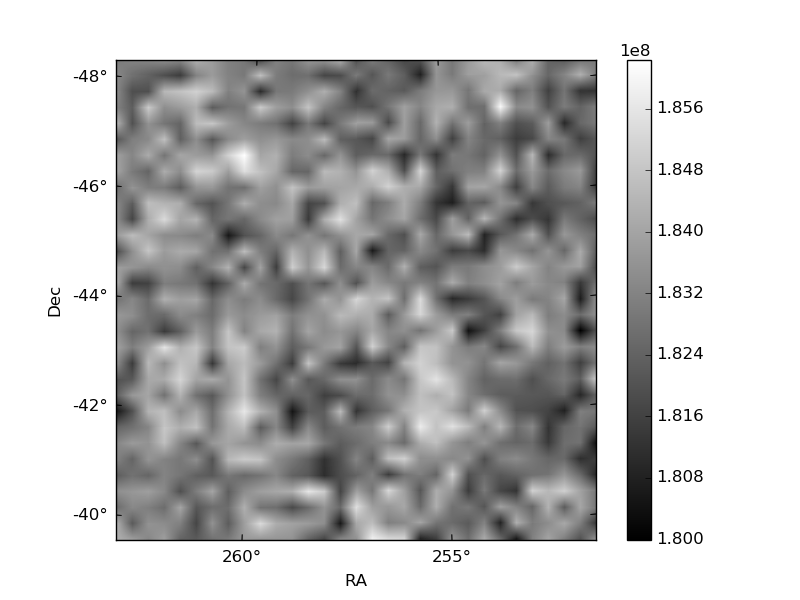
Quadrant B |
|---|---|---|---|
| Quadrant D | 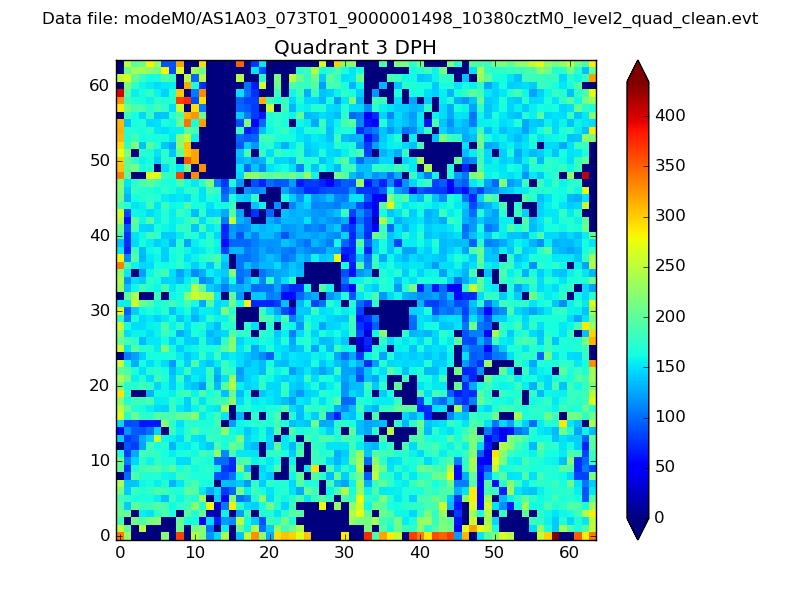 |
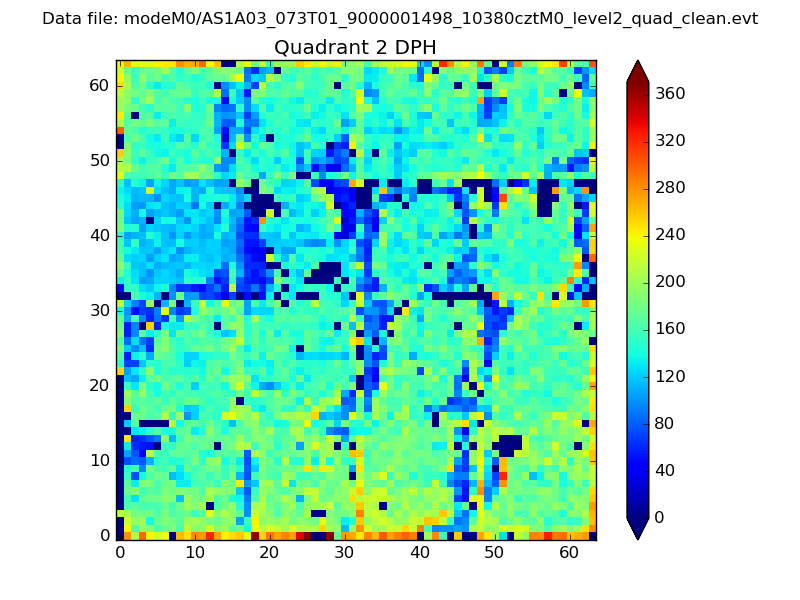 |
Quadrant C |
| Plot type | Count rate plots | Images |
|---|---|---|
| Comparison with Poisson distribution Blue bars denote a histogram of data divided into 1 sec bins. Red curve is a Poisson curve with rate = median count rate of data. |
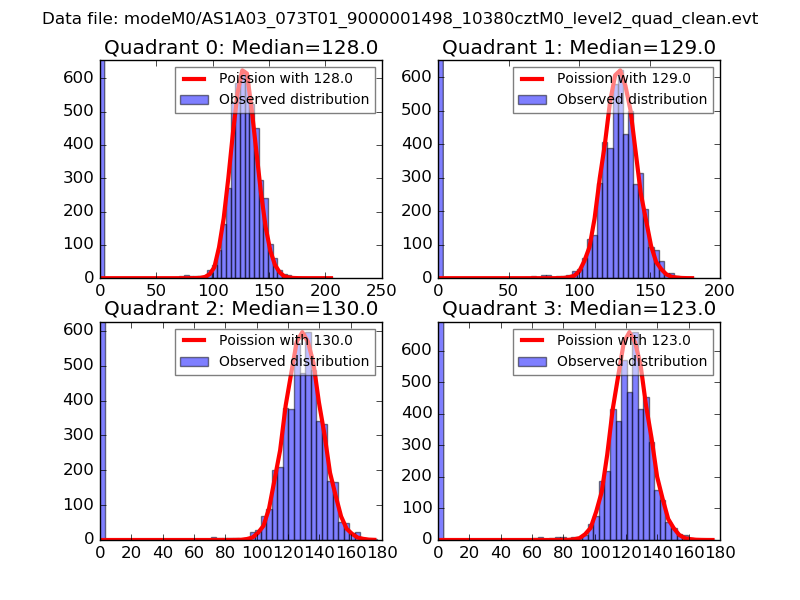 |
 |
| Quadrant-wise count rates Data is divided into 100 sec bins |
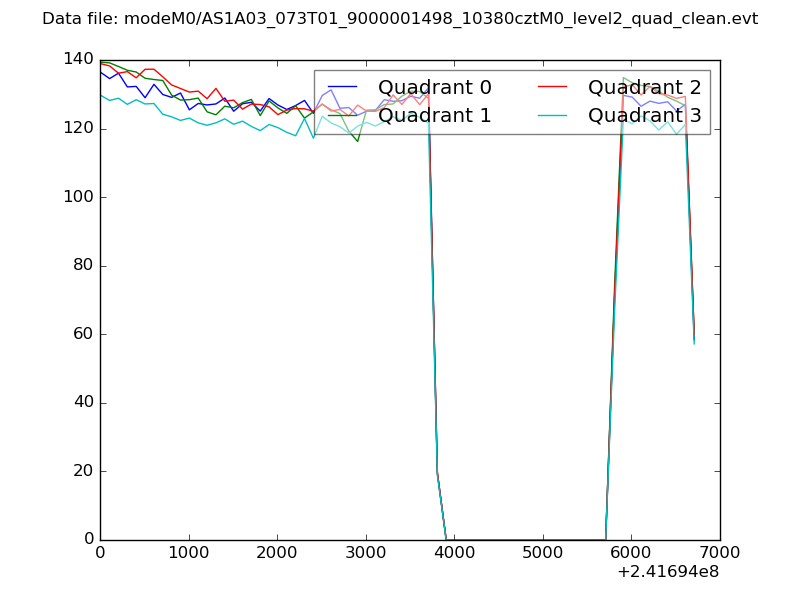 |
|
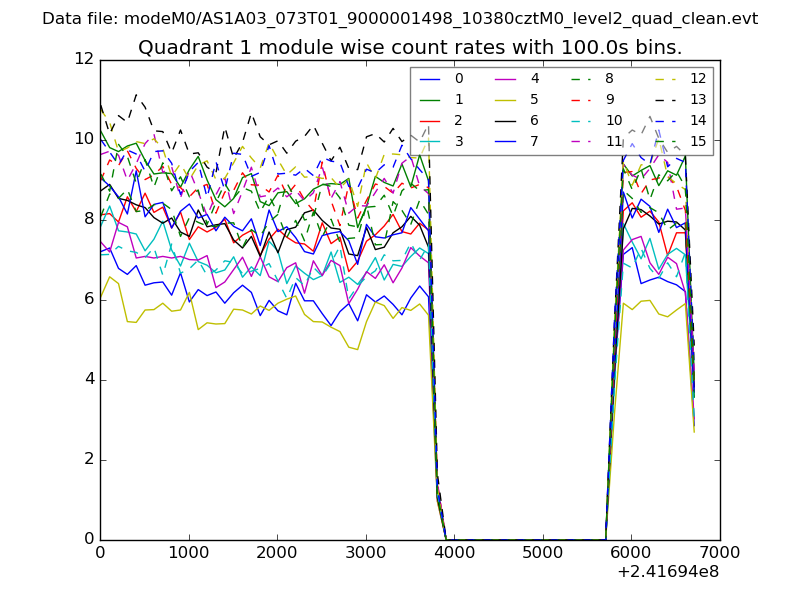
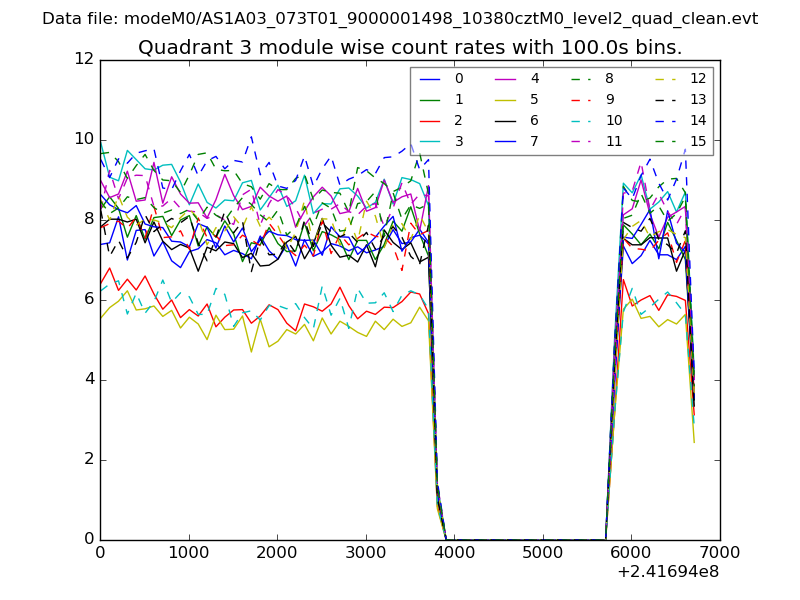
| Module-wise count rates for Quadrant A Data is divided into 100 sec bins |
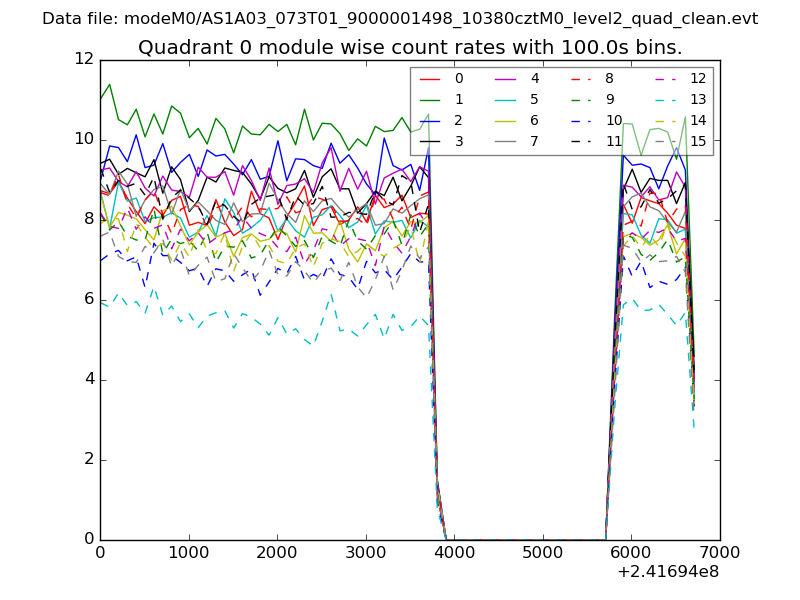 |
 |
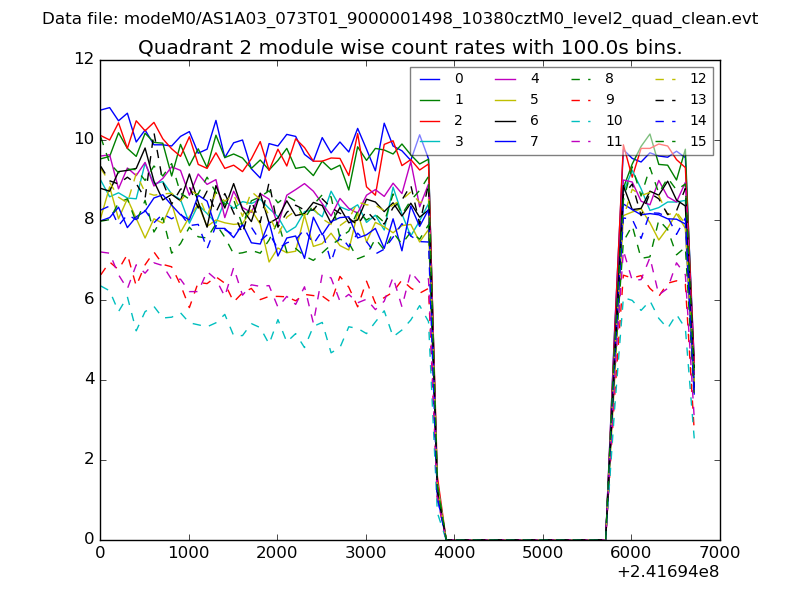
| Module-wise count rates for Quadrant B Data is divided into 100 sec bins |
 |
 |
| Module-wise count rates for Quadrant C Data is divided into 100 sec bins |
 |
 |
| Module-wise count rates for Quadrant D Data is divided into 100 sec bins |
 |
 |
| Parameter | Plot |
|---|---|
| CZT HV Monitor | 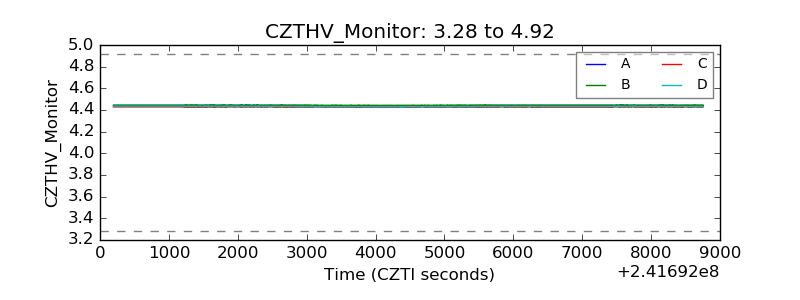 |
| D_VDD | 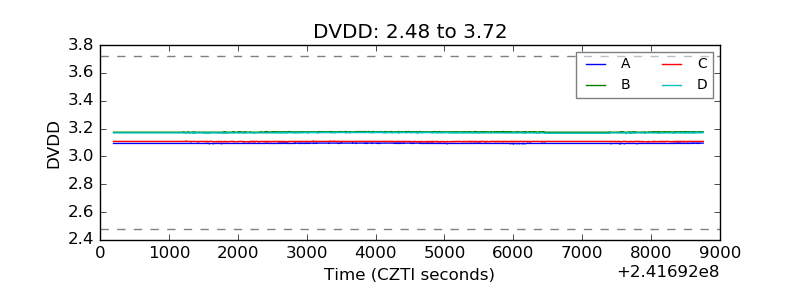 |
| Temperature 1 | 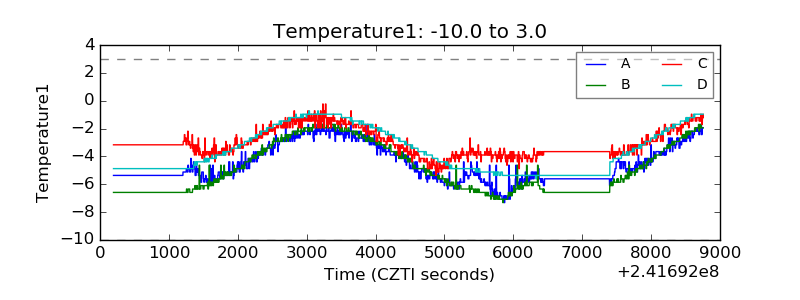 |
| Veto HV Monitor | 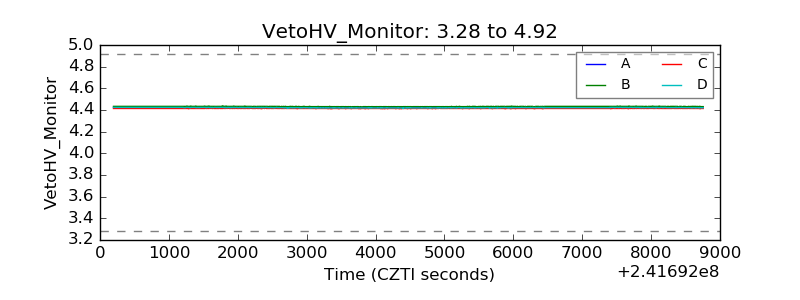 |
| Veto LLD | 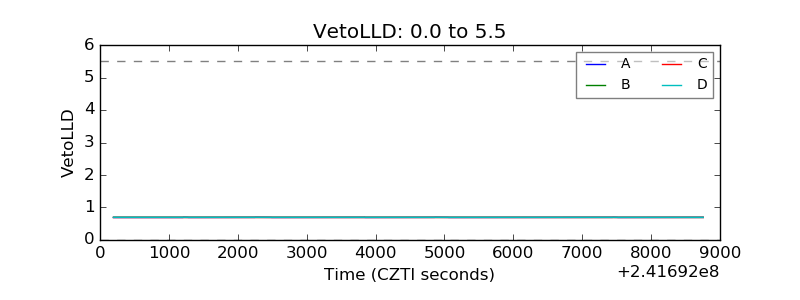 |
| Alpha Counter | 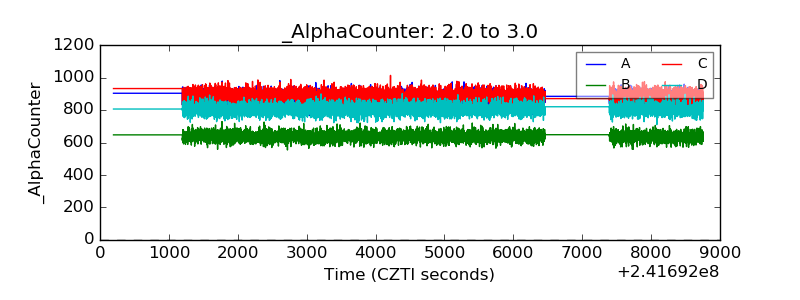 |
| _CPM_Rate | 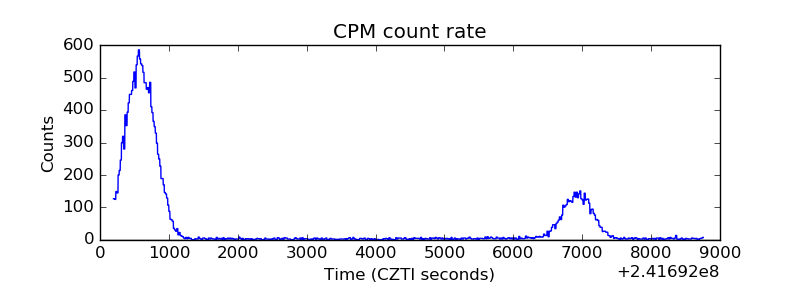 |
| CZT Counter | 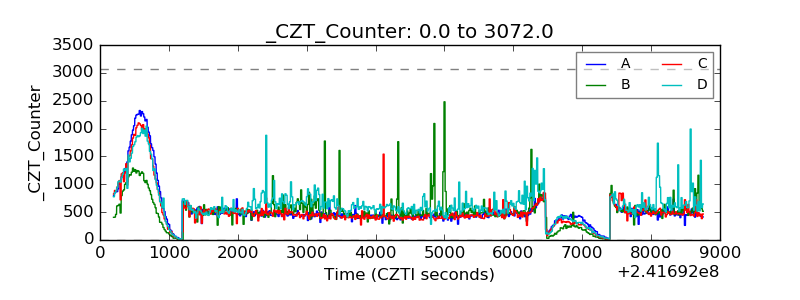 |
| +2.5 Volts monitor |  |
| +5 Volts monitor |  |
| _ROLL_ROT | 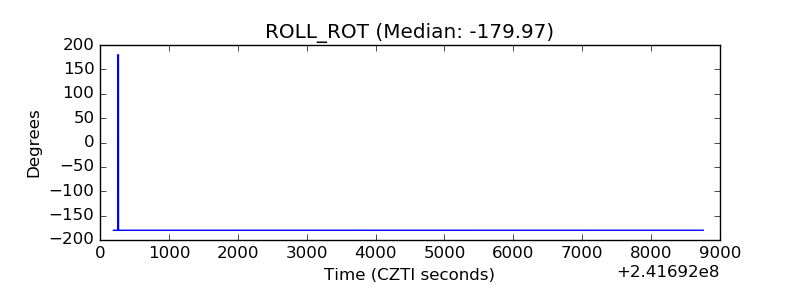 |
| _Roll_DEC | 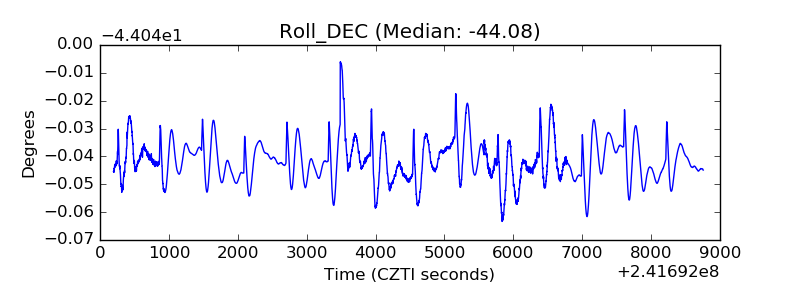 |
| _Roll_RA | 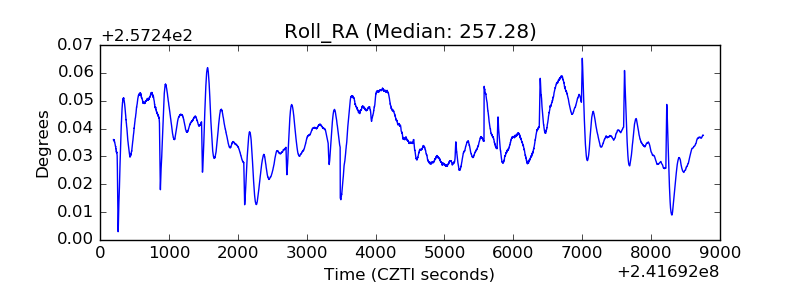 |
| Veto Counter | 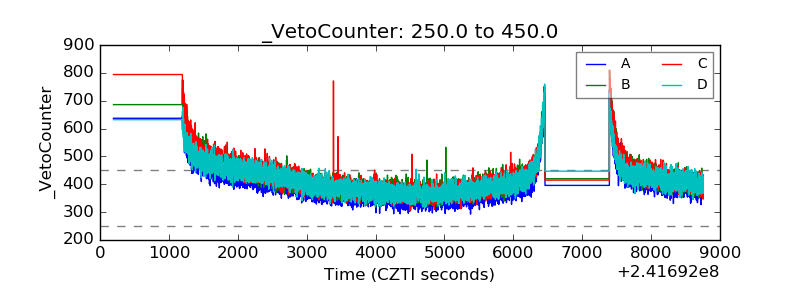 |