| Param | Original file | Final file |
|---|---|---|
| Filename | modeM0/AS1A03_073T01_9000001498_10381cztM0_level2.evt | modeM0/AS1A03_073T01_9000001498_10381cztM0_level2_quad_clean.evt |
| Size (bytes) | 476,205,120 | 97,580,160 |
| Size | 454.1 MB | 93.1 MB |
| Events in quadrant A | 3,041,142 | 629,024 |
| Events in quadrant B | 3,456,026 | 636,033 |
| Events in quadrant C | 2,952,605 | 637,985 |
| Events in quadrant D | 4,527,175 | 595,066 |
| Mode M9 | |||
|---|---|---|---|
| Quadrant | BADHDUFLAG | Total packets | Discarded packets |
| A | 0 | 6 | 0 |
| B | 0 | 6 | 0 |
| C | 0 | 6 | 0 |
| D | 0 | 6 | 0 |
| Mode SS | |||
|---|---|---|---|
| Quadrant | BADHDUFLAG | Total packets | Discarded packets |
| A | 0 | 132 | 0 |
| B | 0 | 132 | 0 |
| C | 0 | 132 | 0 |
| D | 0 | 132 | 0 |
| Mode M0 | |||
|---|---|---|---|
| Quadrant | BADHDUFLAG | Total packets | Discarded packets |
| A | 0 | 13500 | 2 |
| B | 0 | 14464 | 1 |
| C | 0 | 13394 | 1 |
| D | 0 | 17911 | 1 |
| Quadrant | Total seconds | Saturated seconds | Saturation percentage |
|---|---|---|---|
| A | 6557 | 85 | 1.296325% |
| B | 6557 | 97 | 1.479335% |
| C | 6557 | 40 | 0.610035% |
| D | 6557 | 226 | 3.446698% |
Noise dominated data is calculated using 1-second bins in cleaned event files. If a bin has >2000 counts, and if more than 50% of those come from <1% of pixels, then it is considered to be noise-dominated and hence unusable.
| Quadrant | # 1 sec bins | Bins with >0 counts | Bins with >2000 counts | High rate bins dominated by noise | Noise dominated (total time) | Noise dominated (detector-on time) | Marked lightcurve |
|---|---|---|---|---|---|---|---|
| A | 7137 | 6557 | 0 | 0 | 0.00% | 0.00% |  |
| B | 7137 | 6557 | 20 | 20 | 0.28% | 0.31% | 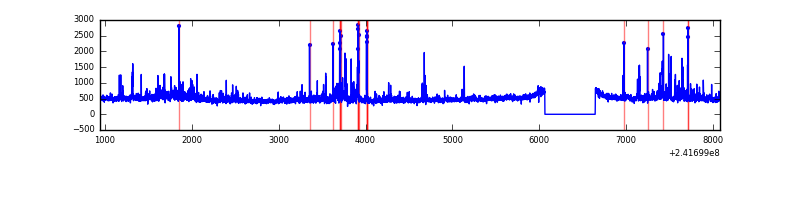 |
| C | 7137 | 6558 | 0 | 0 | 0.00% | 0.00% |  |
| D | 7137 | 6558 | 116 | 116 | 1.63% | 1.77% |  |
Top three noisy pixels from each quadrant. If the there are fewer than three noisy pixels in the level2.evt file, extra rows are filled as -1
| Pixel properties | Quadrant properties | ||||||
|---|---|---|---|---|---|---|---|
| Quadrant | DetID | PixID | Counts | Sigma | Mean | Median | Sigma |
| A | 8 | 15 | 34217 | 213.02 | 777 | 761 | 157.1 |
| A | 5 | 16 | 8316 | 48.1 | 777 | 761 | 157.1 |
| A | 0 | 226 | 7177 | 40.85 | 777 | 761 | 157.1 |
| B | 4 | 239 | 226206 | 1514.99 | 775 | 755 | 148.8 |
| B | 11 | 51 | 117929 | 787.39 | 775 | 755 | 148.8 |
| B | 0 | 214 | 58214 | 386.11 | 775 | 755 | 148.8 |
| C | 14 | 234 | 8063 | 41.95 | 754 | 756 | 174.2 |
| C | 13 | 61 | 5627 | 27.96 | 754 | 756 | 174.2 |
| C | 9 | 54 | 2699 | 11.15 | 754 | 756 | 174.2 |
| D | 8 | 195 | 632508 | 3522.44 | 745 | 723 | 179.4 |
| D | 1 | 20 | 419862 | 2336.86 | 745 | 723 | 179.4 |
| D | 2 | 33 | 236081 | 1312.21 | 745 | 723 | 179.4 |
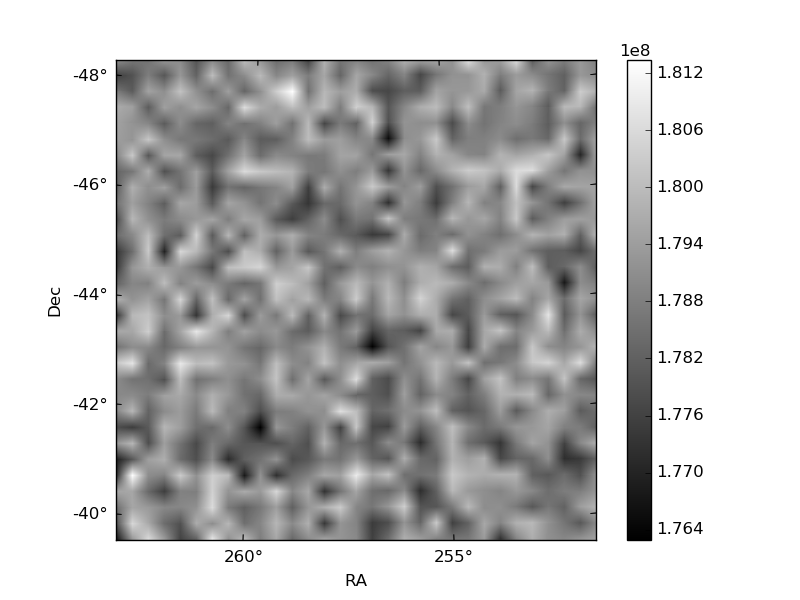
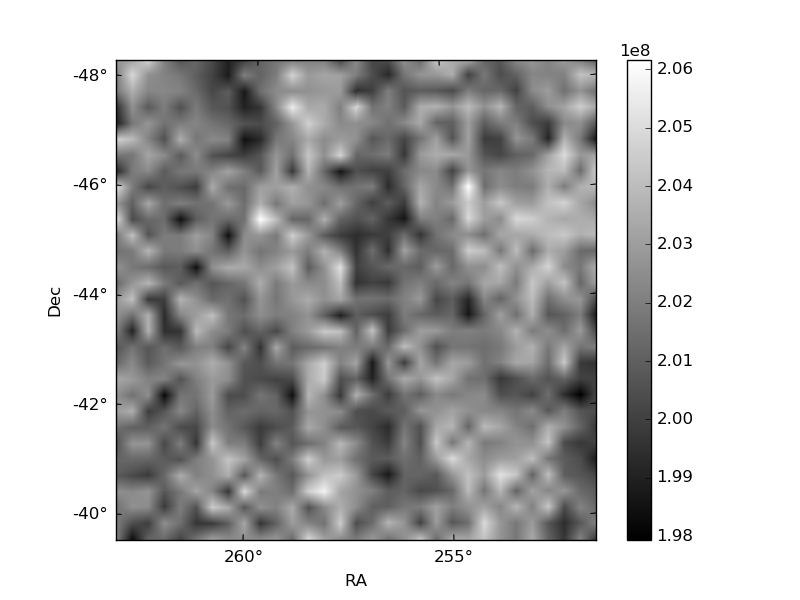
Histogram calculated using DETX and DETY for each event in the final _common_clean file
| Quadrant A | 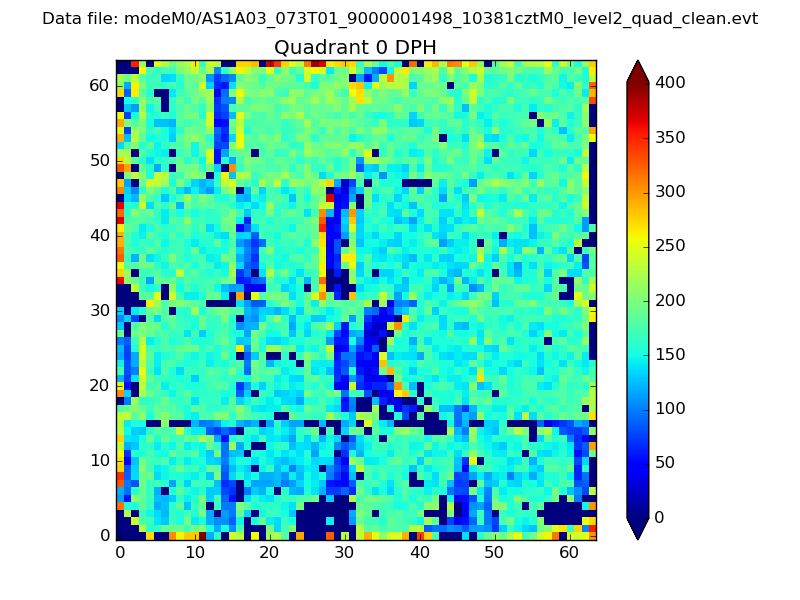 |
 |
Quadrant B |
|---|---|---|---|
| Quadrant D | 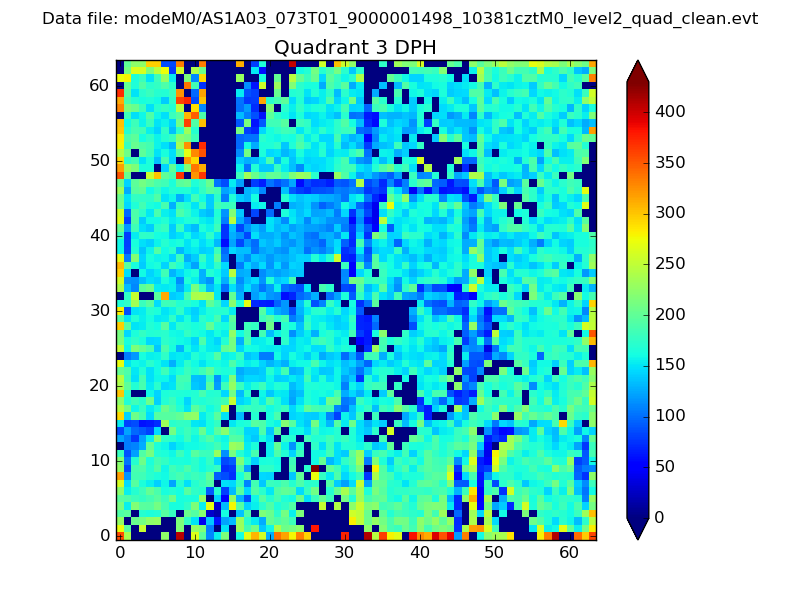 |
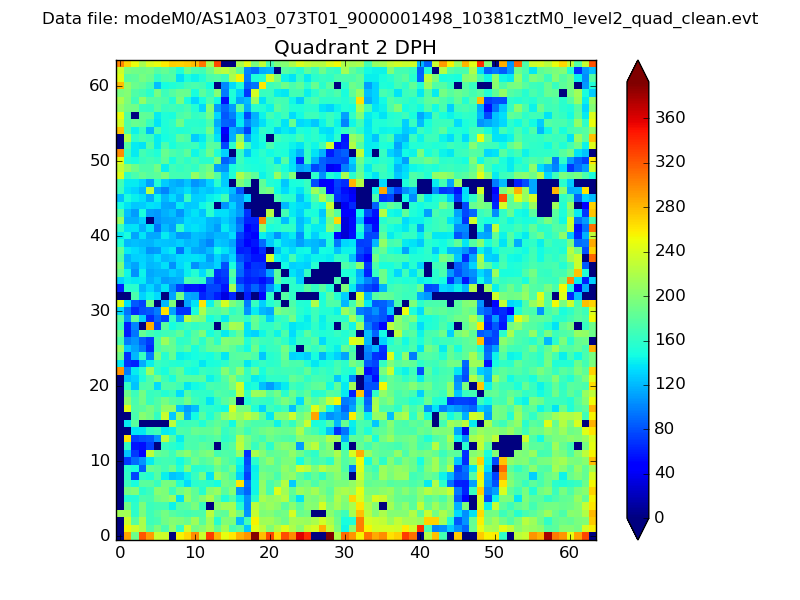 |
Quadrant C |
| Plot type | Count rate plots | Images |
|---|---|---|
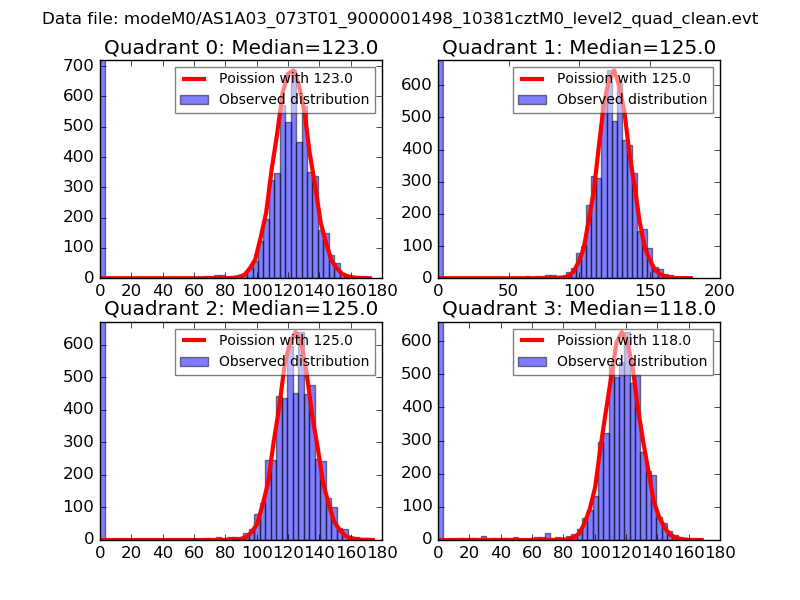
| Comparison with Poisson distribution Blue bars denote a histogram of data divided into 1 sec bins. Red curve is a Poisson curve with rate = median count rate of data. |
 |
 |
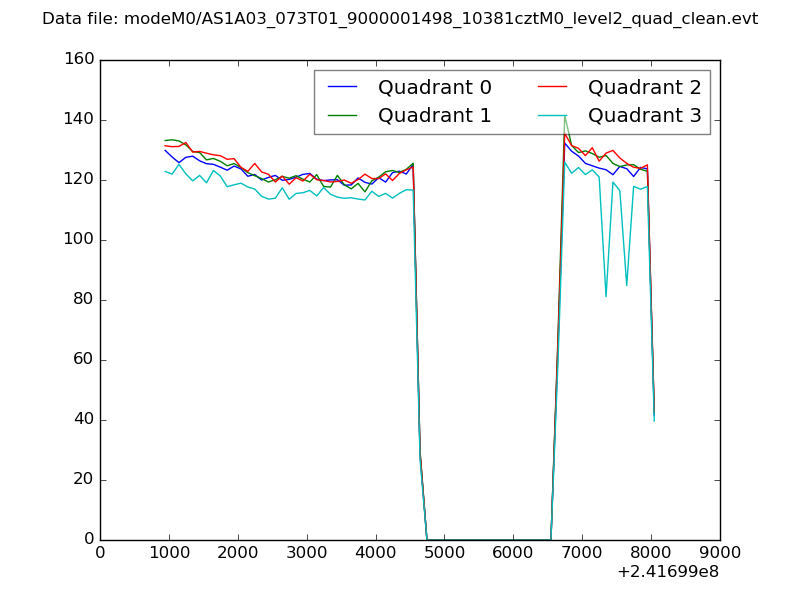
| Quadrant-wise count rates Data is divided into 100 sec bins |
 |
|
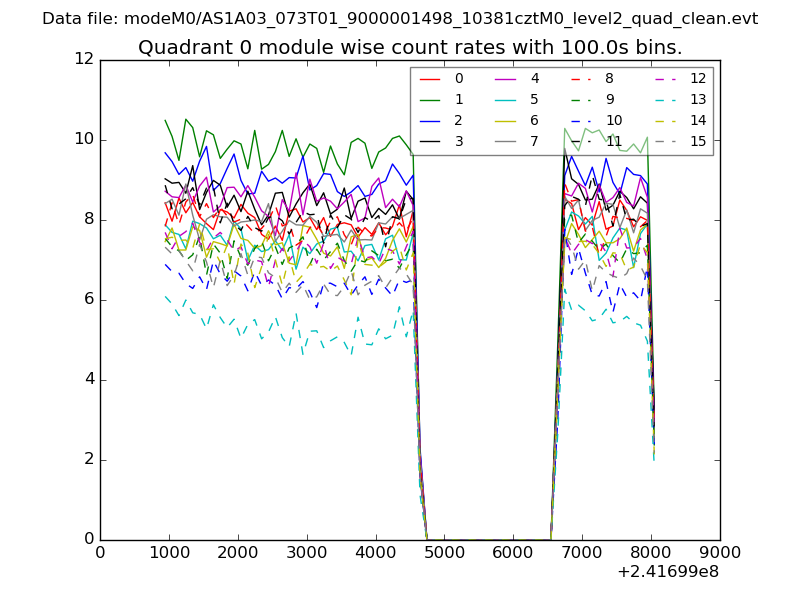
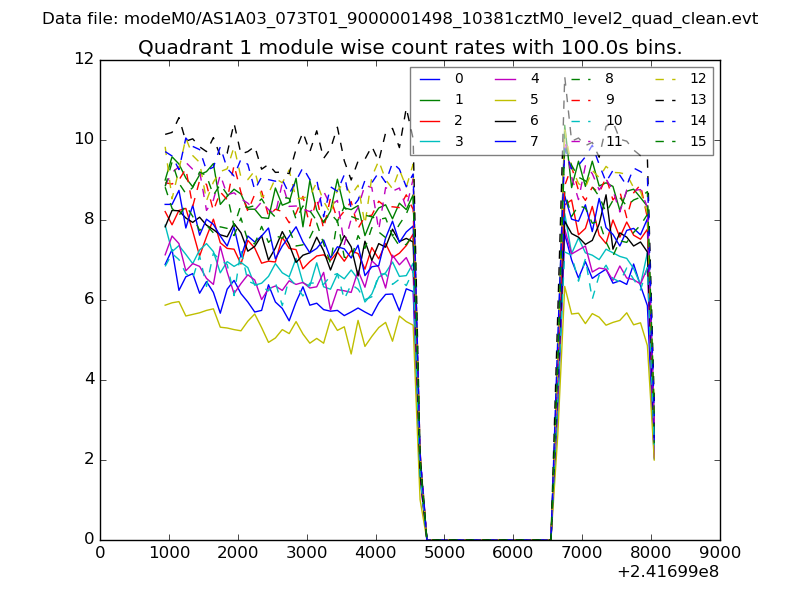
| Module-wise count rates for Quadrant A Data is divided into 100 sec bins |
 |
 |
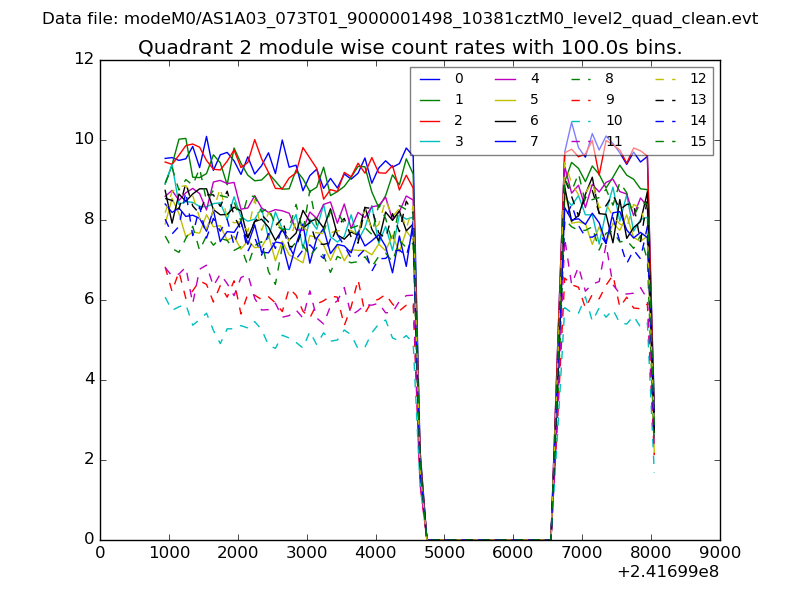
| Module-wise count rates for Quadrant B Data is divided into 100 sec bins |
 |
 |
| Module-wise count rates for Quadrant C Data is divided into 100 sec bins |
 |
 |
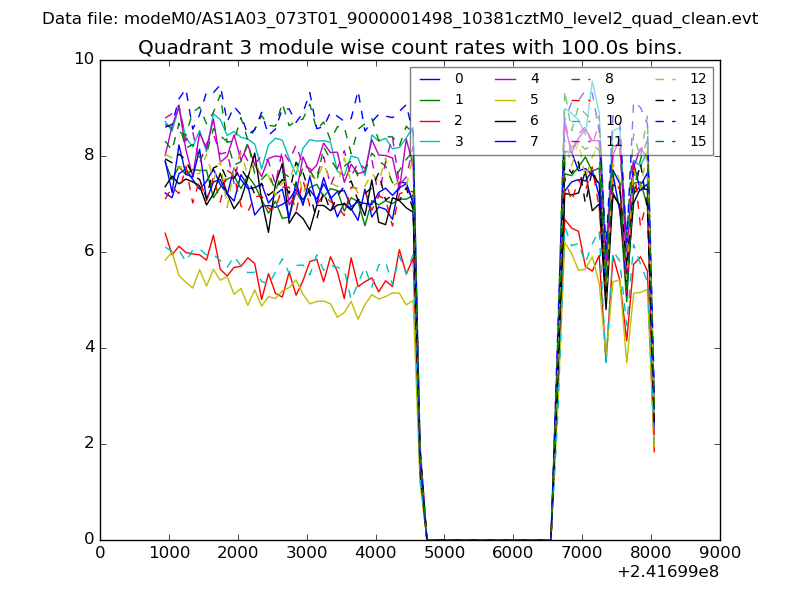
| Module-wise count rates for Quadrant D Data is divided into 100 sec bins |
 |
 |
| Parameter | Plot |
|---|---|
| CZT HV Monitor | 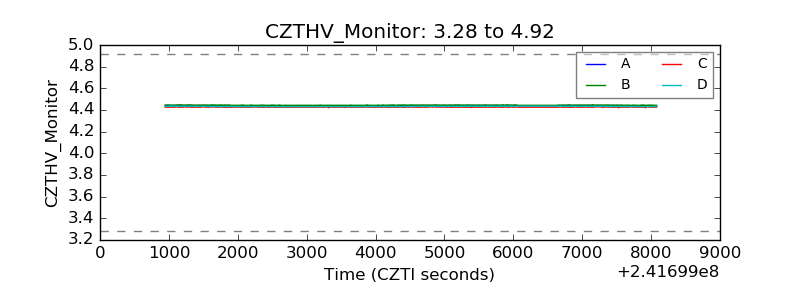 |
| D_VDD | 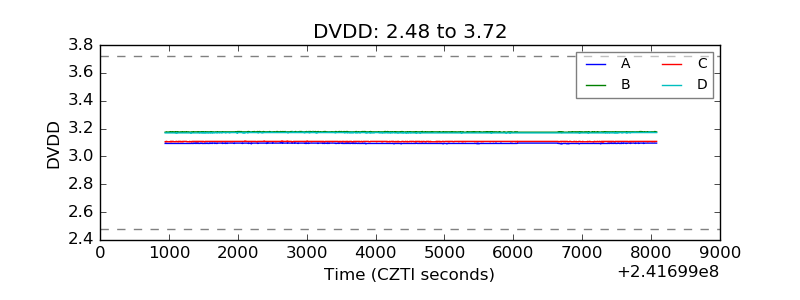 |
| Temperature 1 | 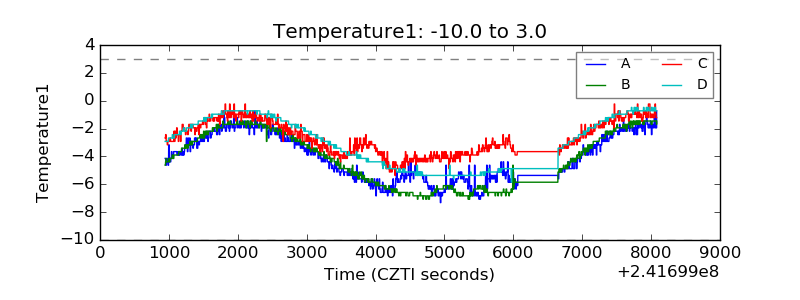 |
| Veto HV Monitor | 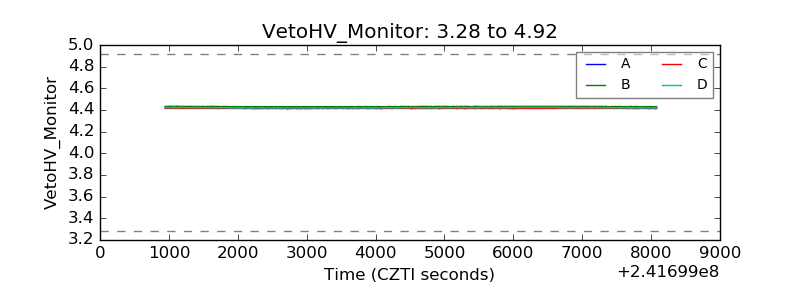 |
| Veto LLD | 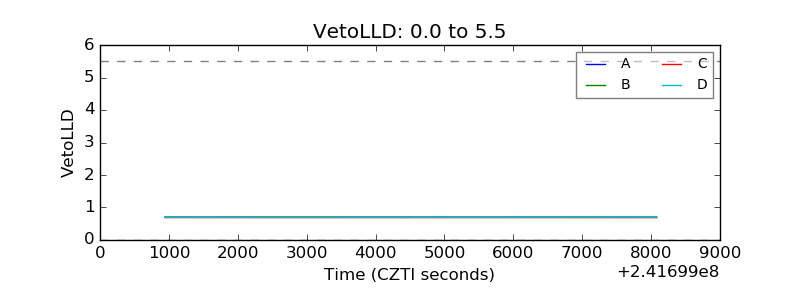 |
| Alpha Counter | 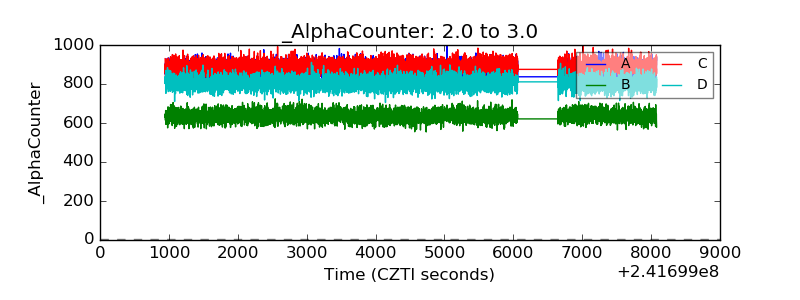 |
| _CPM_Rate | 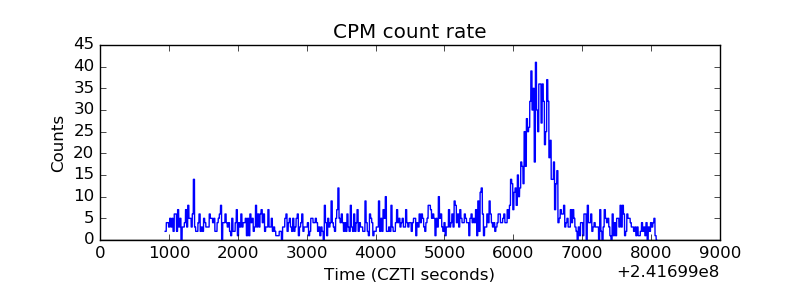 |
| CZT Counter |  |
| +2.5 Volts monitor |  |
| +5 Volts monitor |  |
| _ROLL_ROT | 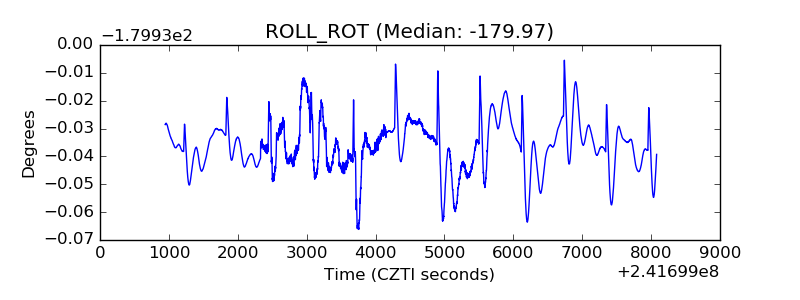 |
| _Roll_DEC | 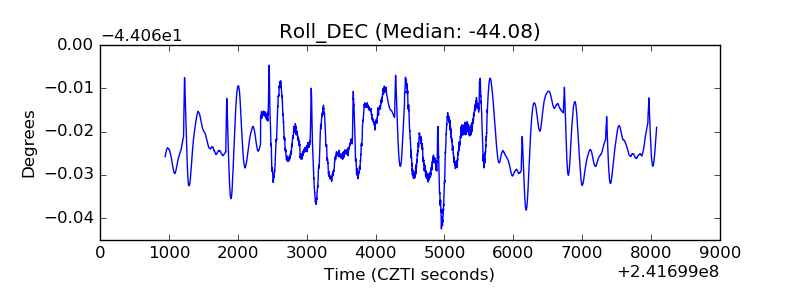 |
| _Roll_RA | 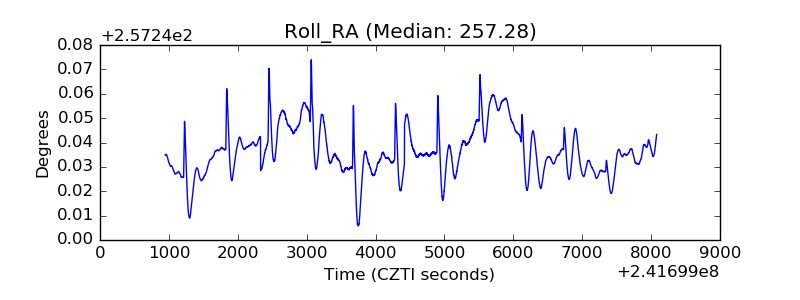 |
| Veto Counter | 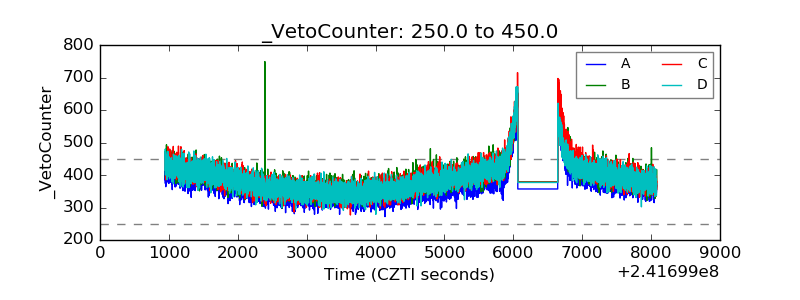 |