| Param | Original file | Final file |
|---|---|---|
| Filename | modeM0/AS1A03_073T01_9000001498_10383cztM0_level2.evt | modeM0/AS1A03_073T01_9000001498_10383cztM0_level2_quad_clean.evt |
| Size (bytes) | 395,383,680 | 75,732,480 |
| Size | 377.1 MB | 72.2 MB |
| Events in quadrant A | 2,662,776 | 478,677 |
| Events in quadrant B | 2,771,241 | 448,322 |
| Events in quadrant C | 2,517,907 | 489,455 |
| Events in quadrant D | 3,636,365 | 481,068 |
| Mode M9 | |||
|---|---|---|---|
| Quadrant | BADHDUFLAG | Total packets | Discarded packets |
| A | 0 | 6 | 3 |
| B | 0 | 6 | 3 |
| C | 0 | 6 | 3 |
| D | 0 | 6 | 3 |
| Mode SS | |||
|---|---|---|---|
| Quadrant | BADHDUFLAG | Total packets | Discarded packets |
| A | 0 | 244 | 115 |
| B | 0 | 244 | 120 |
| C | 0 | 244 | 118 |
| D | 0 | 236 | 110 |
| Mode M0 | |||
|---|---|---|---|
| Quadrant | BADHDUFLAG | Total packets | Discarded packets |
| A | 0 | 24613 | 12789 |
| B | 0 | 28038 | 16226 |
| C | 0 | 25123 | 13417 |
| D | 0 | 32654 | 18140 |
| Quadrant | Total seconds | Saturated seconds | Saturation percentage |
|---|---|---|---|
| A | 5694 | 49 | 0.860555% |
| B | 5423 | 73 | 1.346118% |
| C | 5746 | 16 | 0.278455% |
| D | 5691 | 34 | 0.597435% |
Noise dominated data is calculated using 1-second bins in cleaned event files. If a bin has >2000 counts, and if more than 50% of those come from <1% of pixels, then it is considered to be noise-dominated and hence unusable.
| Quadrant | # 1 sec bins | Bins with >0 counts | Bins with >2000 counts | High rate bins dominated by noise | Noise dominated (total time) | Noise dominated (detector-on time) | Marked lightcurve |
|---|---|---|---|---|---|---|---|
| A | 6974 | 6480 | 1 | 1 | 0.01% | 0.02% | 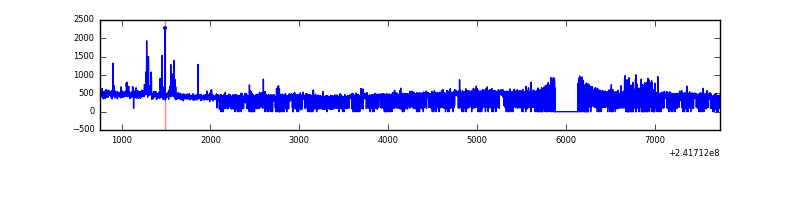 |
| B | 6974 | 6248 | 18 | 18 | 0.26% | 0.29% | 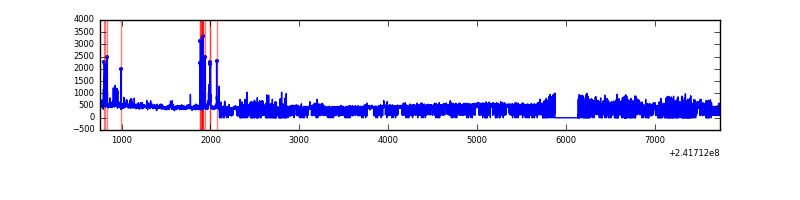 |
| C | 6974 | 6490 | 0 | 0 | 0.00% | 0.00% | 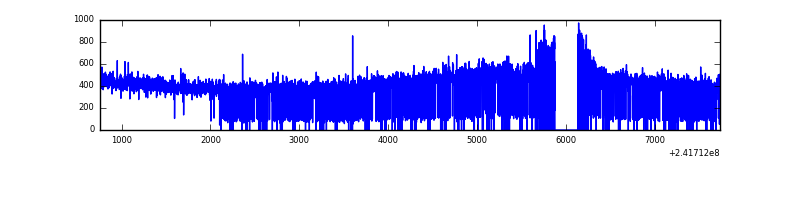 |
| D | 6974 | 6199 | 20 | 20 | 0.29% | 0.32% | 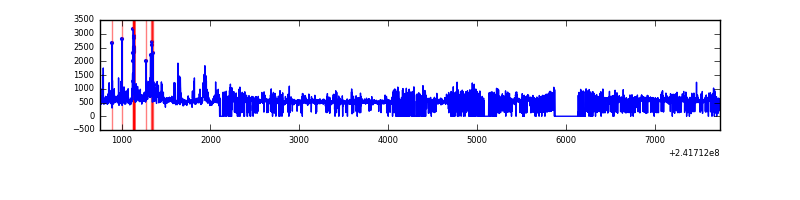 |
Top three noisy pixels from each quadrant. If the there are fewer than three noisy pixels in the level2.evt file, extra rows are filled as -1
| Pixel properties | Quadrant properties | ||||||
|---|---|---|---|---|---|---|---|
| Quadrant | DetID | PixID | Counts | Sigma | Mean | Median | Sigma |
| A | 4 | 2 | 47151 | 341.41 | 663 | 650 | 136.2 |
| A | 5 | 16 | 44389 | 321.13 | 663 | 650 | 136.2 |
| A | 13 | 251 | 13075 | 91.22 | 663 | 650 | 136.2 |
| B | 4 | 239 | 154055 | 1252.31 | 631 | 614 | 122.5 |
| B | 11 | 51 | 76637 | 620.46 | 631 | 614 | 122.5 |
| B | 6 | 51 | 46314 | 372.98 | 631 | 614 | 122.5 |
| C | 14 | 234 | 12068 | 76.1 | 642 | 644 | 150.1 |
| C | 13 | 61 | 4797 | 27.67 | 642 | 644 | 150.1 |
| C | 14 | 67 | 2137 | 9.95 | 642 | 644 | 150.1 |
| D | 8 | 195 | 674491 | 4413.93 | 627 | 609 | 152.7 |
| D | 1 | 20 | 306919 | 2006.33 | 627 | 609 | 152.7 |
| D | 2 | 33 | 103985 | 677.11 | 627 | 609 | 152.7 |
Histogram calculated using DETX and DETY for each event in the final _common_clean file
| Quadrant A | 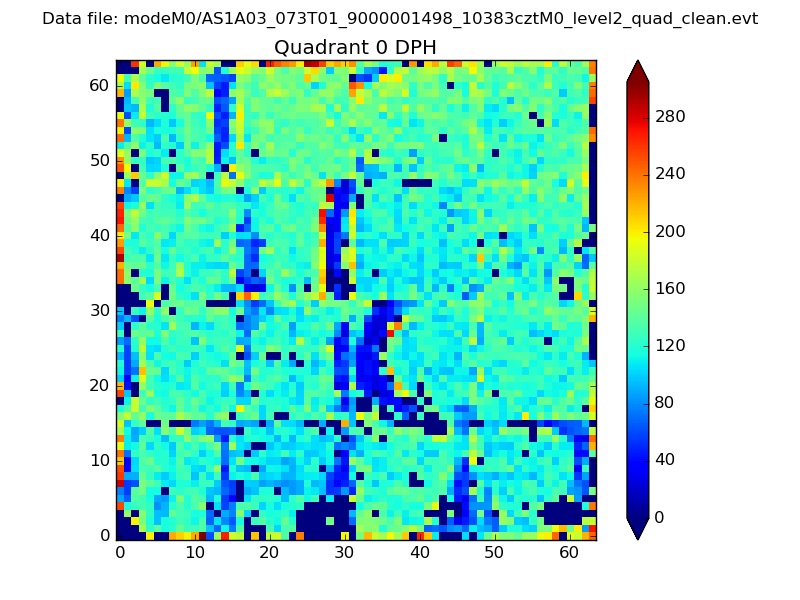 |
 |
Quadrant B |
|---|---|---|---|
| Quadrant D |  |
 |
Quadrant C |
| Plot type | Count rate plots | Images |
|---|---|---|
| Comparison with Poisson distribution Blue bars denote a histogram of data divided into 1 sec bins. Red curve is a Poisson curve with rate = median count rate of data. |
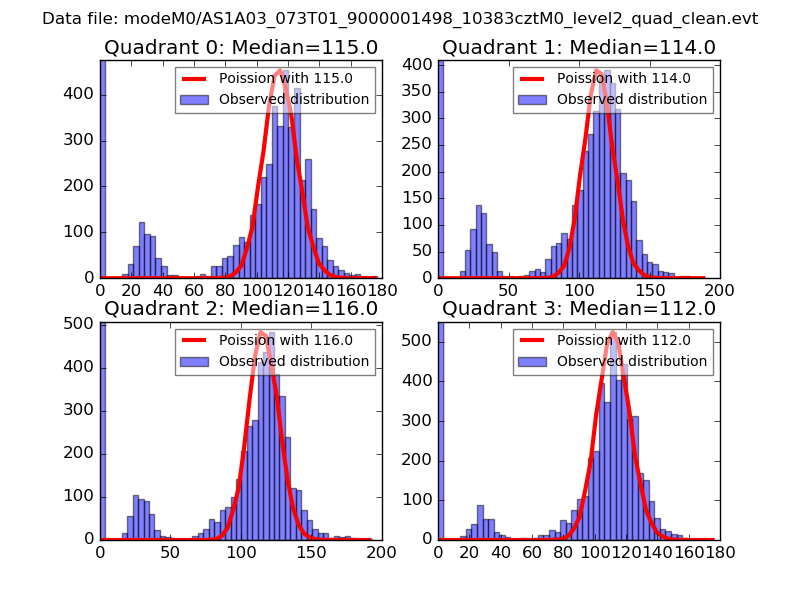 |
 |
| Quadrant-wise count rates Data is divided into 100 sec bins |
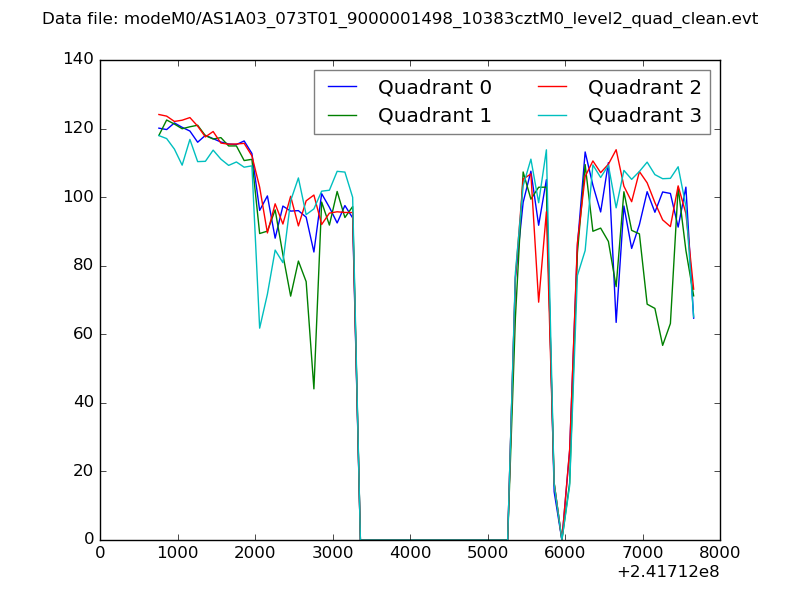 |
|
| Module-wise count rates for Quadrant A Data is divided into 100 sec bins |
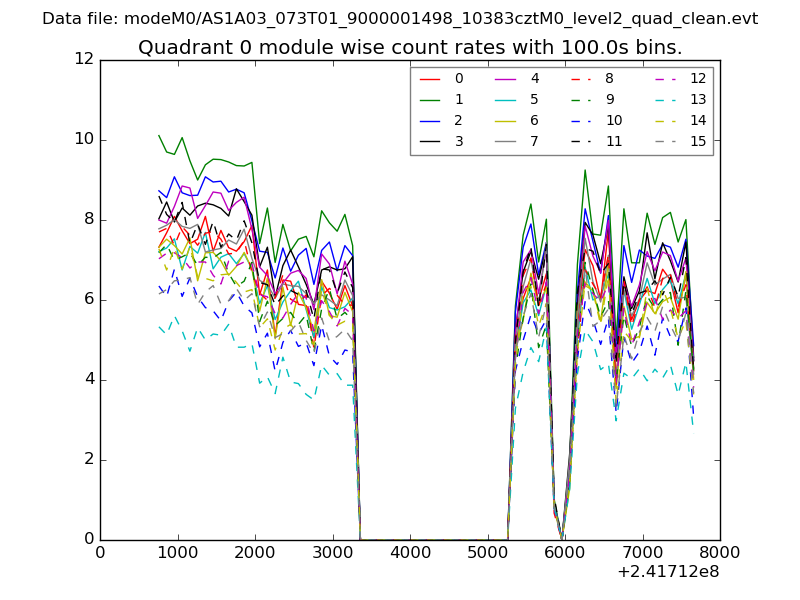 |
 |
| Module-wise count rates for Quadrant B Data is divided into 100 sec bins |
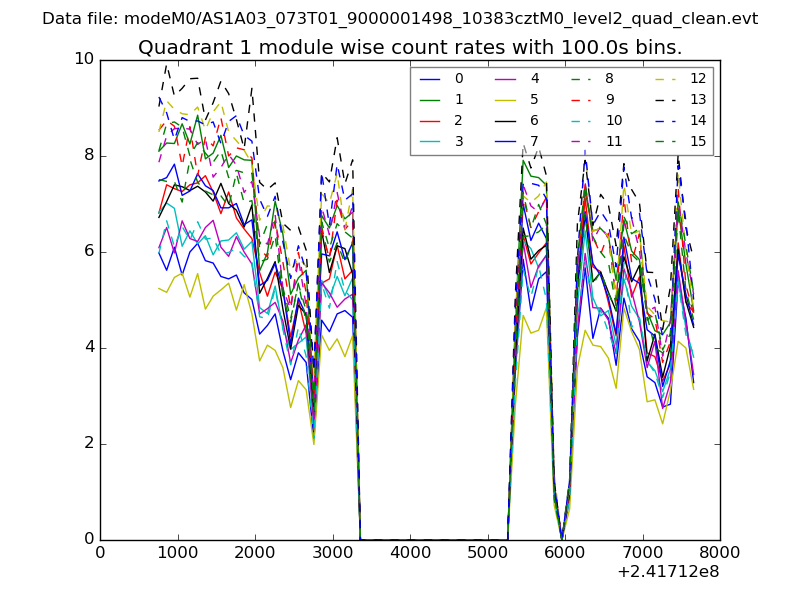 |
 |
| Module-wise count rates for Quadrant C Data is divided into 100 sec bins |
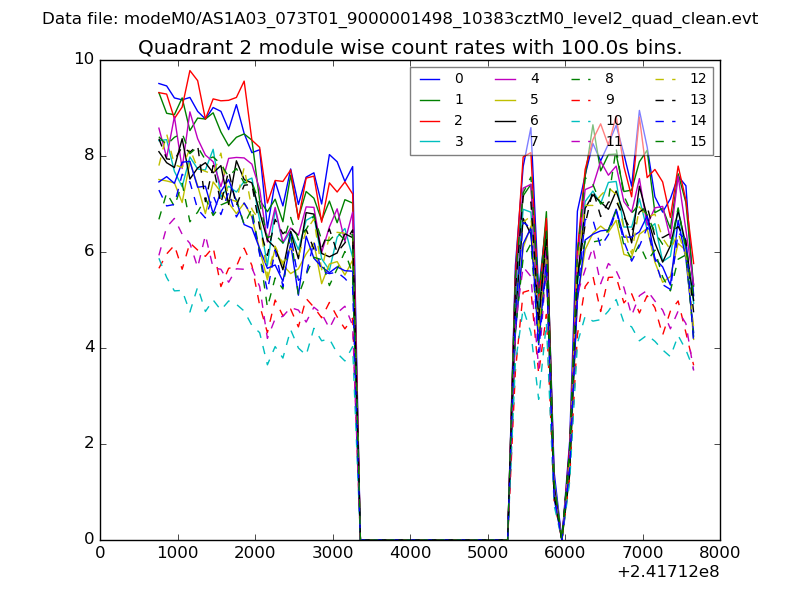 |
 |
| Module-wise count rates for Quadrant D Data is divided into 100 sec bins |
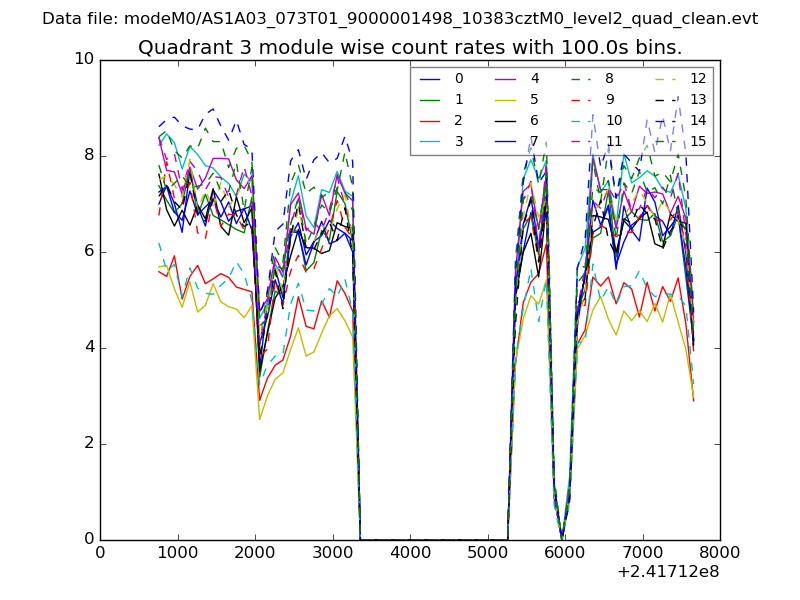 |
 |
| Parameter | Plot |
|---|---|
| CZT HV Monitor | 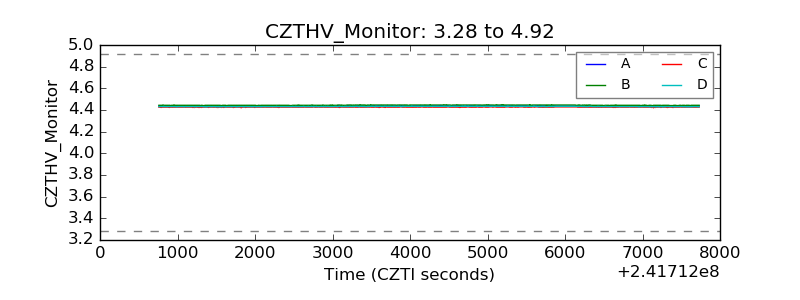 |
| D_VDD | 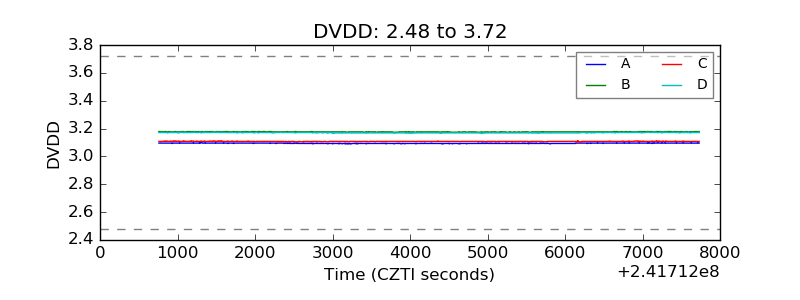 |
| Temperature 1 | 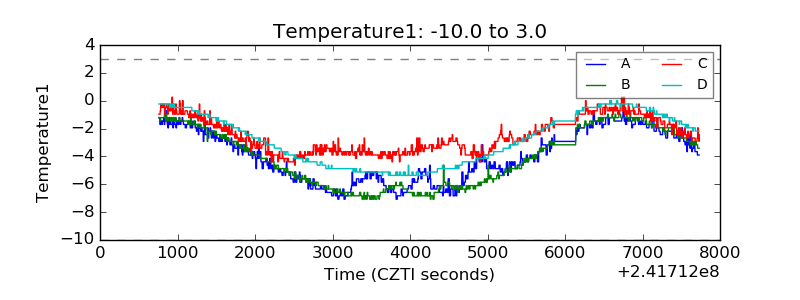 |
| Veto HV Monitor | 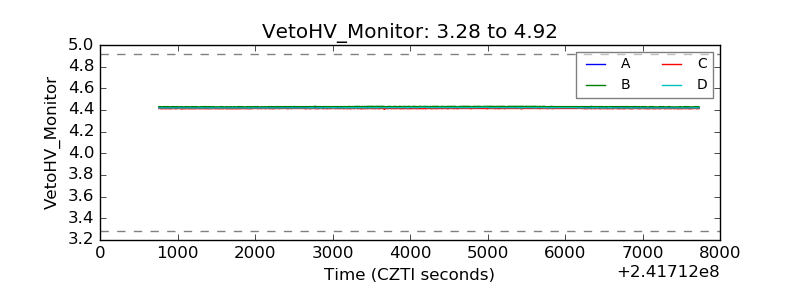 |
| Veto LLD | 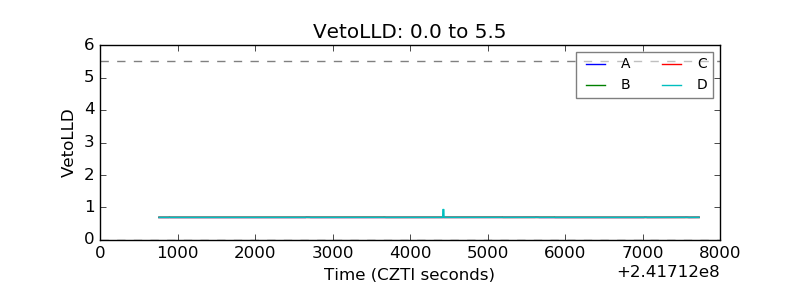 |
| Alpha Counter | 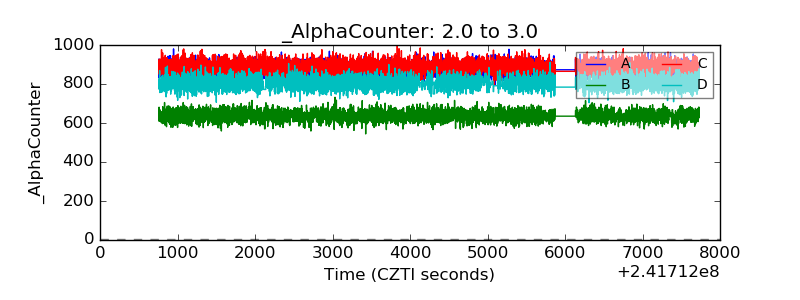 |
| _CPM_Rate | 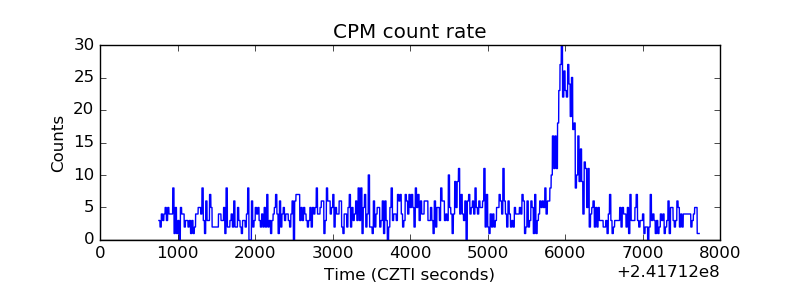 |
| CZT Counter | 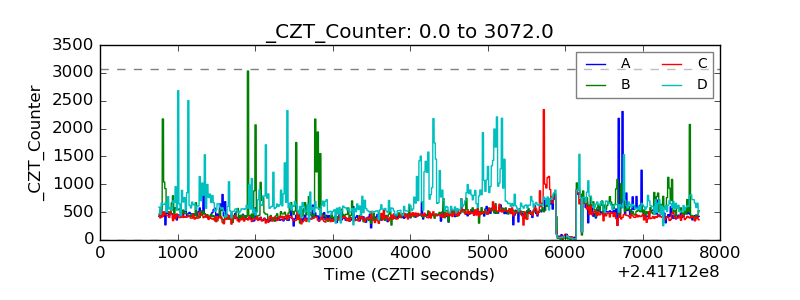 |
| +2.5 Volts monitor |  |
| +5 Volts monitor |  |
| _ROLL_ROT | 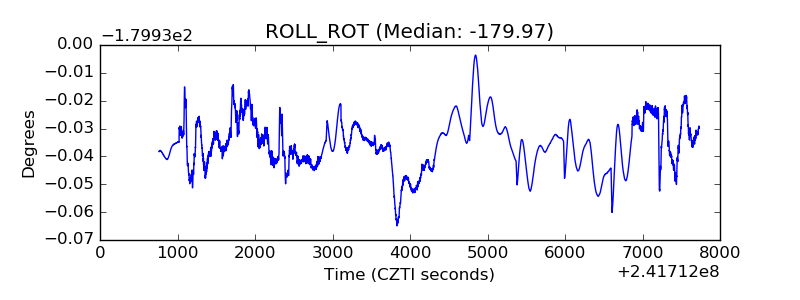 |
| _Roll_DEC | 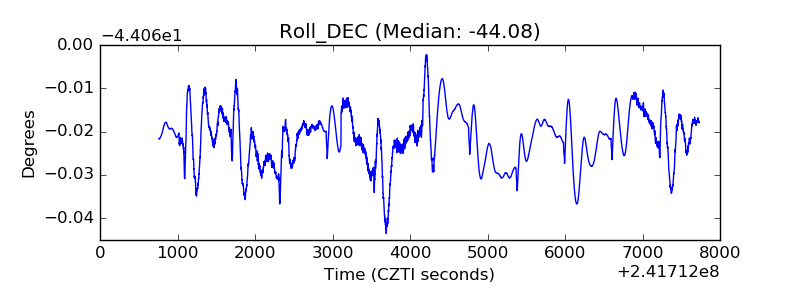 |
| _Roll_RA | 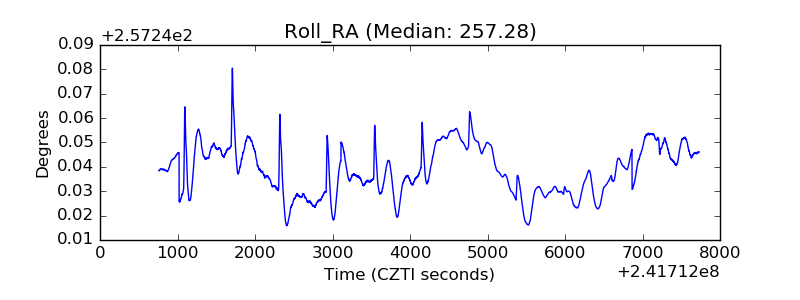 |
| Veto Counter | 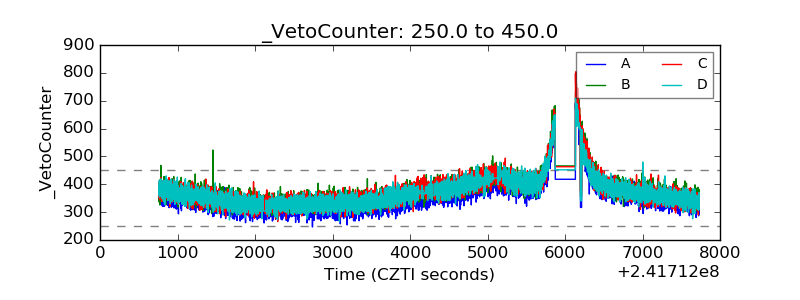 |