| Param | Original file | Final file |
|---|---|---|
| Filename | modeM0/AS1A03_073T01_9000001498_10386cztM0_level2.evt | modeM0/AS1A03_073T01_9000001498_10386cztM0_level2_quad_clean.evt |
| Size (bytes) | 1,385,138,880 | 237,991,680 |
| Size | 1.3 GB | 227.0 MB |
| Events in quadrant A | 8,730,217 | 1,497,838 |
| Events in quadrant B | 9,711,020 | 1,507,469 |
| Events in quadrant C | 8,133,875 | 1,514,058 |
| Events in quadrant D | 14,128,914 | 1,417,878 |
| Mode M9 | |||
|---|---|---|---|
| Quadrant | BADHDUFLAG | Total packets | Discarded packets |
| A | 0 | 19 | 0 |
| B | 0 | 19 | 0 |
| C | 0 | 19 | 0 |
| D | 0 | 19 | 0 |
| Mode SS | |||
|---|---|---|---|
| Quadrant | BADHDUFLAG | Total packets | Discarded packets |
| A | 0 | 372 | 0 |
| B | 0 | 372 | 0 |
| C | 0 | 372 | 0 |
| D | 0 | 372 | 0 |
| Mode M0 | |||
|---|---|---|---|
| Quadrant | BADHDUFLAG | Total packets | Discarded packets |
| A | 0 | 38773 | 7 |
| B | 0 | 41323 | 10 |
| C | 0 | 37447 | 6 |
| D | 0 | 54770 | 13 |
| Quadrant | Total seconds | Saturated seconds | Saturation percentage |
|---|---|---|---|
| A | 18445 | 143 | 0.775278% |
| B | 18444 | 286 | 1.550640% |
| C | 18445 | 28 | 0.151803% |
| D | 18443 | 656 | 3.556905% |
Noise dominated data is calculated using 1-second bins in cleaned event files. If a bin has >2000 counts, and if more than 50% of those come from <1% of pixels, then it is considered to be noise-dominated and hence unusable.
| Quadrant | # 1 sec bins | Bins with >0 counts | Bins with >2000 counts | High rate bins dominated by noise | Noise dominated (total time) | Noise dominated (detector-on time) | Marked lightcurve |
|---|---|---|---|---|---|---|---|
| A | 20321 | 18449 | 71 | 71 | 0.35% | 0.38% |  |
| B | 20321 | 18449 | 145 | 145 | 0.71% | 0.79% |  |
| C | 20321 | 18449 | 5 | 5 | 0.02% | 0.03% |  |
| D | 20321 | 18448 | 564 | 564 | 2.78% | 3.06% |  |
Top three noisy pixels from each quadrant. If the there are fewer than three noisy pixels in the level2.evt file, extra rows are filled as -1
| Pixel properties | Quadrant properties | ||||||
|---|---|---|---|---|---|---|---|
| Quadrant | DetID | PixID | Counts | Sigma | Mean | Median | Sigma |
| A | 5 | 16 | 436505 | 1008.42 | 2128 | 2083 | 430.8 |
| A | 8 | 15 | 45284 | 100.28 | 2128 | 2083 | 430.8 |
| A | 15 | 174 | 30075 | 64.98 | 2128 | 2083 | 430.8 |
| B | 4 | 239 | 1008368 | 2481.34 | 2137 | 2086 | 405.5 |
| B | 0 | 214 | 116588 | 282.34 | 2137 | 2086 | 405.5 |
| B | 11 | 51 | 108169 | 261.58 | 2137 | 2086 | 405.5 |
| C | 14 | 234 | 52450 | 105.33 | 2066 | 2078 | 478.2 |
| C | 13 | 61 | 15501 | 28.07 | 2066 | 2078 | 478.2 |
| C | 8 | 128 | 12636 | 22.08 | 2066 | 2078 | 478.2 |
| D | 1 | 20 | 1987444 | 4042.74 | 2032 | 1975 | 491.1 |
| D | 8 | 195 | 1739145 | 3537.16 | 2032 | 1975 | 491.1 |
| D | 1 | 52 | 1165592 | 2369.31 | 2032 | 1975 | 491.1 |
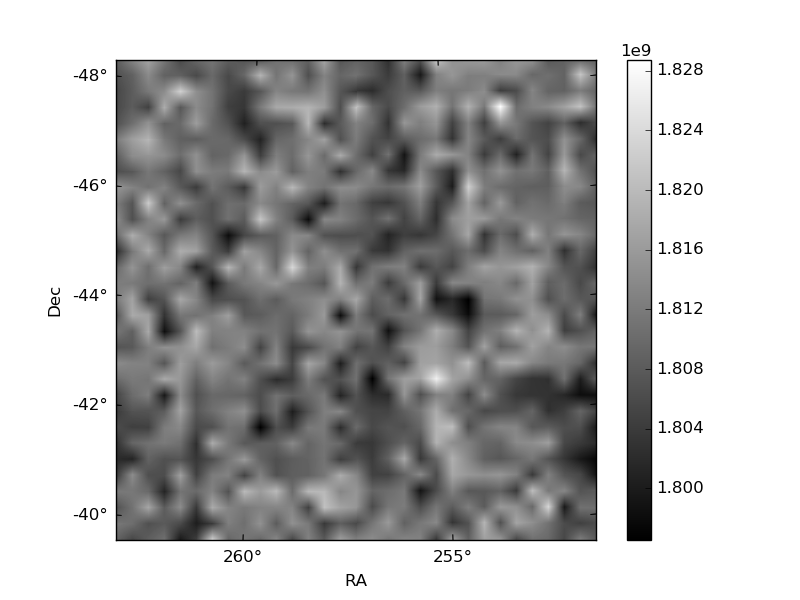
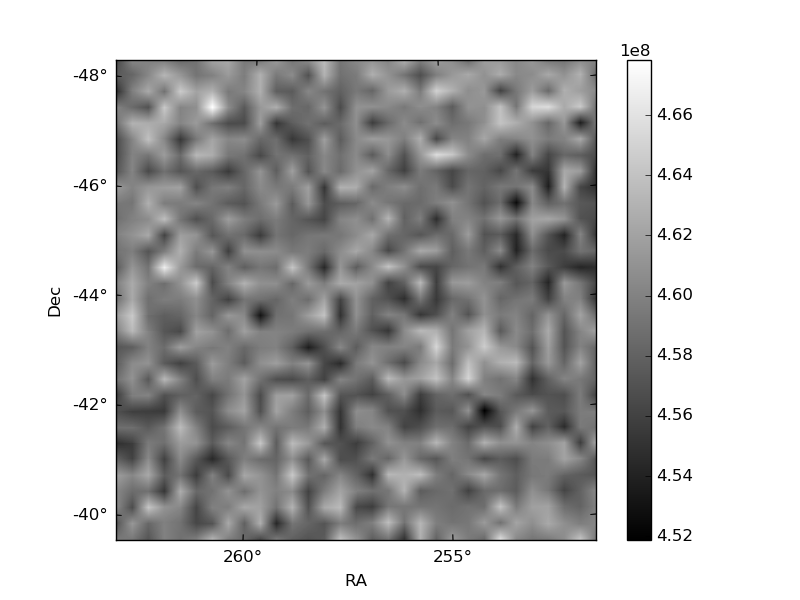
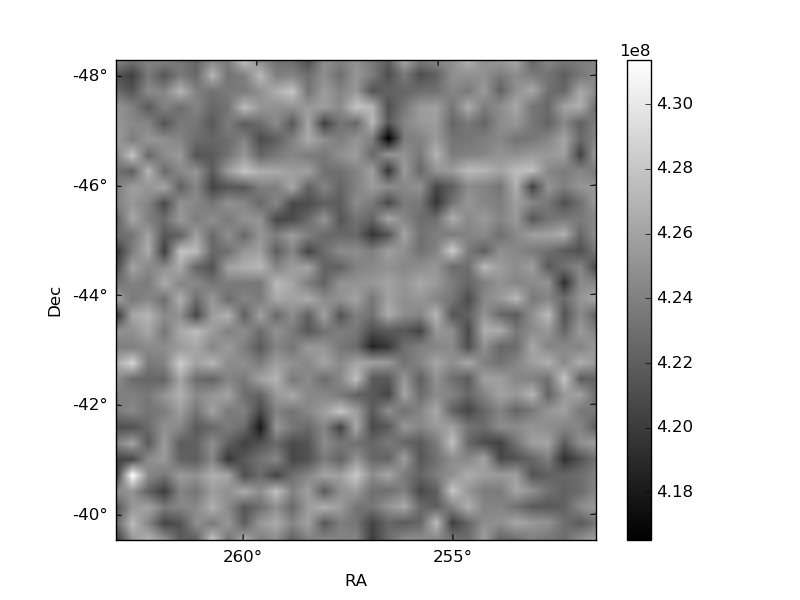
Histogram calculated using DETX and DETY for each event in the final _common_clean file
| Quadrant A | 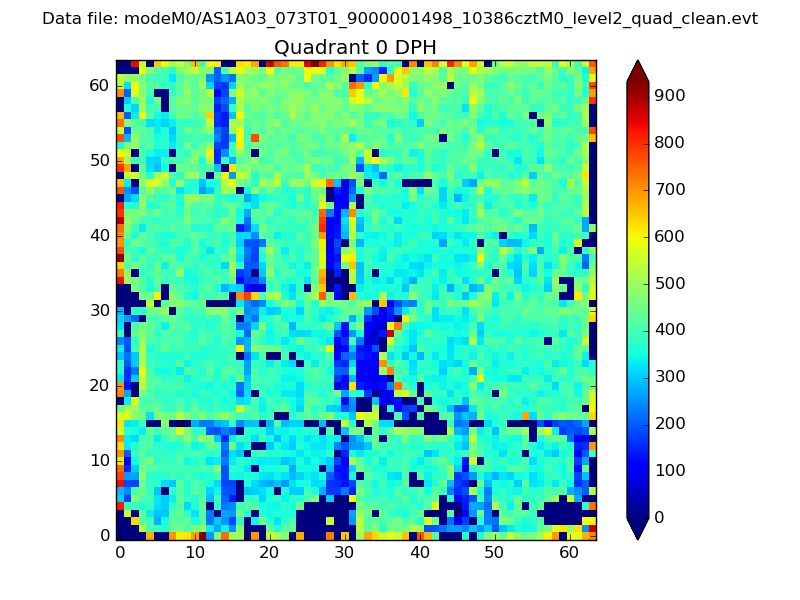 |
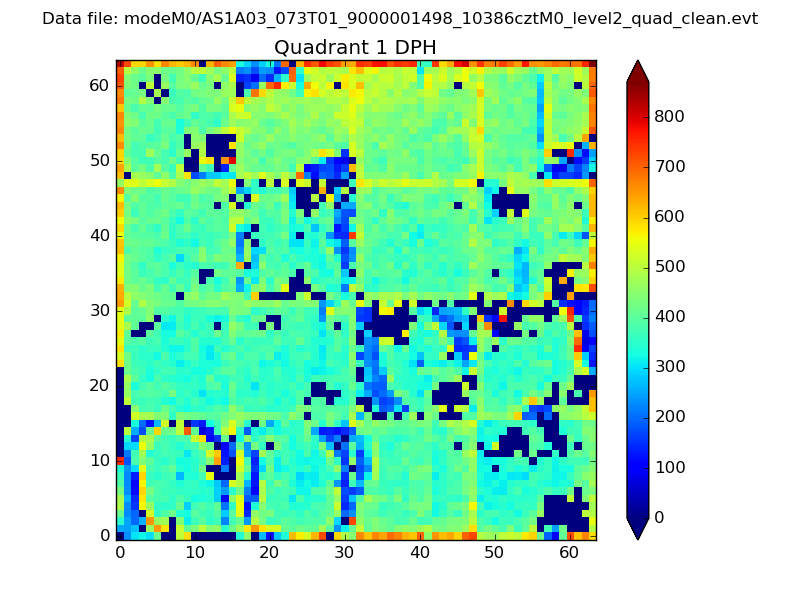 |
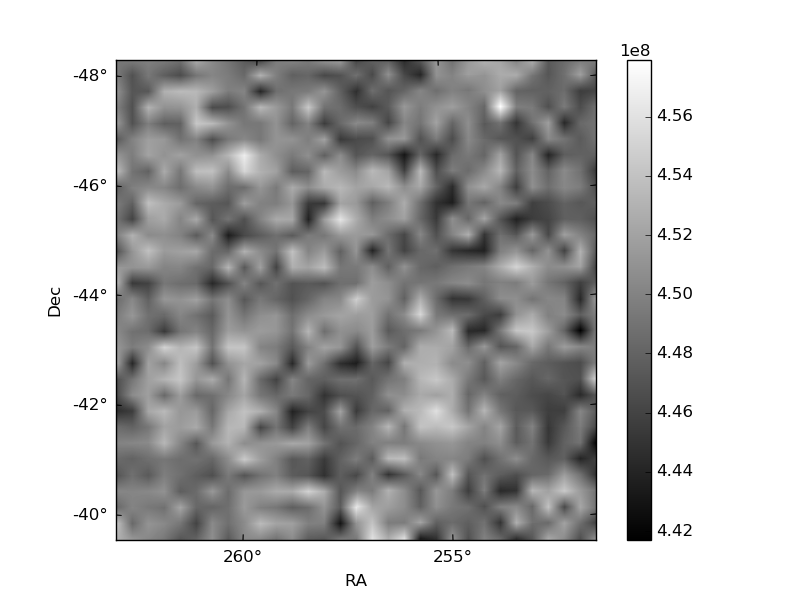
Quadrant B |
|---|---|---|---|
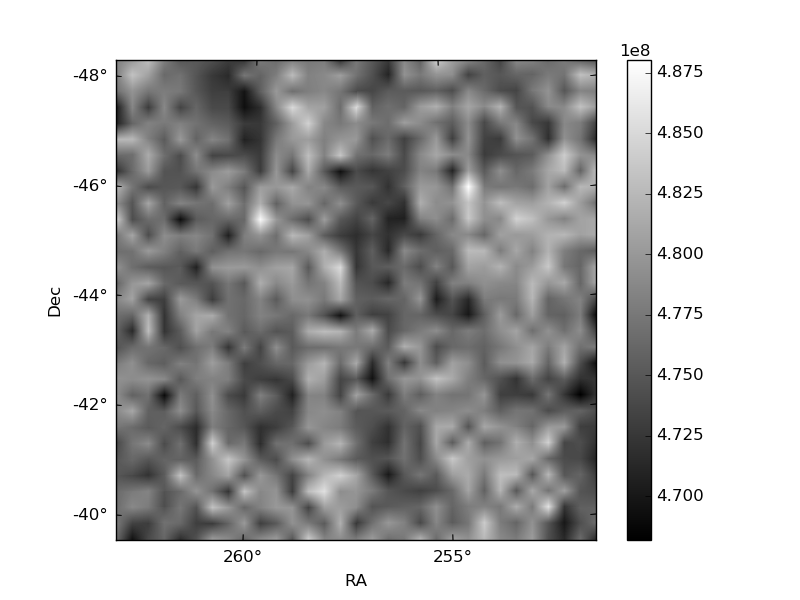
| Quadrant D | 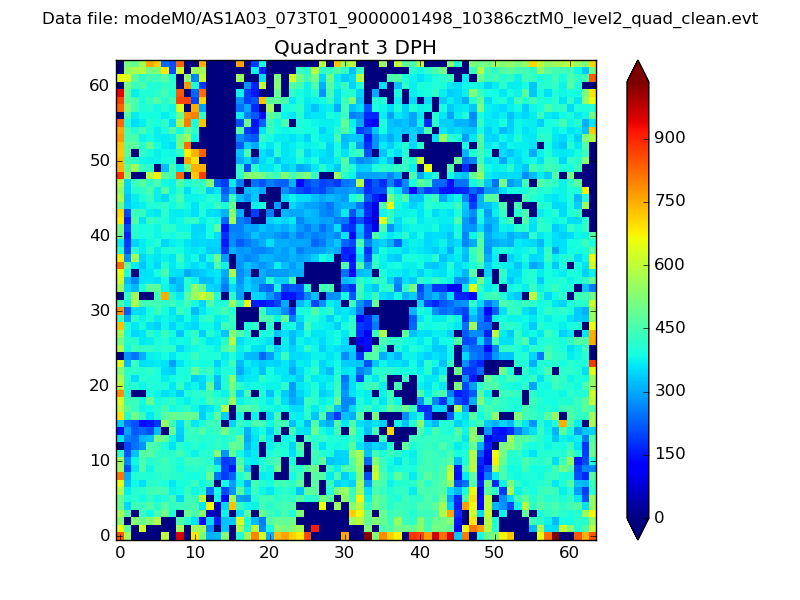 |
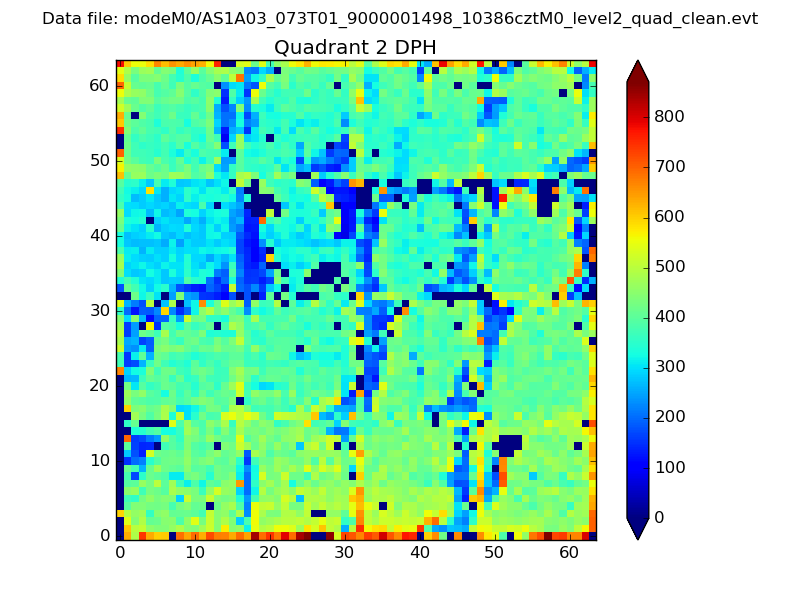 |
Quadrant C |
| Plot type | Count rate plots | Images |
|---|---|---|
| Comparison with Poisson distribution Blue bars denote a histogram of data divided into 1 sec bins. Red curve is a Poisson curve with rate = median count rate of data. |
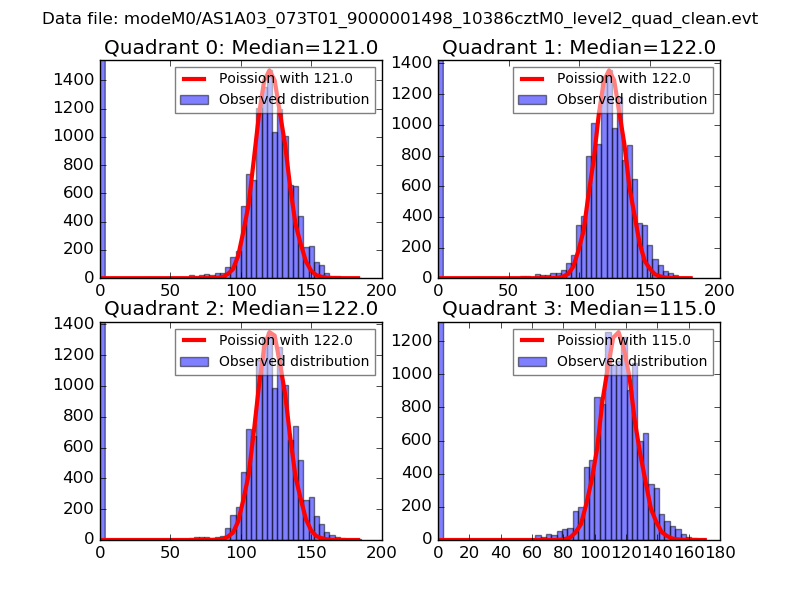 |
 |
| Quadrant-wise count rates Data is divided into 100 sec bins |
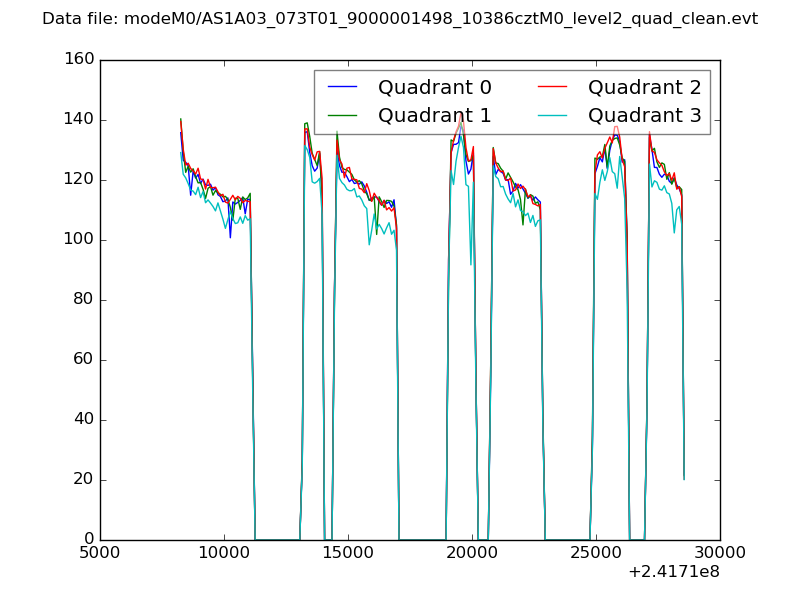 |
|
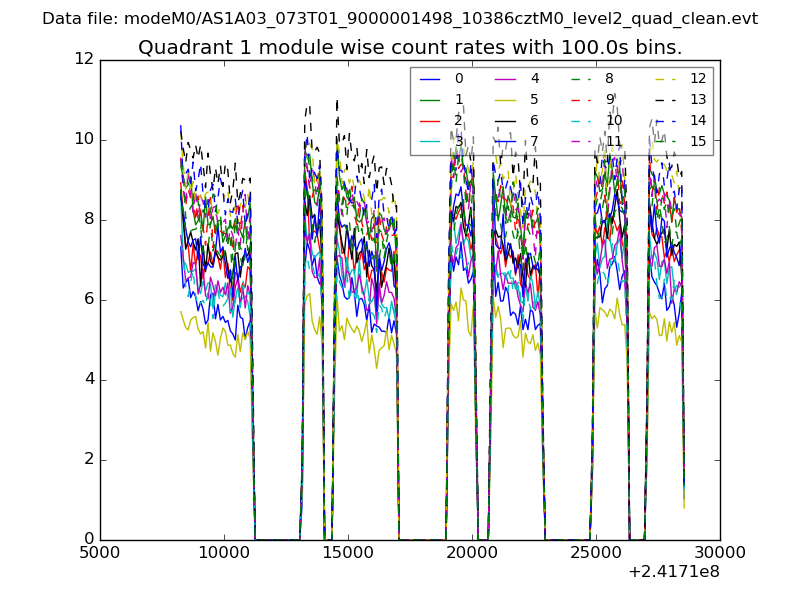
| Module-wise count rates for Quadrant A Data is divided into 100 sec bins |
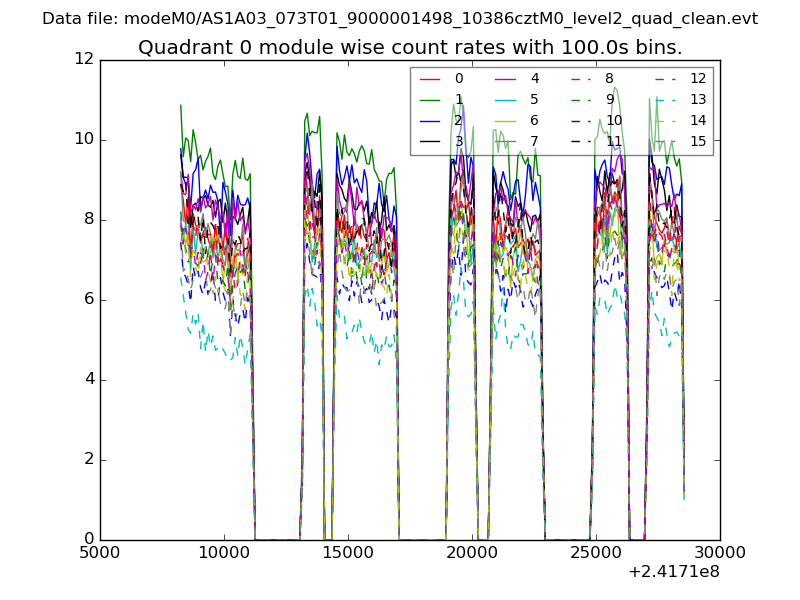 |
 |
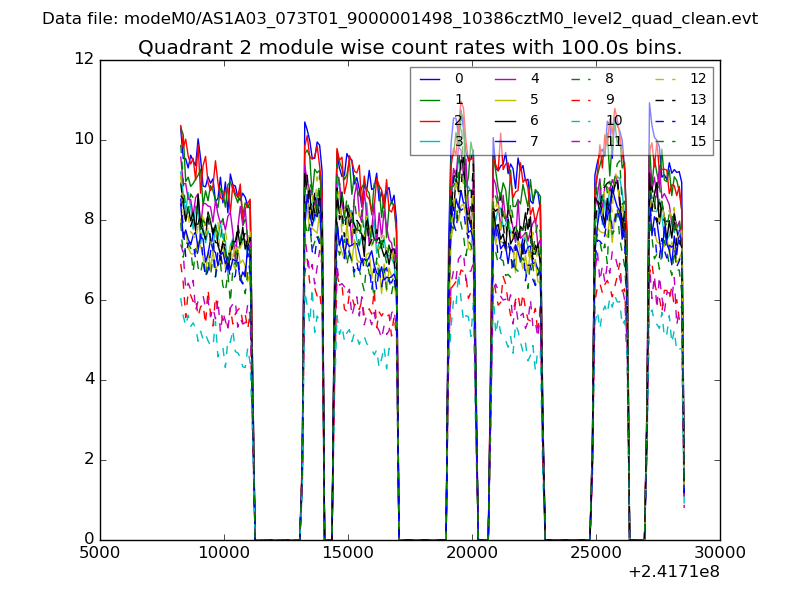
| Module-wise count rates for Quadrant B Data is divided into 100 sec bins |
 |
 |
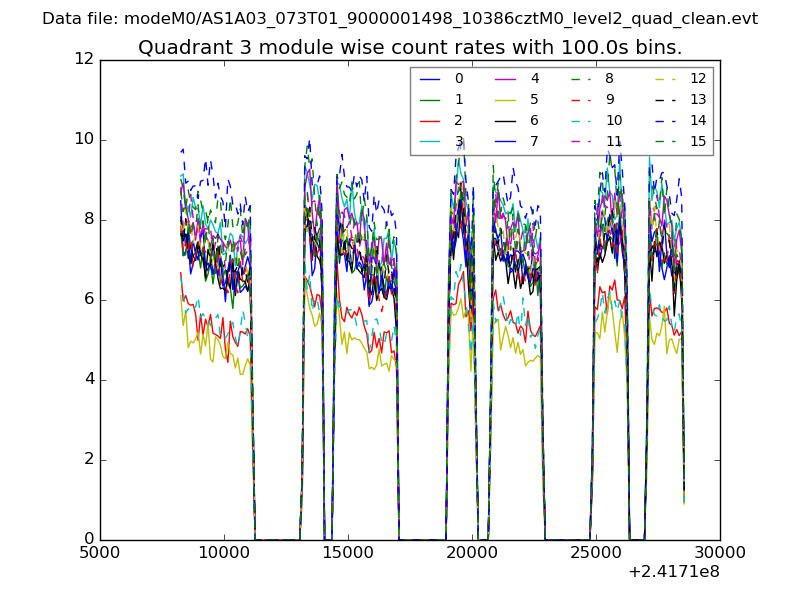
| Module-wise count rates for Quadrant C Data is divided into 100 sec bins |
 |
 |
| Module-wise count rates for Quadrant D Data is divided into 100 sec bins |
 |
 |
| Parameter | Plot |
|---|---|
| CZT HV Monitor | 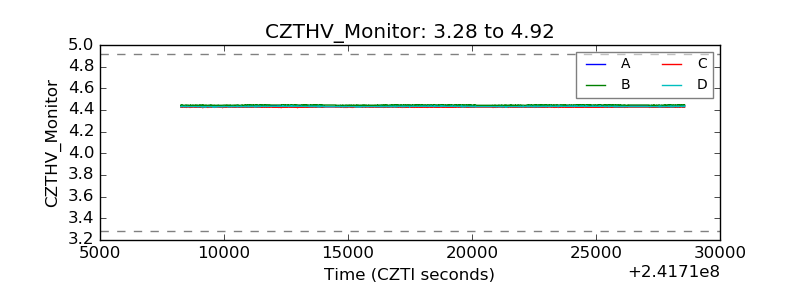 |
| D_VDD | 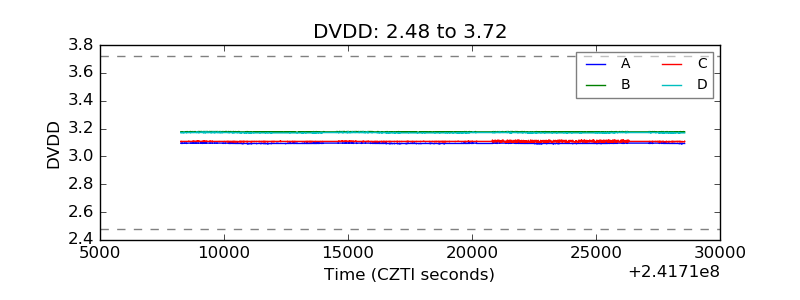 |
| Temperature 1 | 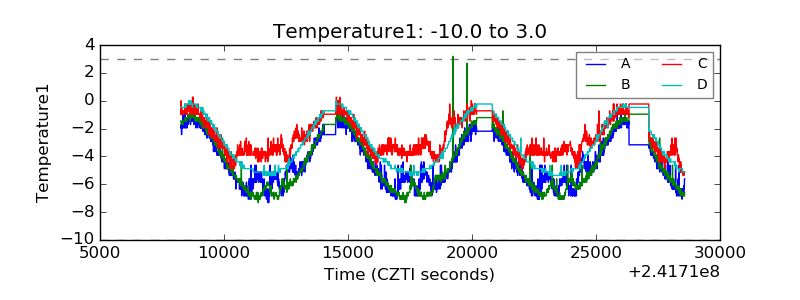 |
| Veto HV Monitor | 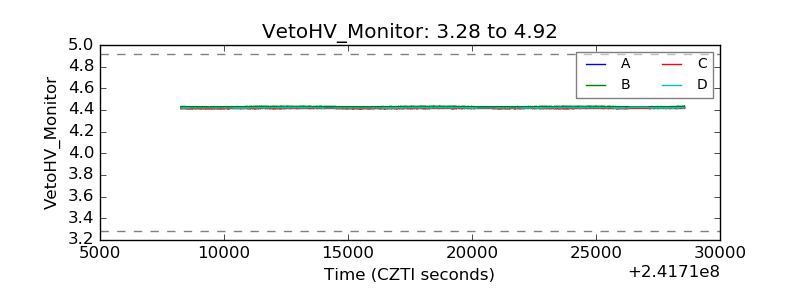 |
| Veto LLD | 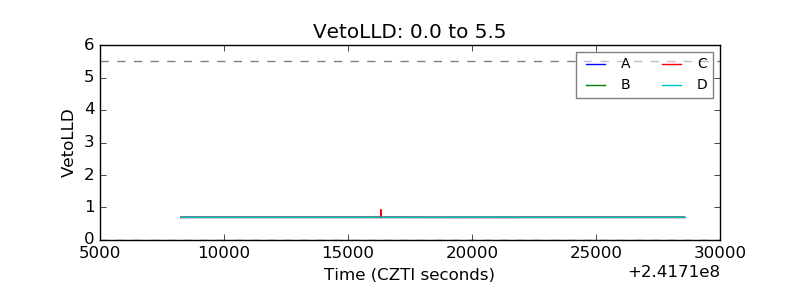 |
| Alpha Counter | 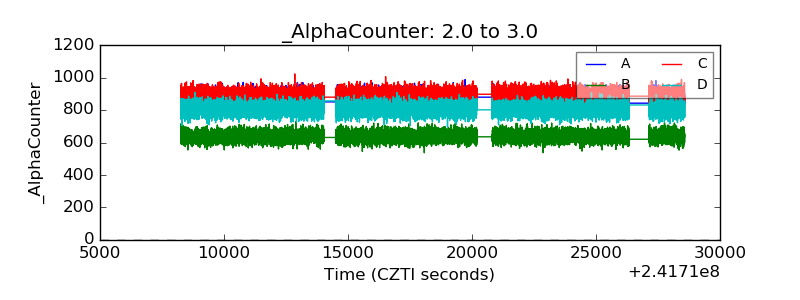 |
| _CPM_Rate | 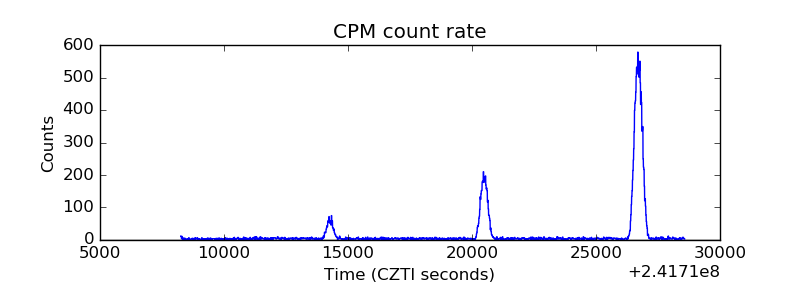 |
| CZT Counter |  |
| +2.5 Volts monitor |  |
| +5 Volts monitor |  |
| _ROLL_ROT | 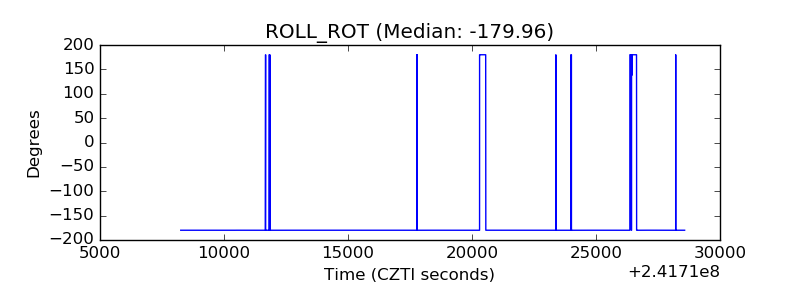 |
| _Roll_DEC | 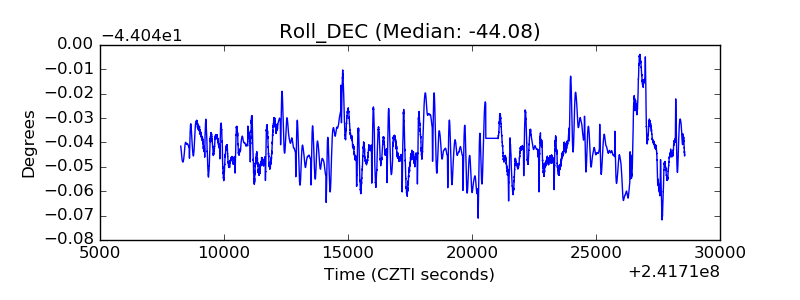 |
| _Roll_RA | 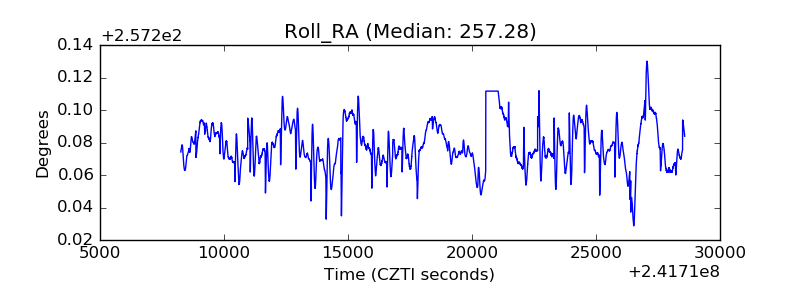 |
| Veto Counter | 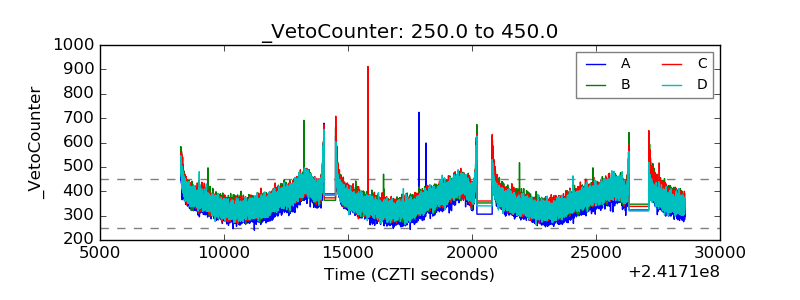 |