| Param | Original file | Final file |
|---|---|---|
| Filename | modeM0/AS1A03_073T01_9000001498_10387cztM0_level2.evt | modeM0/AS1A03_073T01_9000001498_10387cztM0_level2_quad_clean.evt |
| Size (bytes) | 450,757,440 | 85,910,400 |
| Size | 429.9 MB | 81.9 MB |
| Events in quadrant A | 2,884,650 | 544,492 |
| Events in quadrant B | 3,215,999 | 545,989 |
| Events in quadrant C | 2,808,906 | 549,397 |
| Events in quadrant D | 4,307,987 | 516,308 |
| Mode M9 | |||
|---|---|---|---|
| Quadrant | BADHDUFLAG | Total packets | Discarded packets |
| A | 0 | 10 | 0 |
| B | 0 | 10 | 0 |
| C | 0 | 10 | 0 |
| D | 0 | 10 | 0 |
| Mode SS | |||
|---|---|---|---|
| Quadrant | BADHDUFLAG | Total packets | Discarded packets |
| A | 0 | 128 | 0 |
| B | 0 | 128 | 0 |
| C | 0 | 128 | 0 |
| D | 0 | 128 | 0 |
| Mode M0 | |||
|---|---|---|---|
| Quadrant | BADHDUFLAG | Total packets | Discarded packets |
| A | 0 | 12978 | 2 |
| B | 0 | 13786 | 1 |
| C | 0 | 12885 | 1 |
| D | 0 | 17166 | 1 |
| Quadrant | Total seconds | Saturated seconds | Saturation percentage |
|---|---|---|---|
| A | 6388 | 25 | 0.391359% |
| B | 6388 | 78 | 1.221039% |
| C | 6388 | 15 | 0.234815% |
| D | 6388 | 95 | 1.487163% |
Noise dominated data is calculated using 1-second bins in cleaned event files. If a bin has >2000 counts, and if more than 50% of those come from <1% of pixels, then it is considered to be noise-dominated and hence unusable.
| Quadrant | # 1 sec bins | Bins with >0 counts | Bins with >2000 counts | High rate bins dominated by noise | Noise dominated (total time) | Noise dominated (detector-on time) | Marked lightcurve |
|---|---|---|---|---|---|---|---|
| A | 7348 | 6388 | 3 | 3 | 0.04% | 0.05% |  |
| B | 7348 | 6389 | 25 | 25 | 0.34% | 0.39% |  |
| C | 7348 | 6388 | 0 | 0 | 0.00% | 0.00% | 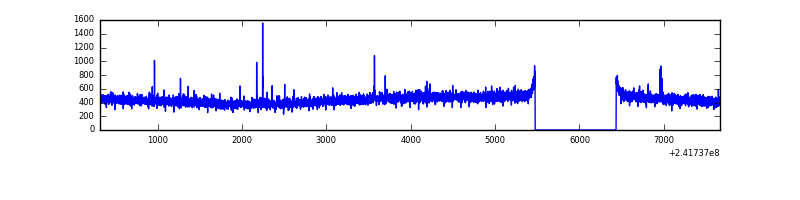 |
| D | 7348 | 6389 | 90 | 90 | 1.22% | 1.41% | 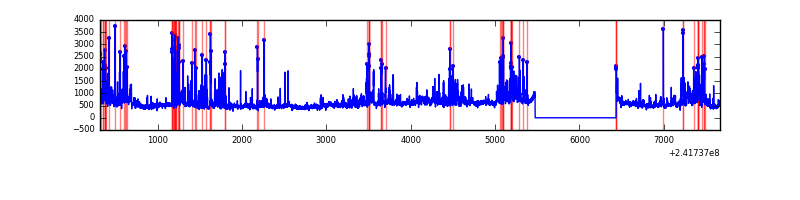 |
Top three noisy pixels from each quadrant. If the there are fewer than three noisy pixels in the level2.evt file, extra rows are filled as -1
| Pixel properties | Quadrant properties | ||||||
|---|---|---|---|---|---|---|---|
| Quadrant | DetID | PixID | Counts | Sigma | Mean | Median | Sigma |
| A | 5 | 16 | 23252 | 149.93 | 736 | 721 | 150.3 |
| A | 8 | 15 | 15624 | 99.17 | 736 | 721 | 150.3 |
| A | 0 | 226 | 6783 | 40.34 | 736 | 721 | 150.3 |
| B | 4 | 239 | 198304 | 1392.44 | 742 | 724 | 141.9 |
| B | 0 | 214 | 42275 | 292.83 | 742 | 724 | 141.9 |
| B | 0 | 219 | 27416 | 188.11 | 742 | 724 | 141.9 |
| C | 14 | 234 | 12339 | 69.32 | 717 | 720 | 167.6 |
| C | 13 | 61 | 5262 | 27.1 | 717 | 720 | 167.6 |
| C | 14 | 67 | 1907 | 7.08 | 717 | 720 | 167.6 |
| D | 1 | 20 | 814380 | 4801.53 | 705 | 685 | 169.5 |
| D | 8 | 195 | 560115 | 3301.14 | 705 | 685 | 169.5 |
| D | 12 | 233 | 121994 | 715.83 | 705 | 685 | 169.5 |
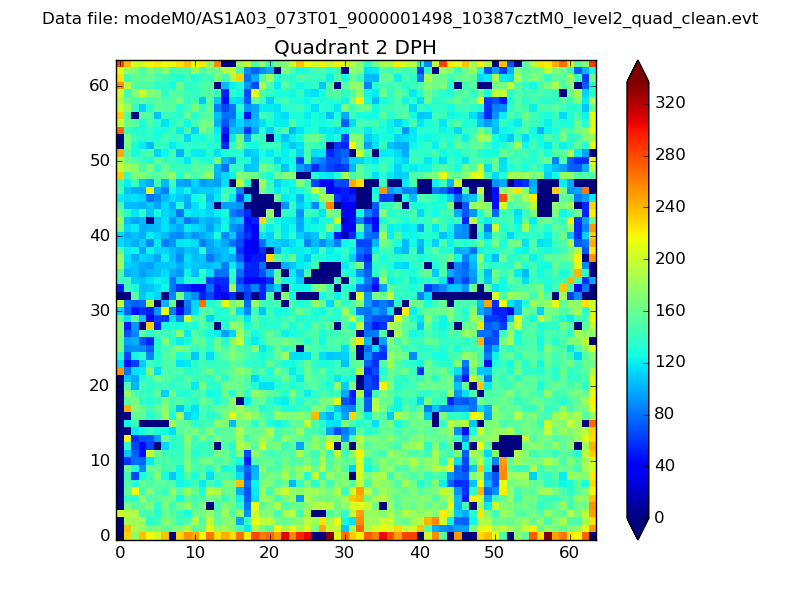
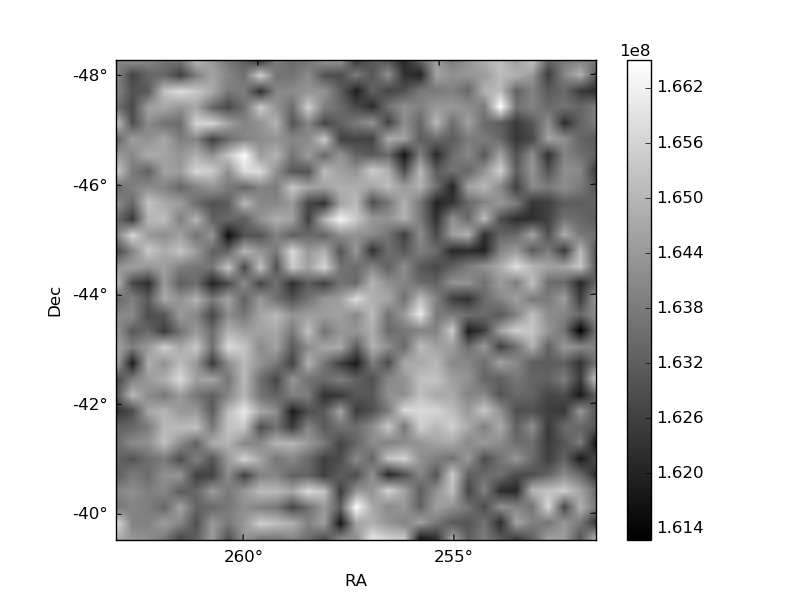
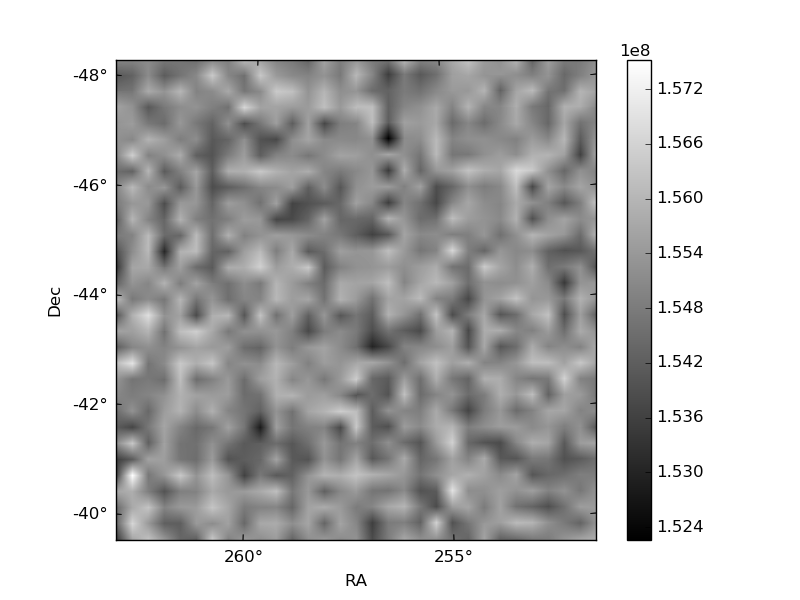
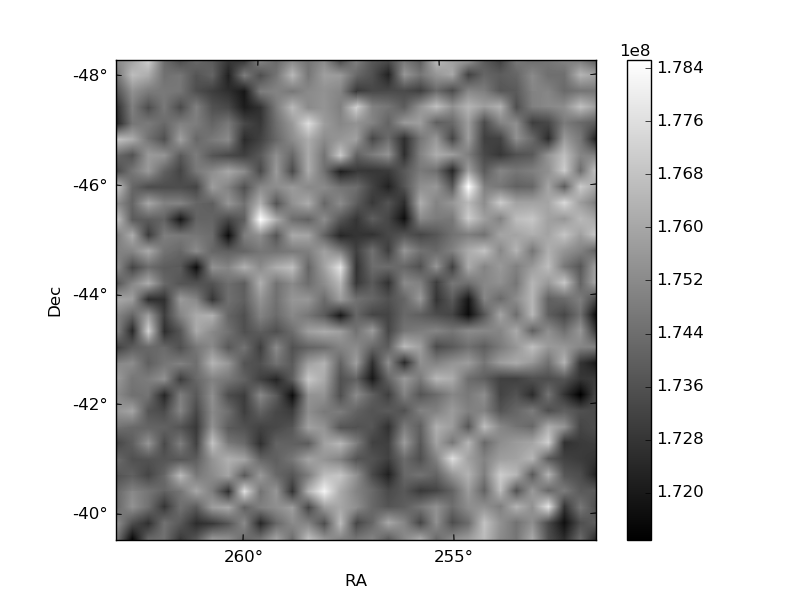
Histogram calculated using DETX and DETY for each event in the final _common_clean file
| Quadrant A | 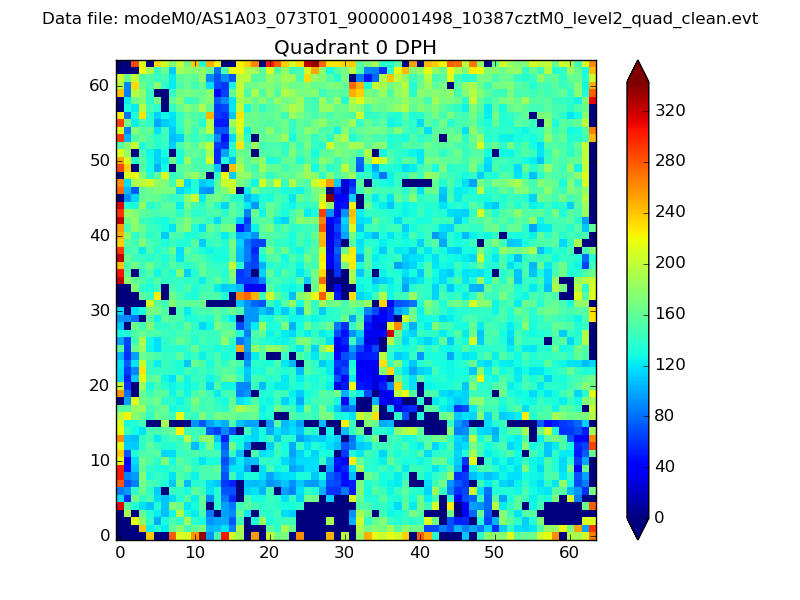 |
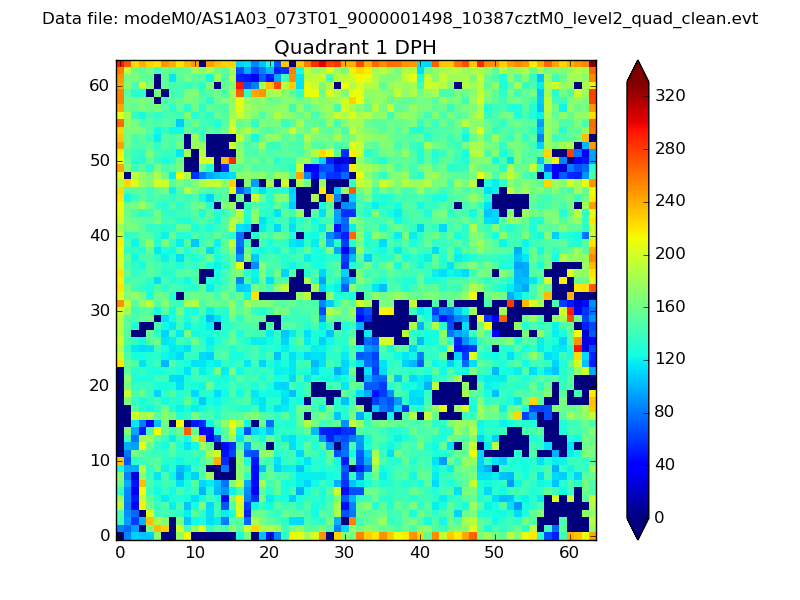 |
Quadrant B |
|---|---|---|---|
| Quadrant D | 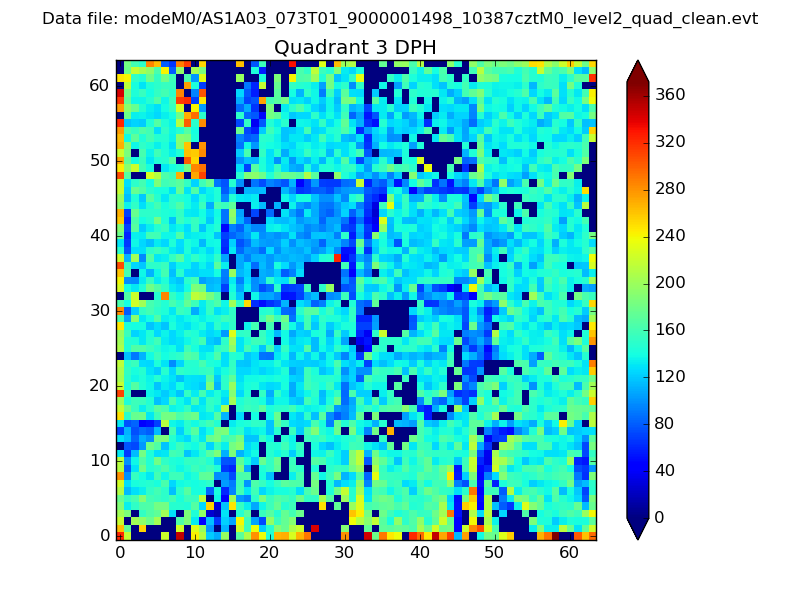 |
 |
Quadrant C |
| Plot type | Count rate plots | Images |
|---|---|---|
| Comparison with Poisson distribution Blue bars denote a histogram of data divided into 1 sec bins. Red curve is a Poisson curve with rate = median count rate of data. |
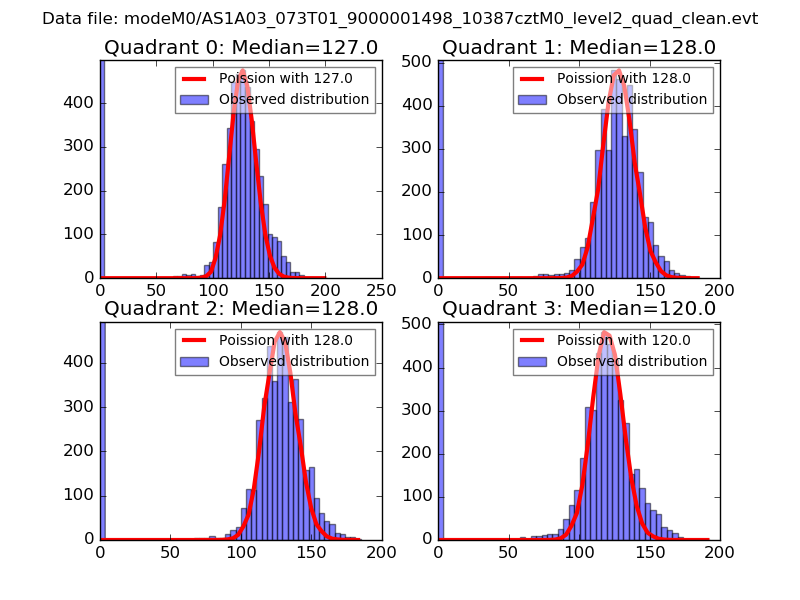 |
 |
| Quadrant-wise count rates Data is divided into 100 sec bins |
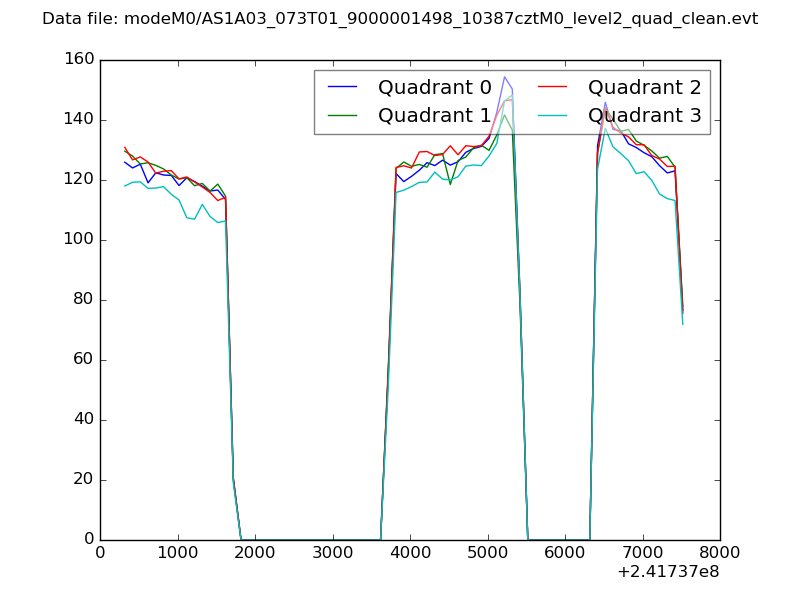 |
|
| Module-wise count rates for Quadrant A Data is divided into 100 sec bins |
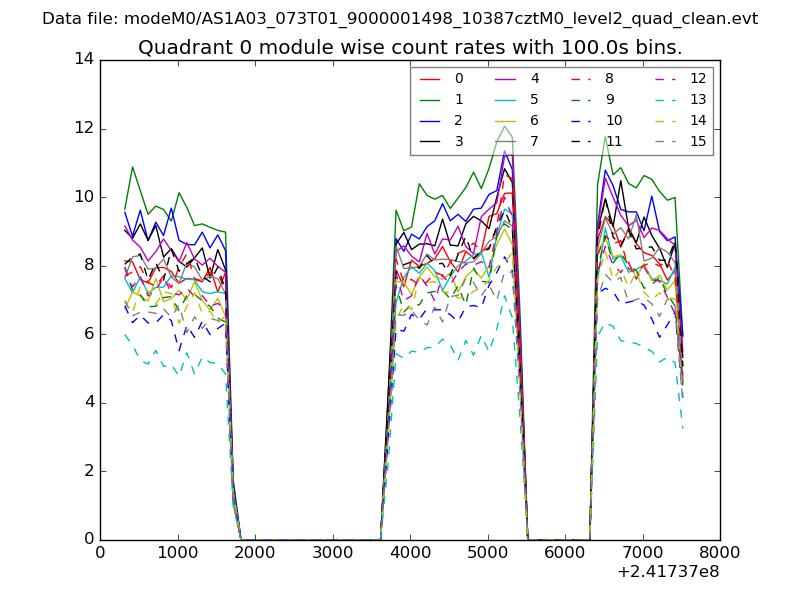 |
 |
| Module-wise count rates for Quadrant B Data is divided into 100 sec bins |
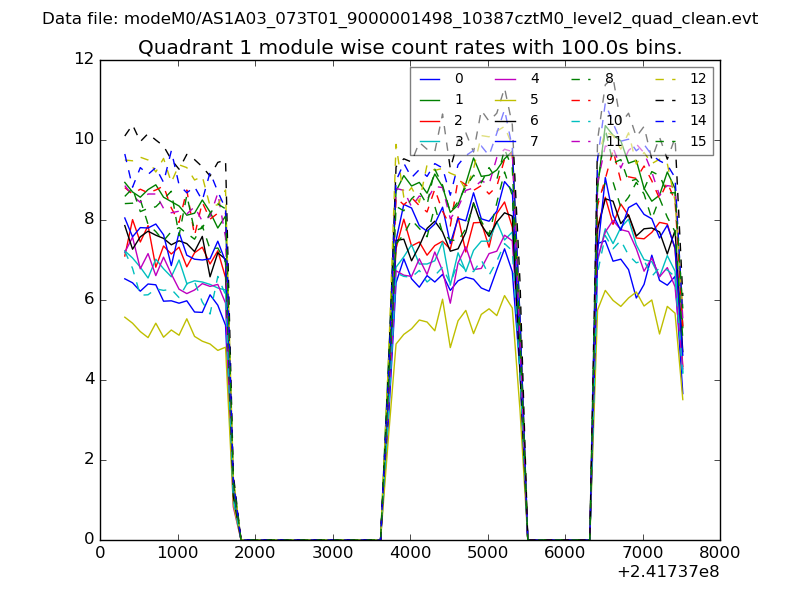 |
 |
| Module-wise count rates for Quadrant C Data is divided into 100 sec bins |
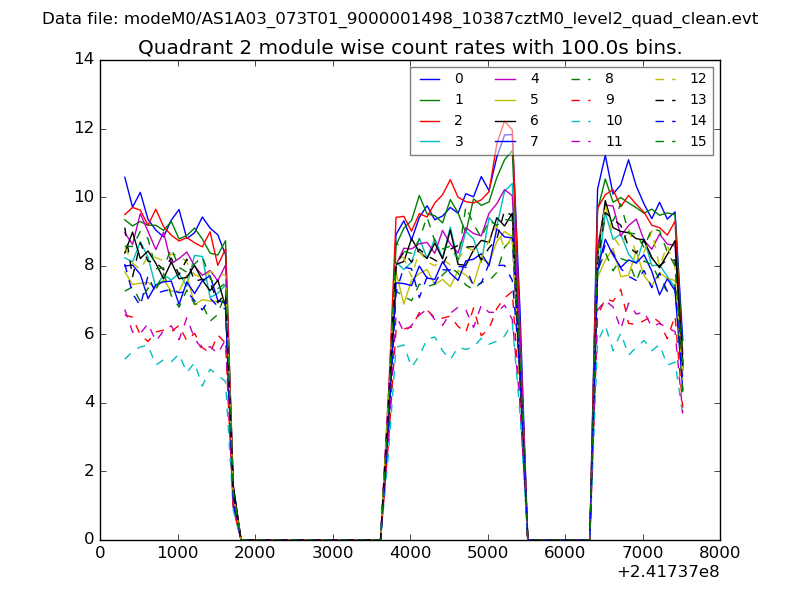 |
 |
| Module-wise count rates for Quadrant D Data is divided into 100 sec bins |
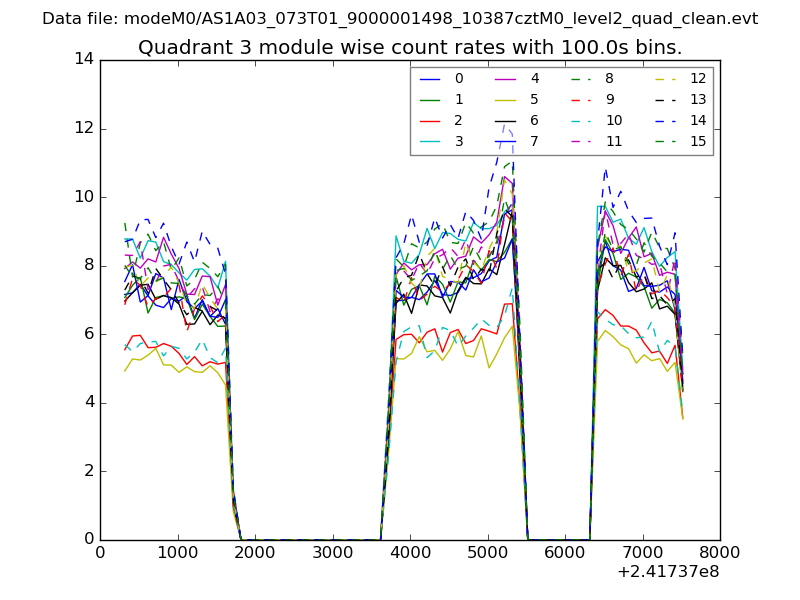 |
 |
| Parameter | Plot |
|---|---|
| CZT HV Monitor | 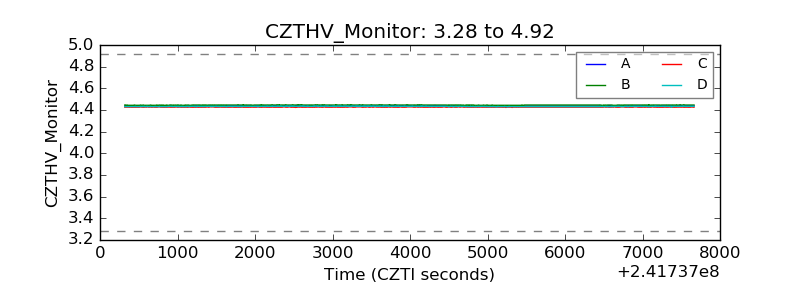 |
| D_VDD |  |
| Temperature 1 | 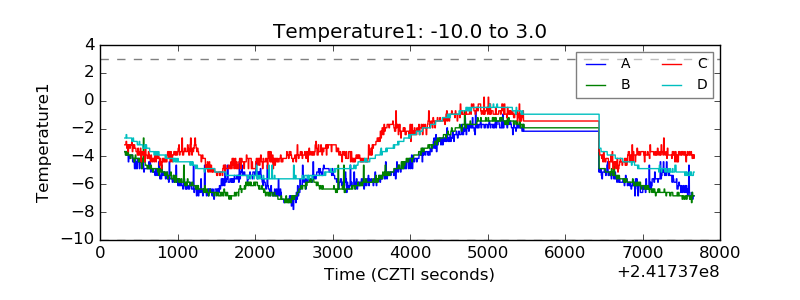 |
| Veto HV Monitor | 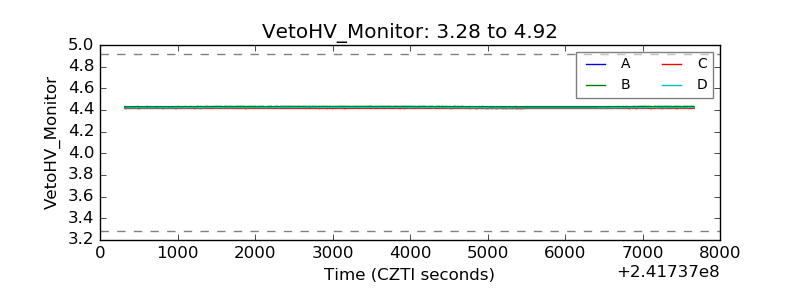 |
| Veto LLD | 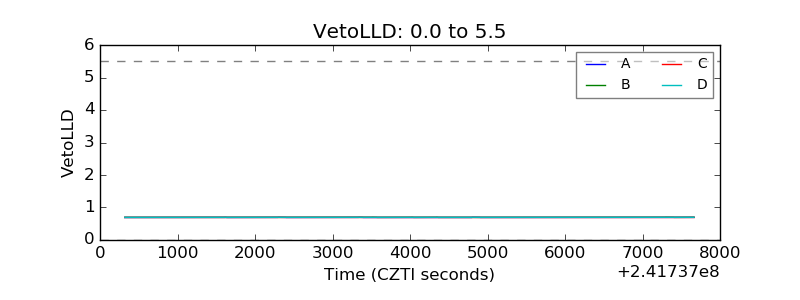 |
| Alpha Counter | 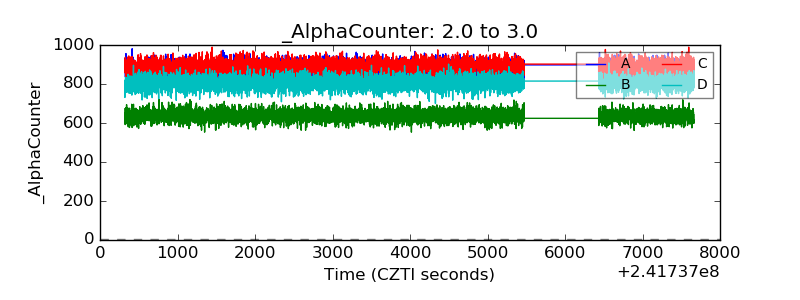 |
| _CPM_Rate | 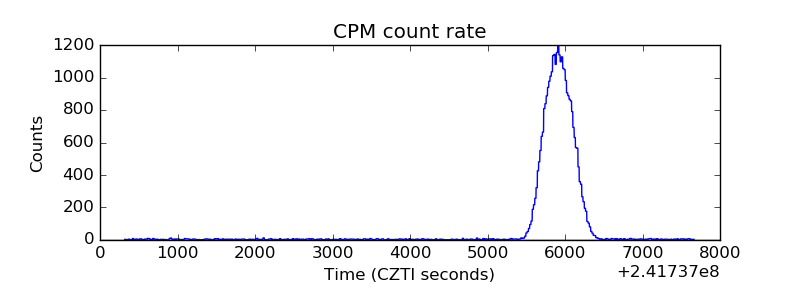 |
| CZT Counter | 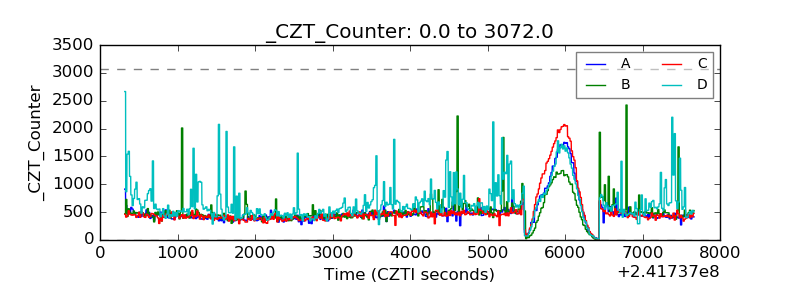 |
| +2.5 Volts monitor |  |
| +5 Volts monitor |  |
| _ROLL_ROT | 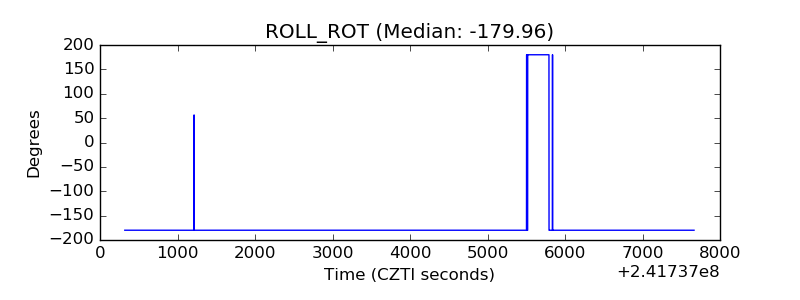 |
| _Roll_DEC | 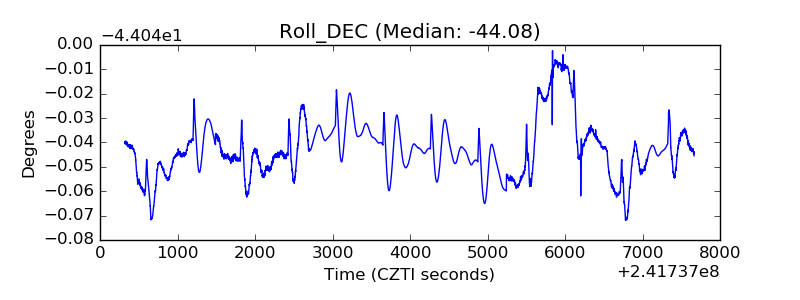 |
| _Roll_RA | 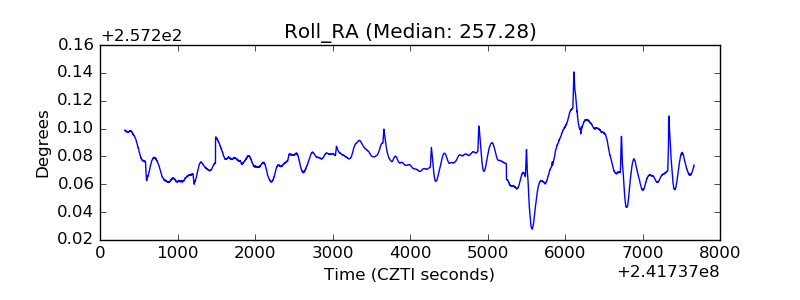 |
| Veto Counter | 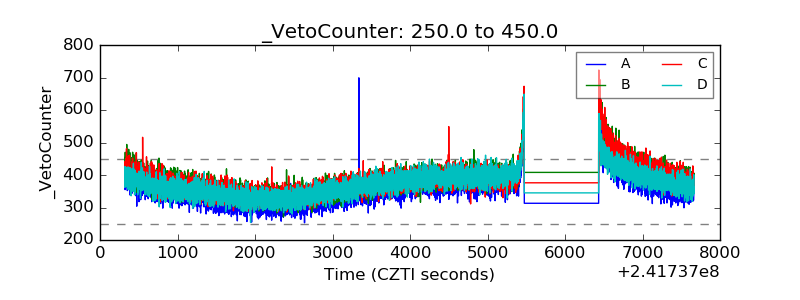 |