| Param | Original file | Final file |
|---|---|---|
| Filename | modeM0/AS1A03_073T01_9000001498_10389cztM0_level2.evt | modeM0/AS1A03_073T01_9000001498_10389cztM0_level2_quad_clean.evt |
| Size (bytes) | 478,307,520 | 85,723,200 |
| Size | 456.1 MB | 81.8 MB |
| Events in quadrant A | 3,142,930 | 534,000 |
| Events in quadrant B | 3,500,226 | 538,646 |
| Events in quadrant C | 3,213,213 | 539,737 |
| Events in quadrant D | 4,165,247 | 507,474 |
| Mode M9 | |||
|---|---|---|---|
| Quadrant | BADHDUFLAG | Total packets | Discarded packets |
| A | 0 | 21 | 0 |
| B | 0 | 21 | 0 |
| C | 0 | 21 | 0 |
| D | 0 | 21 | 0 |
| Mode SS | |||
|---|---|---|---|
| Quadrant | BADHDUFLAG | Total packets | Discarded packets |
| A | 0 | 140 | 0 |
| B | 0 | 140 | 0 |
| C | 0 | 140 | 0 |
| D | 0 | 140 | 0 |
| Mode M0 | |||
|---|---|---|---|
| Quadrant | BADHDUFLAG | Total packets | Discarded packets |
| A | 0 | 13944 | 3 |
| B | 0 | 14807 | 2 |
| C | 0 | 14232 | 2 |
| D | 0 | 16810 | 2 |
| Quadrant | Total seconds | Saturated seconds | Saturation percentage |
|---|---|---|---|
| A | 6834 | 38 | 0.556043% |
| B | 6834 | 89 | 1.302312% |
| C | 6834 | 70 | 1.024290% |
| D | 6834 | 104 | 1.521803% |
Noise dominated data is calculated using 1-second bins in cleaned event files. If a bin has >2000 counts, and if more than 50% of those come from <1% of pixels, then it is considered to be noise-dominated and hence unusable.
| Quadrant | # 1 sec bins | Bins with >0 counts | Bins with >2000 counts | High rate bins dominated by noise | Noise dominated (total time) | Noise dominated (detector-on time) | Marked lightcurve |
|---|---|---|---|---|---|---|---|
| A | 8884 | 6835 | 0 | 0 | 0.00% | 0.00% | 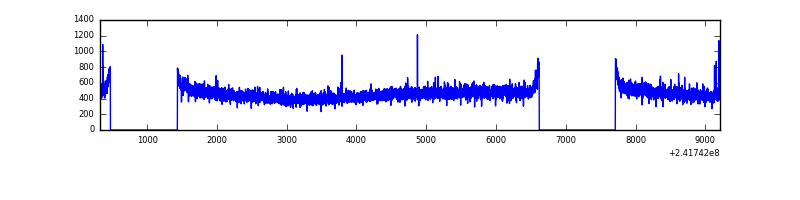 |
| B | 8884 | 6835 | 19 | 19 | 0.21% | 0.28% | 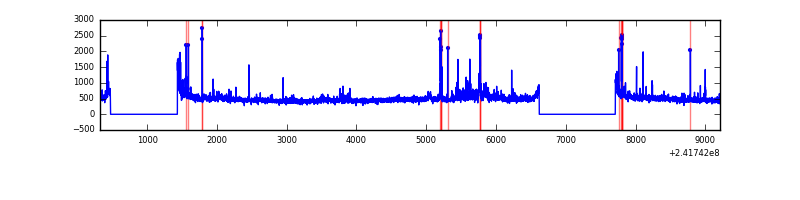 |
| C | 8884 | 6835 | 39 | 39 | 0.44% | 0.57% | 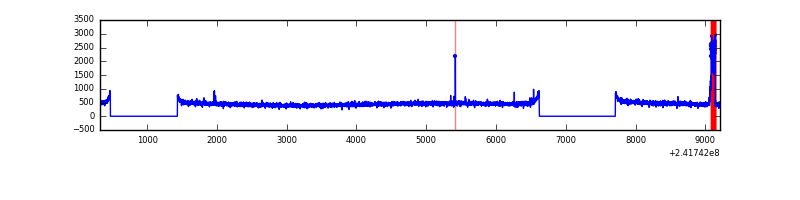 |
| D | 8884 | 6836 | 78 | 78 | 0.88% | 1.14% | 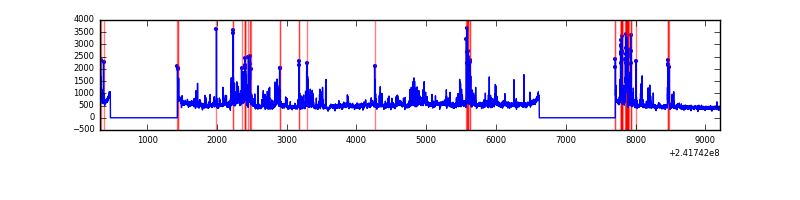 |
Top three noisy pixels from each quadrant. If the there are fewer than three noisy pixels in the level2.evt file, extra rows are filled as -1
| Pixel properties | Quadrant properties | ||||||
|---|---|---|---|---|---|---|---|
| Quadrant | DetID | PixID | Counts | Sigma | Mean | Median | Sigma |
| A | 5 | 16 | 10835 | 61.07 | 808 | 794 | 164.4 |
| A | 0 | 226 | 7437 | 40.41 | 808 | 794 | 164.4 |
| A | 12 | 194 | 6543 | 34.97 | 808 | 794 | 164.4 |
| B | 4 | 239 | 164278 | 1051.96 | 816 | 796 | 155.4 |
| B | 0 | 214 | 55909 | 354.64 | 816 | 796 | 155.4 |
| B | 4 | 81 | 32671 | 205.11 | 816 | 796 | 155.4 |
| C | 1 | 3 | 126978 | 690.17 | 789 | 793 | 182.8 |
| C | 14 | 234 | 8470 | 41.99 | 789 | 793 | 182.8 |
| C | 13 | 61 | 5930 | 28.1 | 789 | 793 | 182.8 |
| D | 8 | 195 | 444881 | 2385.32 | 774 | 754 | 186.2 |
| D | 14 | 34 | 300181 | 1608.16 | 774 | 754 | 186.2 |
| D | 1 | 20 | 199970 | 1069.95 | 774 | 754 | 186.2 |
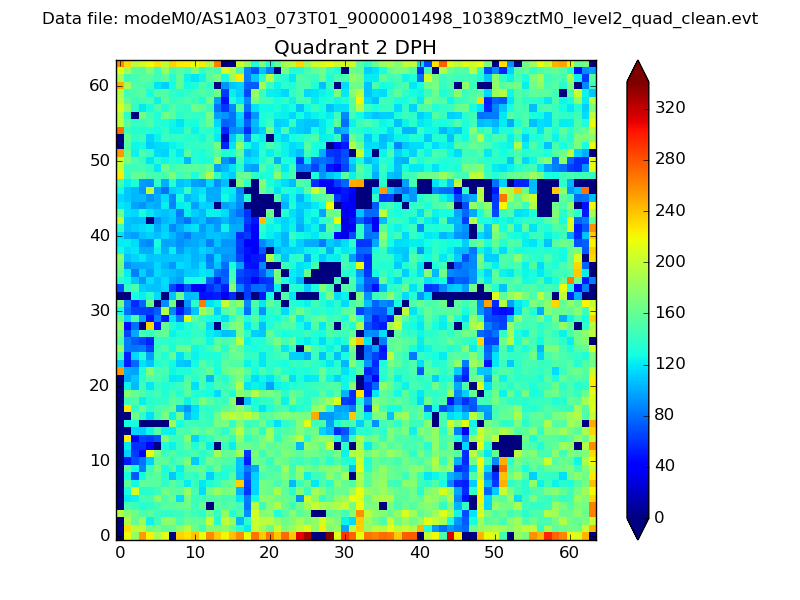
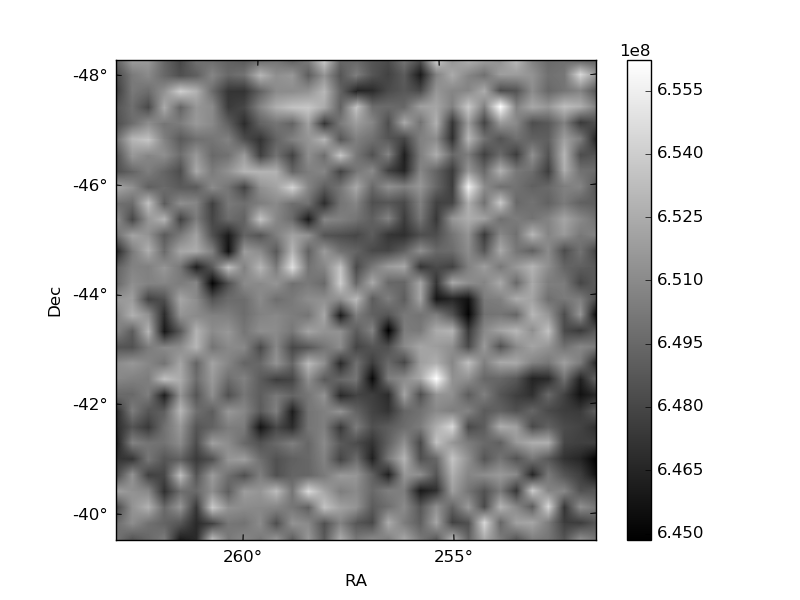
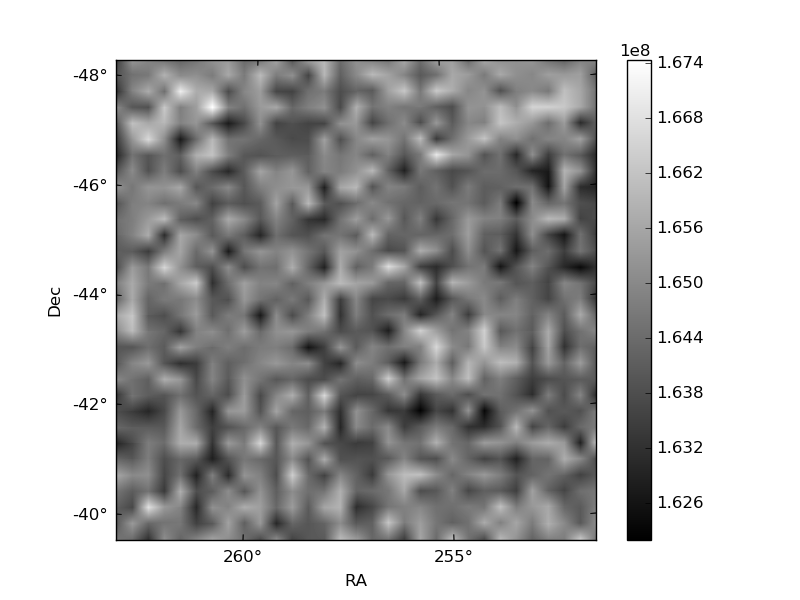
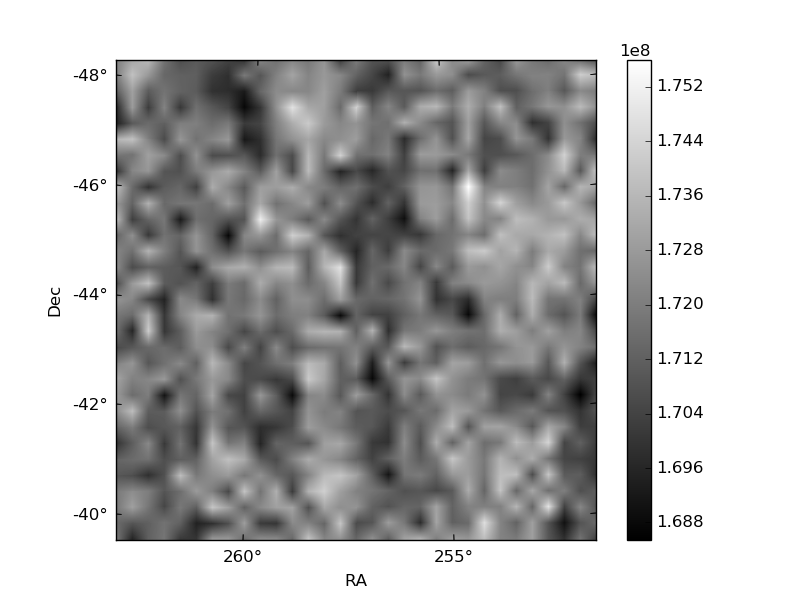
Histogram calculated using DETX and DETY for each event in the final _common_clean file
| Quadrant A | 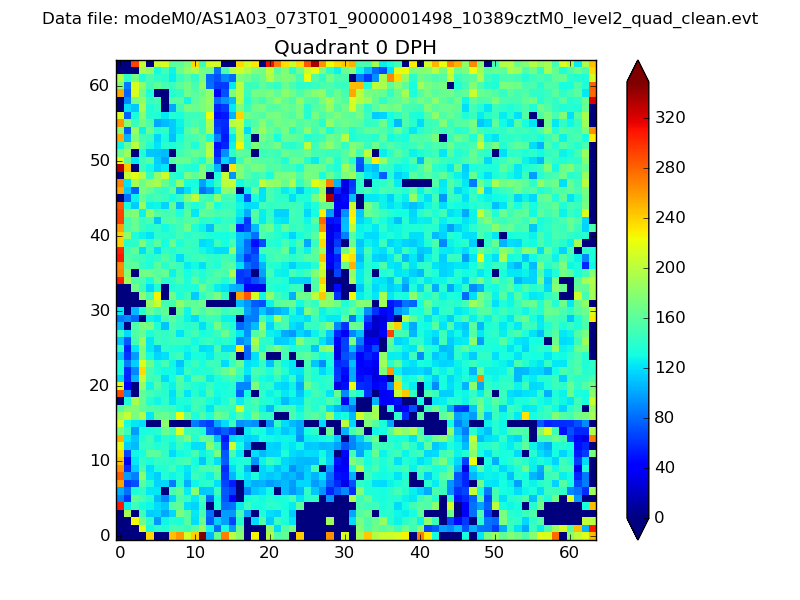 |
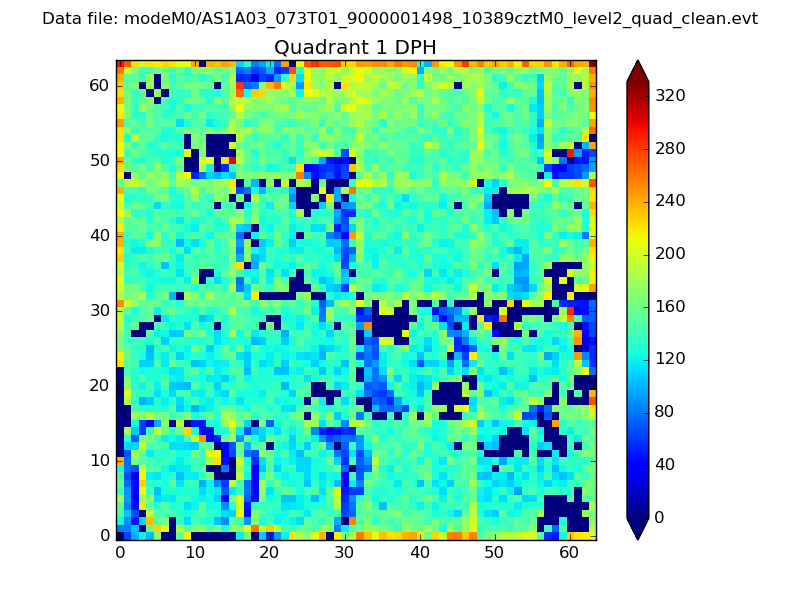 |
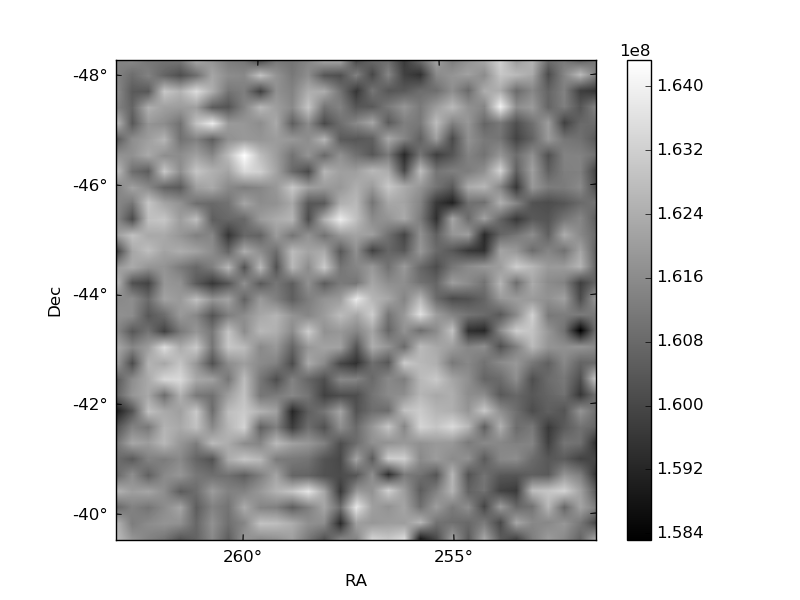
Quadrant B |
|---|---|---|---|
| Quadrant D | 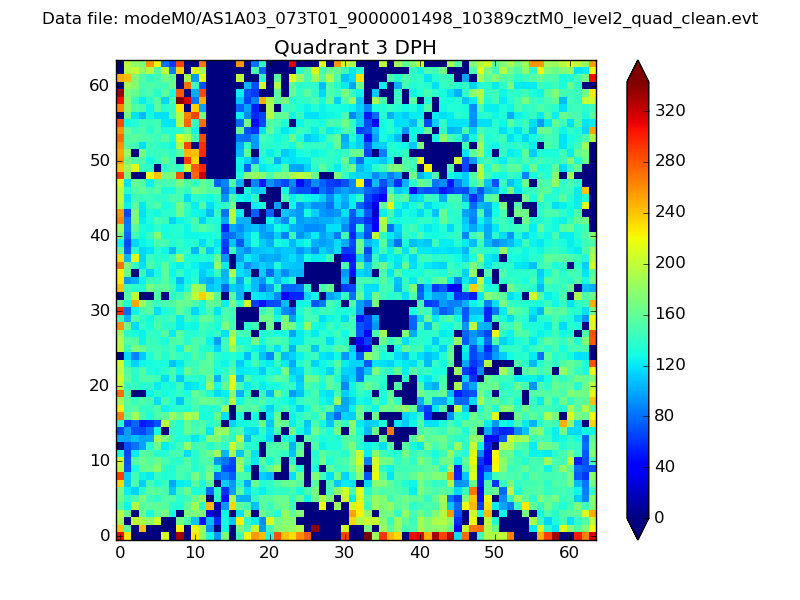 |
 |
Quadrant C |
| Plot type | Count rate plots | Images |
|---|---|---|
| Comparison with Poisson distribution Blue bars denote a histogram of data divided into 1 sec bins. Red curve is a Poisson curve with rate = median count rate of data. |
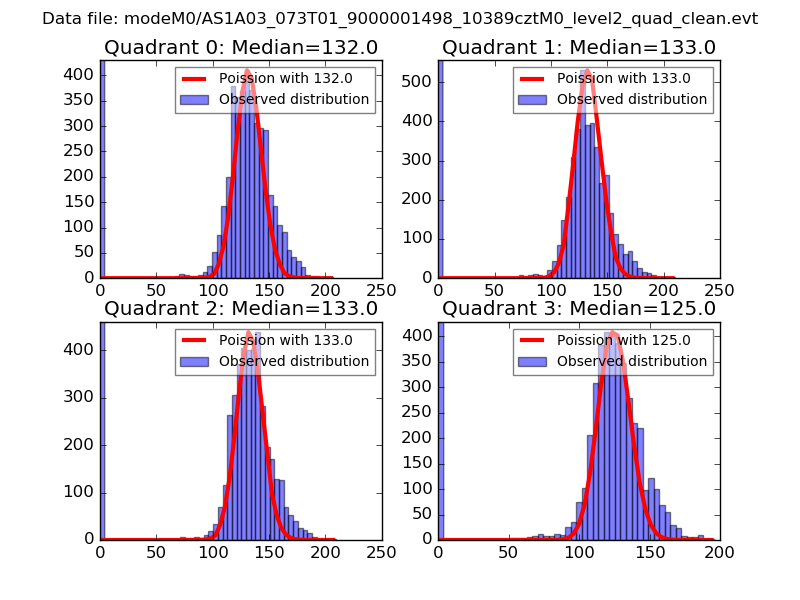 |
 |
| Quadrant-wise count rates Data is divided into 100 sec bins |
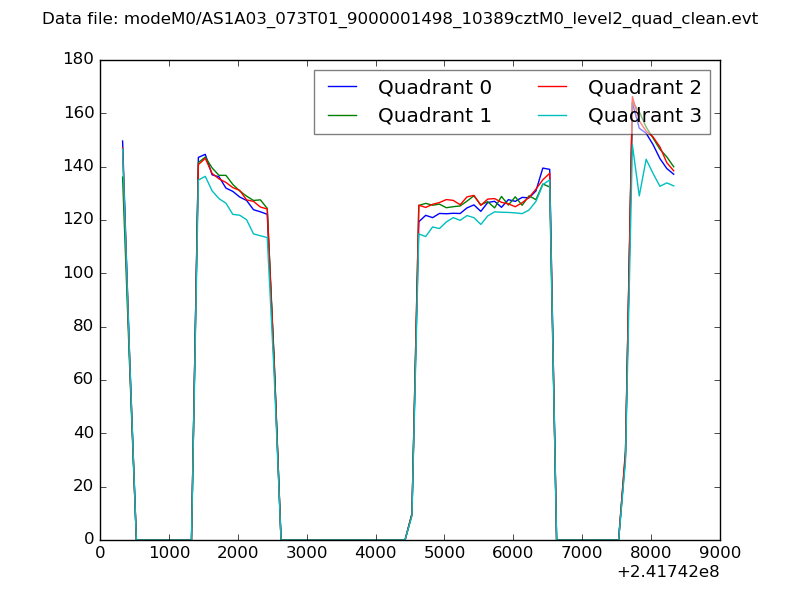 |
|
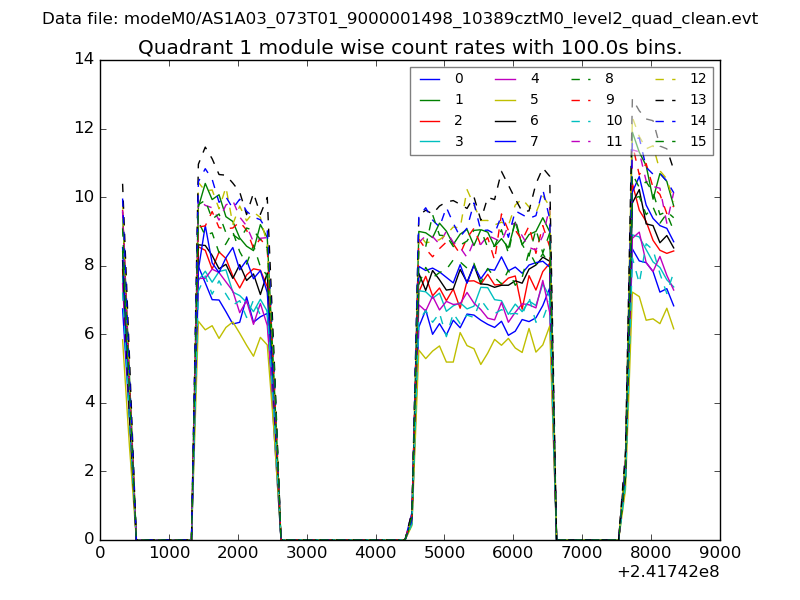
| Module-wise count rates for Quadrant A Data is divided into 100 sec bins |
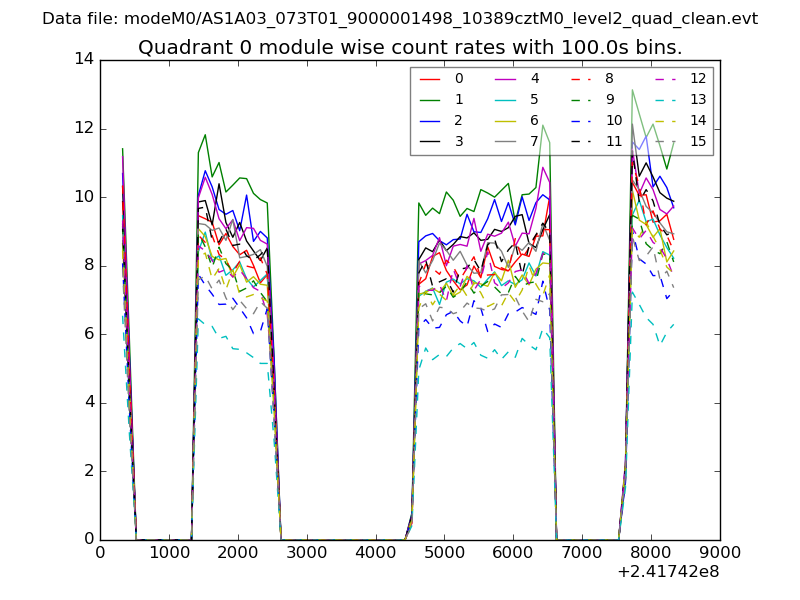 |
 |
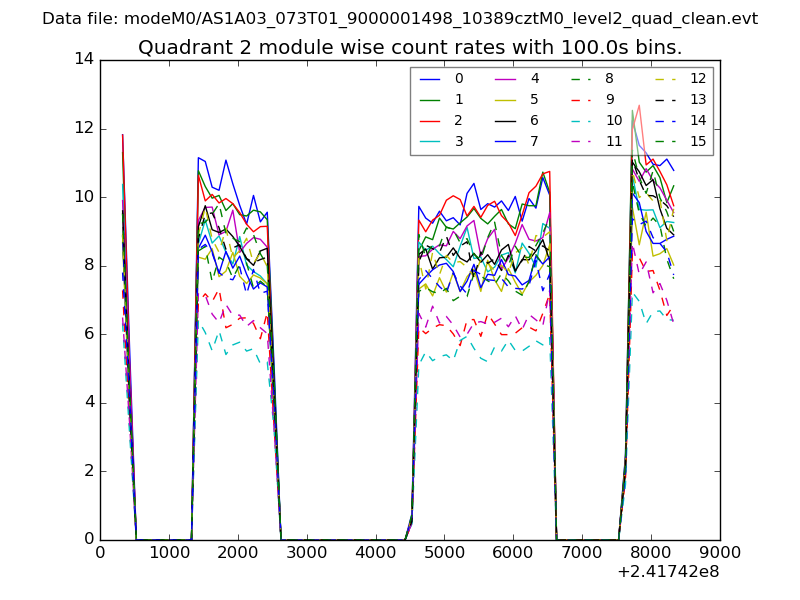
| Module-wise count rates for Quadrant B Data is divided into 100 sec bins |
 |
 |
| Module-wise count rates for Quadrant C Data is divided into 100 sec bins |
 |
 |
| Module-wise count rates for Quadrant D Data is divided into 100 sec bins |
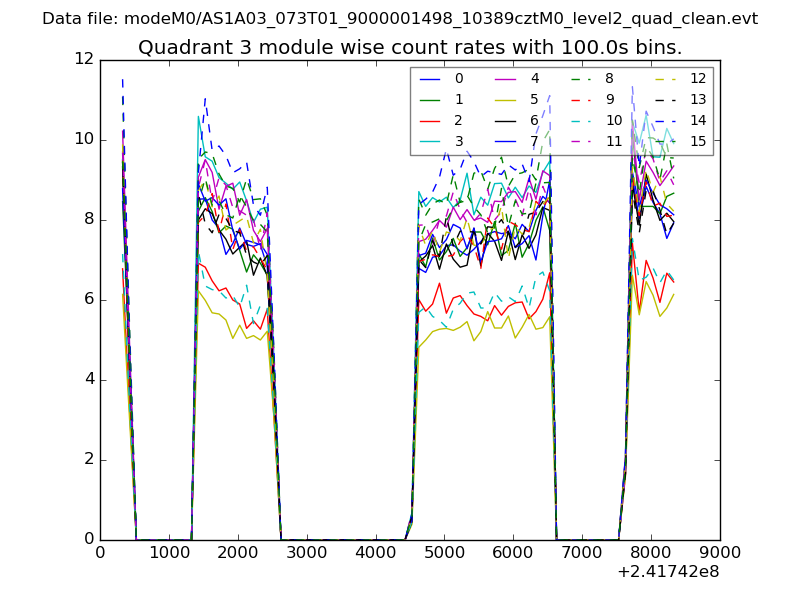 |
 |
| Parameter | Plot |
|---|---|
| CZT HV Monitor | 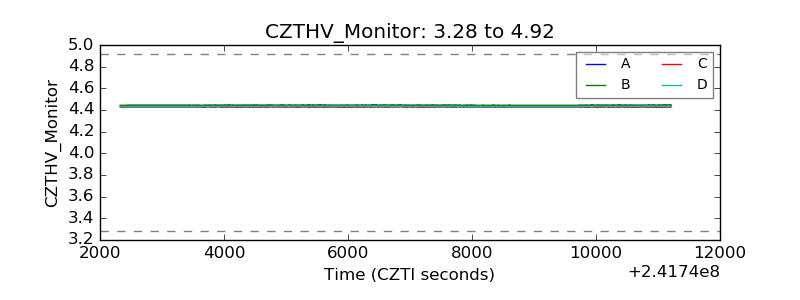 |
| D_VDD | 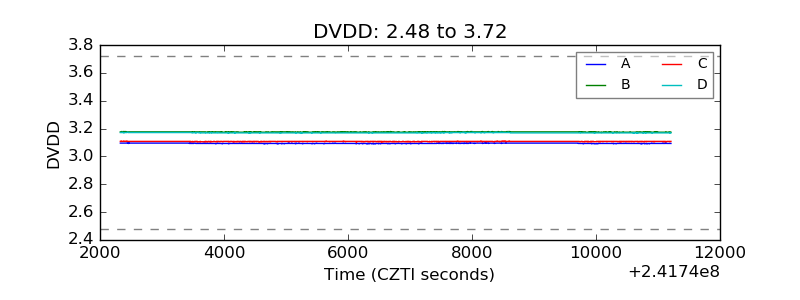 |
| Temperature 1 | 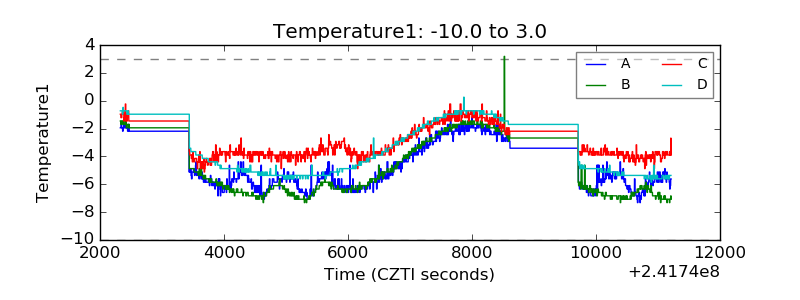 |
| Veto HV Monitor | 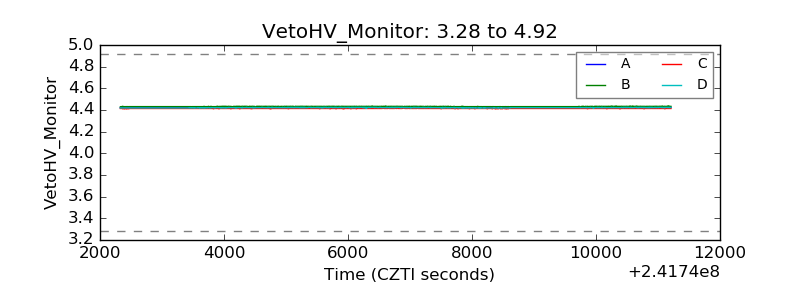 |
| Veto LLD | 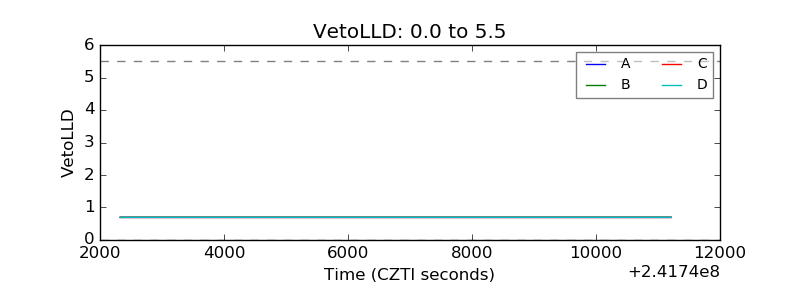 |
| Alpha Counter | 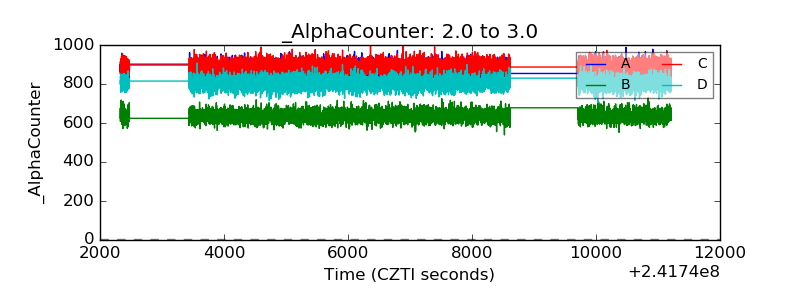 |
| _CPM_Rate | 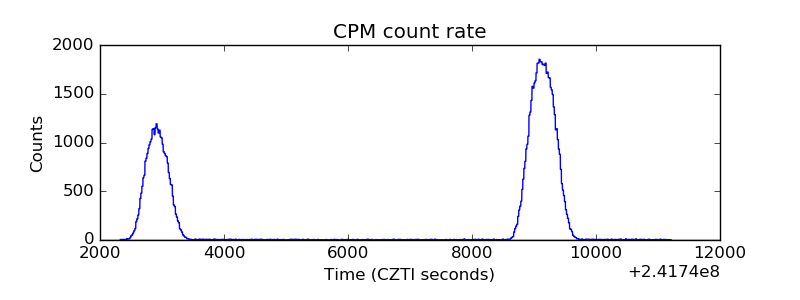 |
| CZT Counter | 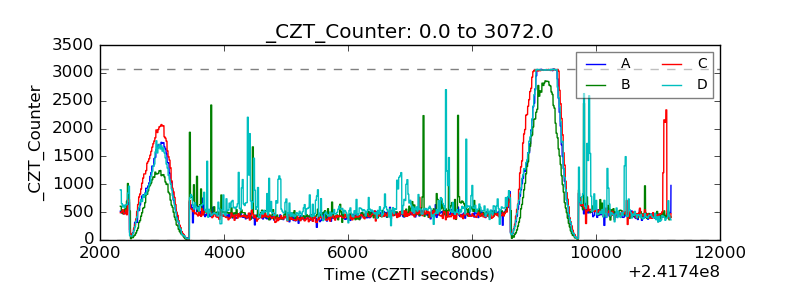 |
| +2.5 Volts monitor |  |
| +5 Volts monitor |  |
| _ROLL_ROT | 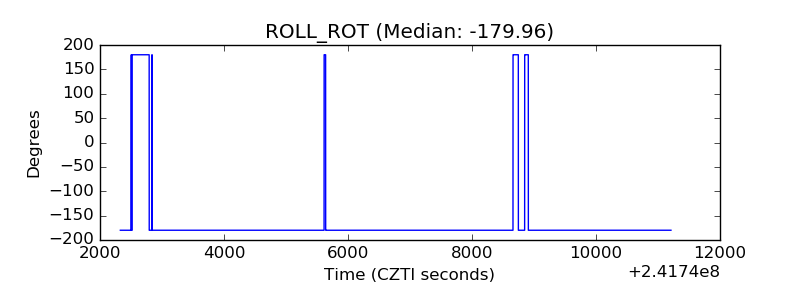 |
| _Roll_DEC | 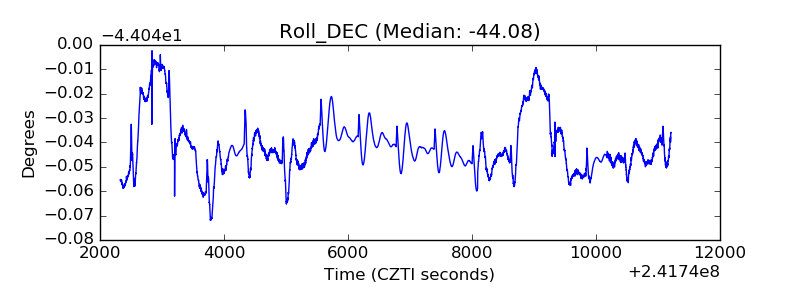 |
| _Roll_RA | 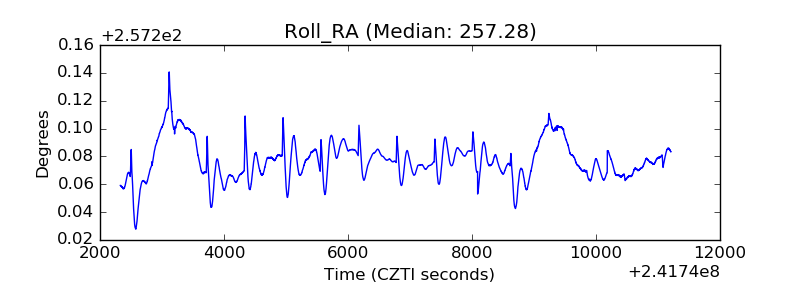 |
| Veto Counter | 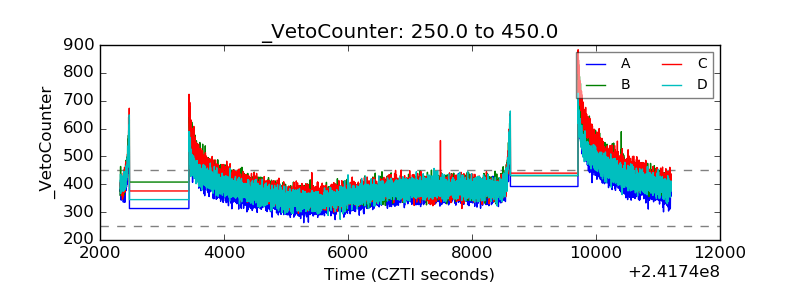 |