| Param | Original file | Final file |
|---|---|---|
| Filename | modeM0/AS1G07_028T01_9000001500cztM0_level2.fits | modeM0/AS1G07_028T01_9000001500cztM0_level2_quad_clean.evt |
| Size (bytes) | 225,941,760 | 196,764,480 |
| Size | 215.5 MB | 187.6 MB |
| Events in quadrant A | 1,425,908 | 1,166,075 |
| Events in quadrant B | 1,367,292 | 1,190,721 |
| Events in quadrant C | 1,364,906 | 1,102,781 |
| Events in quadrant D | 1,174,208 | 988,046 |
| Mode M0 | |||
|---|---|---|---|
| Quadrant | BADHDUFLAG | Total packets | Discarded packets |
| A | 0 | 45925 | 0 |
| B | 0 | 51346 | 0 |
| C | 0 | 45777 | 0 |
| D | 0 | 54749 | 0 |
| Mode SS | |||
|---|---|---|---|
| Quadrant | BADHDUFLAG | Total packets | Discarded packets |
| A | 0 | 448 | 0 |
| B | 0 | 448 | 0 |
| C | 0 | 448 | 0 |
| D | 0 | 448 | 0 |
| Mode M9 | |||
|---|---|---|---|
| Quadrant | BADHDUFLAG | Total packets | Discarded packets |
| A | 0 | 56 | 0 |
| B | 0 | 56 | 0 |
| C | 0 | 56 | 0 |
| D | 0 | 56 | 0 |
| Quadrant | Total seconds | Saturated seconds | Saturation percentage |
|---|---|---|---|
| A | 21941 | 269 | 1.226015% |
| B | 21941 | 542 | 2.470261% |
| C | 21941 | 203 | 0.925209% |
| D | 21941 | 589 | 2.684472% |
Noise dominated data is calculated using 1-second bins in cleaned event files. If a bin has >2000 counts, and if more than 50% of those come from <1% of pixels, then it is considered to be noise-dominated and hence unusable.
| Quadrant | # 1 sec bins | Bins with >0 counts | Bins with >2000 counts | High rate bins dominated by noise | Noise dominated (total time) | Noise dominated (detector-on time) | Marked lightcurve |
|---|---|---|---|---|---|---|---|
| A | 26941 | 21938 | 0 | 0 | 0.00% | 0.00% | 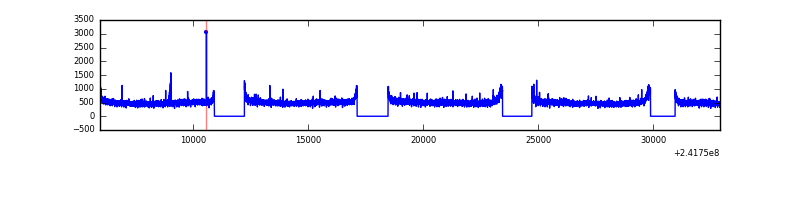 |
| B | 26941 | 21936 | 0 | 0 | 0.00% | 0.00% | 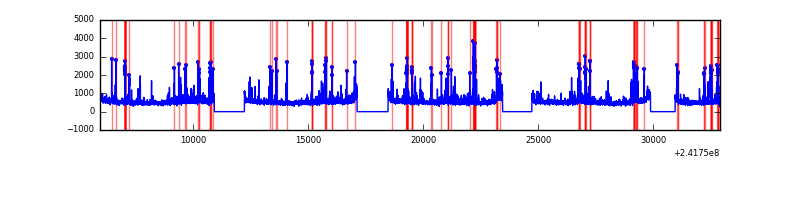 |
| C | 26941 | 21939 | 0 | 0 | 0.00% | 0.00% |  |
| D | 26941 | 21936 | 0 | 0 | 0.00% | 0.00% |  |
Top three noisy pixels from each quadrant. If the there are fewer than three noisy pixels in the level2.evt file, extra rows are filled as -1
| Pixel properties | Quadrant properties | ||||||
|---|---|---|---|---|---|---|---|
| Quadrant | DetID | PixID | Counts | Sigma | Mean | Median | Sigma |
| A | 0 | 29 | 1338 | 10.79 | 370 | 348 | 91.7 |
| A | 7 | 110 | 1176 | 9.02 | 370 | 348 | 91.7 |
| A | 9 | 19 | 1083 | 8.01 | 370 | 348 | 91.7 |
| B | 2 | 9 | 1057 | 9.56 | 362 | 347 | 74.2 |
| B | 5 | 128 | 970 | 8.39 | 362 | 347 | 74.2 |
| B | 12 | 226 | 888 | 7.29 | 362 | 347 | 74.2 |
| C | 1 | 81 | 1015 | 7.17 | 360 | 338 | 94.4 |
| C | 1 | 80 | 945 | 6.43 | 360 | 338 | 94.4 |
| C | 9 | 188 | 926 | 6.23 | 360 | 338 | 94.4 |
| D | 6 | 231 | 886 | 6.44 | 335 | 306 | 90.1 |
| D | 7 | 3 | 838 | 5.91 | 335 | 306 | 90.1 |
| D | 6 | 67 | 834 | 5.86 | 335 | 306 | 90.1 |
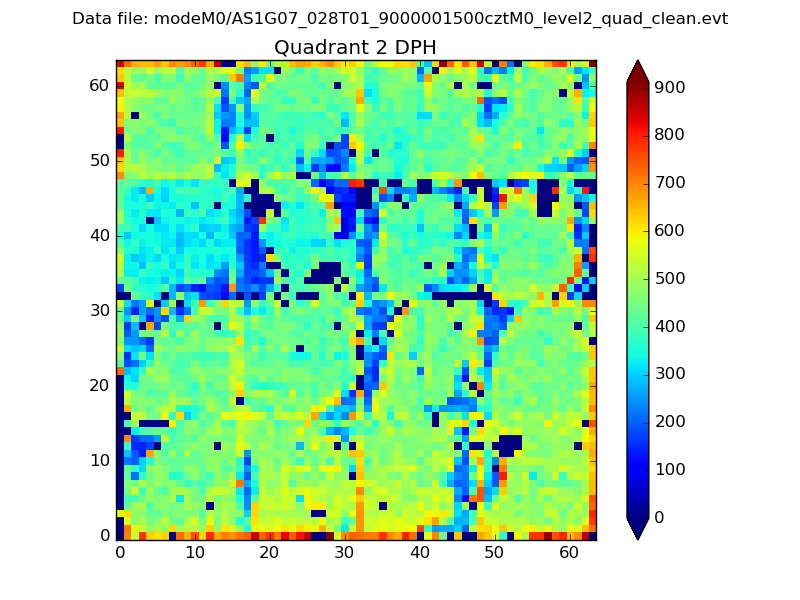
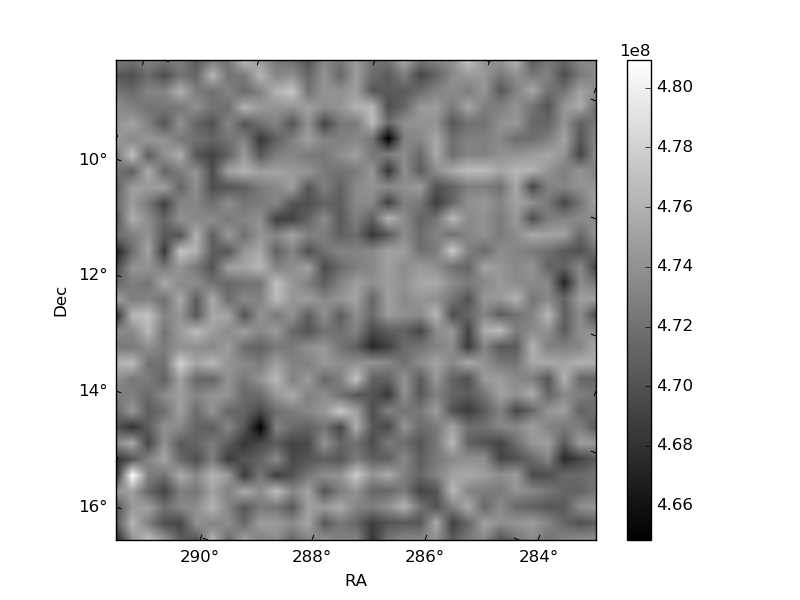
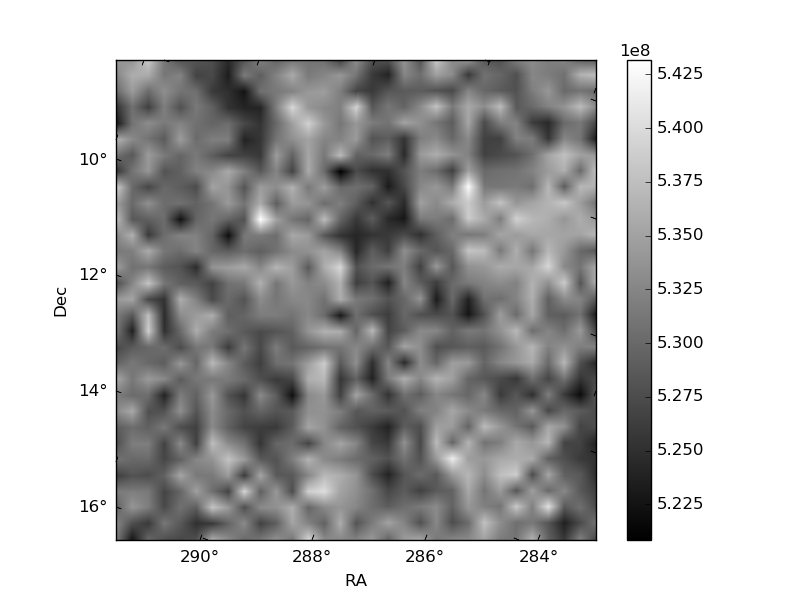
Histogram calculated using DETX and DETY for each event in the final _common_clean file
| Quadrant A | 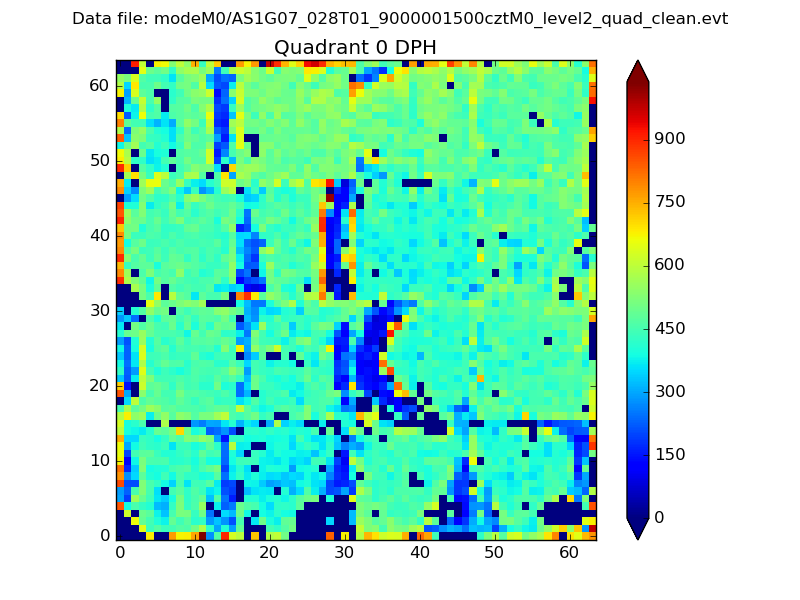 |
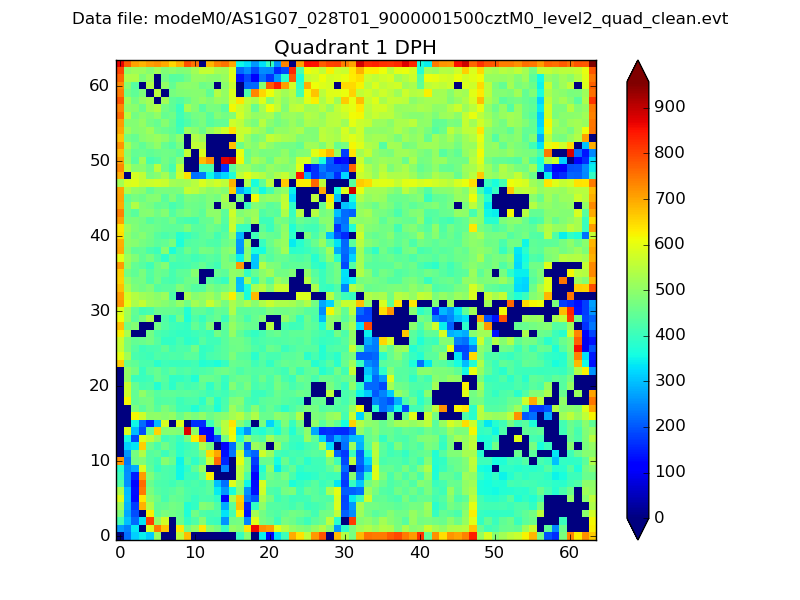 |
Quadrant B |
|---|---|---|---|
| Quadrant D | 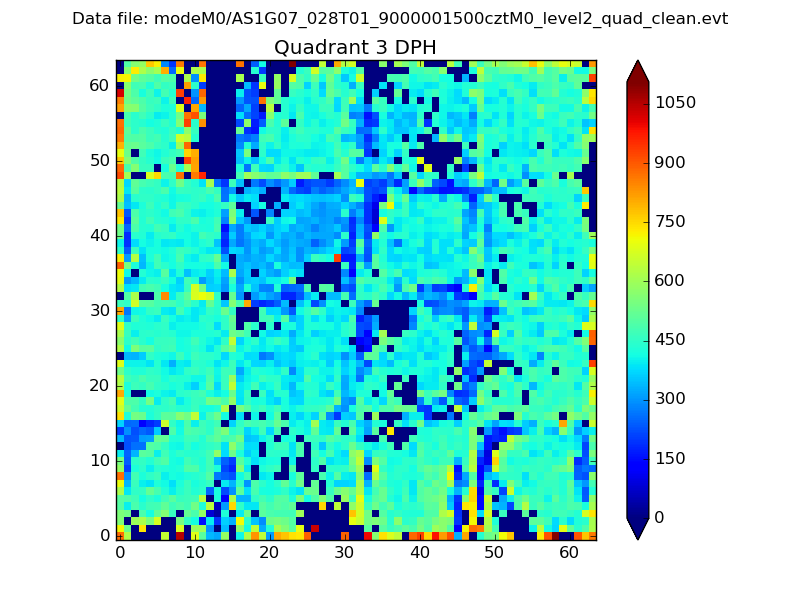 |
 |
Quadrant C |
| Plot type | Count rate plots | Images |
|---|---|---|
| Comparison with Poisson distribution Blue bars denote a histogram of data divided into 1 sec bins. Red curve is a Poisson curve with rate = median count rate of data. |
 |
 |
| Quadrant-wise count rates Data is divided into 100 sec bins |
 |
|
| Module-wise count rates for Quadrant A Data is divided into 100 sec bins |
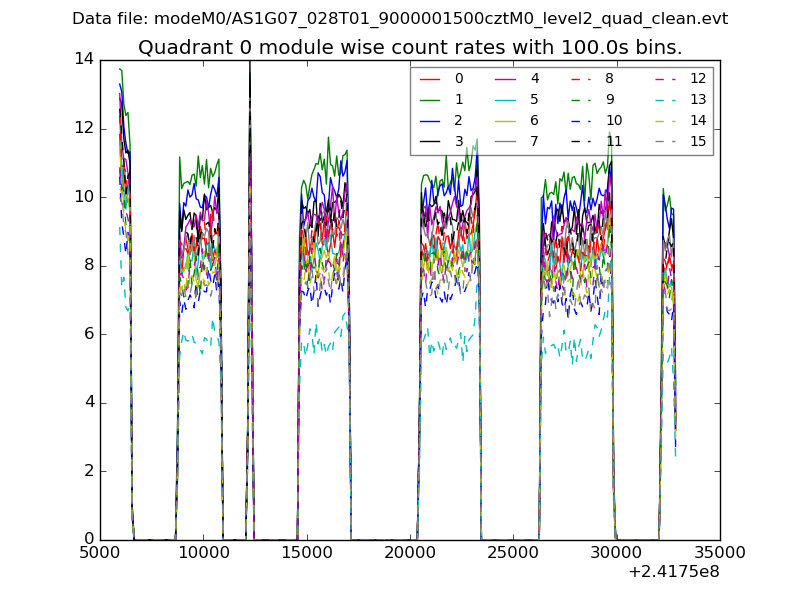 |
 |
| Module-wise count rates for Quadrant B Data is divided into 100 sec bins |
 |
 |
| Module-wise count rates for Quadrant C Data is divided into 100 sec bins |
 |
 |
| Module-wise count rates for Quadrant D Data is divided into 100 sec bins |
 |
 |
| Parameter | Plot |
|---|---|
| CZT HV Monitor | 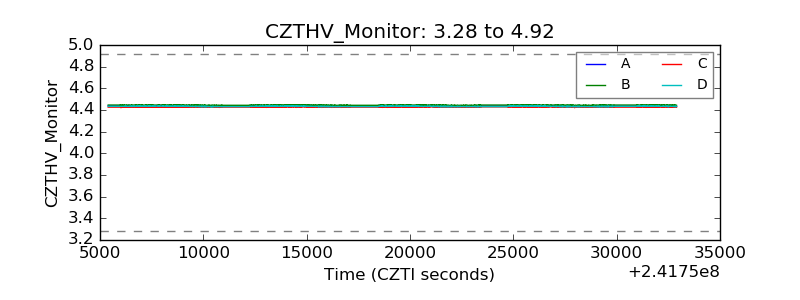 |
| D_VDD | 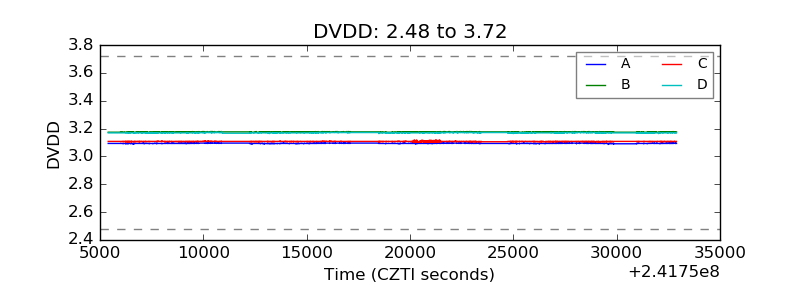 |
| Temperature 1 |  |
| Veto HV Monitor | 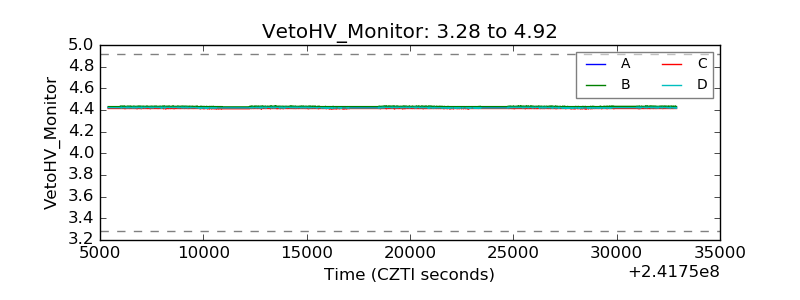 |
| Veto LLD |  |
| Alpha Counter | 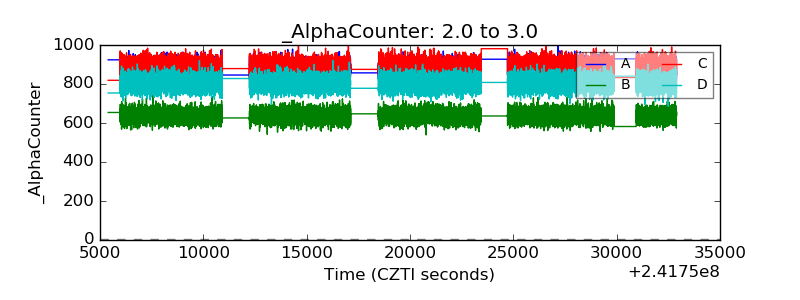 |
| _CPM_Rate |  |
| CZT Counter |  |
| +2.5 Volts monitor | 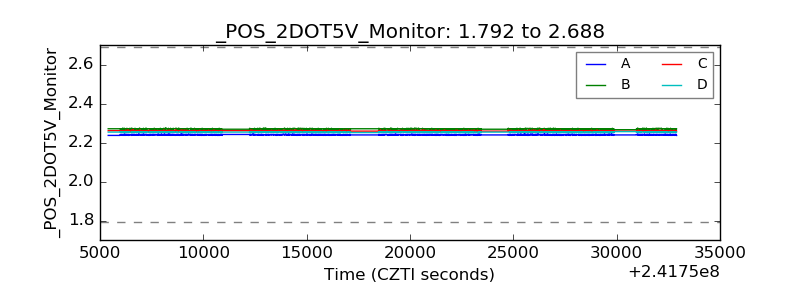 |
| +5 Volts monitor |  |
| _ROLL_ROT | 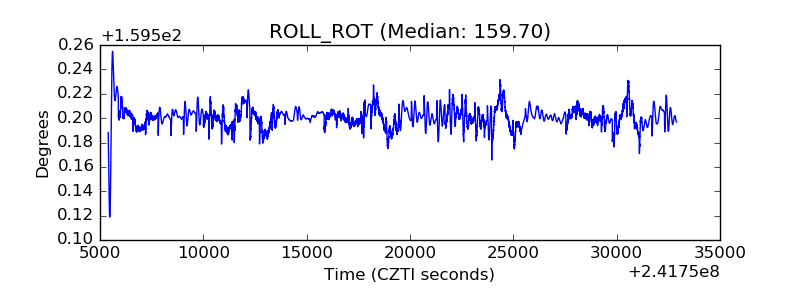 |
| _Roll_DEC |  |
| _Roll_RA | 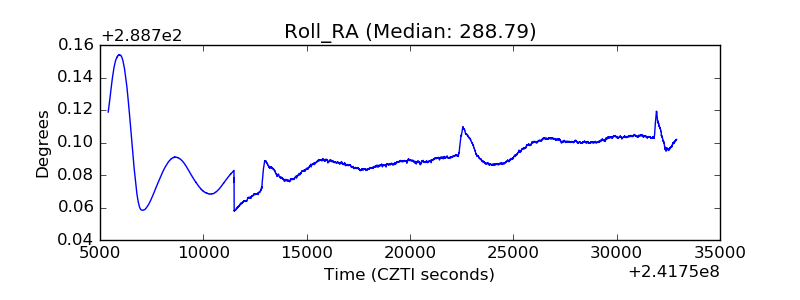 |
| Veto Counter |  |