| Param | Original file | Final file |
|---|---|---|
| Filename | modeM0/AS1G07_028T01_9000001500_10392cztM0_level2.evt | modeM0/AS1G07_028T01_9000001500_10392cztM0_level2_quad_clean.evt |
| Size (bytes) | 472,426,560 | 62,979,840 |
| Size | 450.5 MB | 60.1 MB |
| Events in quadrant A | 3,259,921 | 372,973 |
| Events in quadrant B | 3,705,782 | 384,648 |
| Events in quadrant C | 3,196,620 | 365,411 |
| Events in quadrant D | 3,718,664 | 345,097 |
| Mode M0 | |||
|---|---|---|---|
| Quadrant | BADHDUFLAG | Total packets | Discarded packets |
| A | 0 | 13218 | 3 |
| B | 0 | 14873 | 2 |
| C | 0 | 13253 | 2 |
| D | 0 | 15032 | 2 |
| Mode SS | |||
|---|---|---|---|
| Quadrant | BADHDUFLAG | Total packets | Discarded packets |
| A | 0 | 128 | 0 |
| B | 0 | 128 | 0 |
| C | 0 | 128 | 0 |
| D | 0 | 128 | 0 |
| Mode M9 | |||
|---|---|---|---|
| Quadrant | BADHDUFLAG | Total packets | Discarded packets |
| A | 0 | 17 | 0 |
| B | 0 | 17 | 0 |
| C | 0 | 17 | 0 |
| D | 0 | 18 | 0 |
| Quadrant | Total seconds | Saturated seconds | Saturation percentage |
|---|---|---|---|
| A | 6282 | 39 | 0.620821% |
| B | 6282 | 107 | 1.703279% |
| C | 6282 | 33 | 0.525310% |
| D | 6282 | 41 | 0.652658% |
Noise dominated data is calculated using 1-second bins in cleaned event files. If a bin has >2000 counts, and if more than 50% of those come from <1% of pixels, then it is considered to be noise-dominated and hence unusable.
| Quadrant | # 1 sec bins | Bins with >0 counts | Bins with >2000 counts | High rate bins dominated by noise | Noise dominated (total time) | Noise dominated (detector-on time) | Marked lightcurve |
|---|---|---|---|---|---|---|---|
| A | 7628 | 6283 | 0 | 0 | 0.00% | 0.00% | 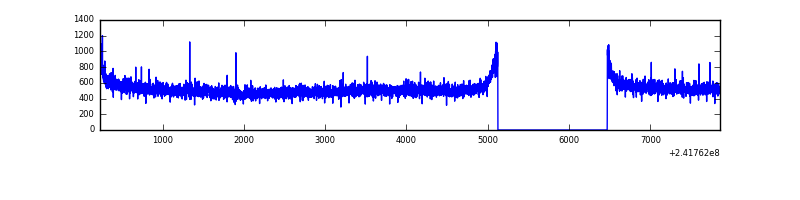 |
| B | 7628 | 6283 | 35 | 35 | 0.46% | 0.56% | 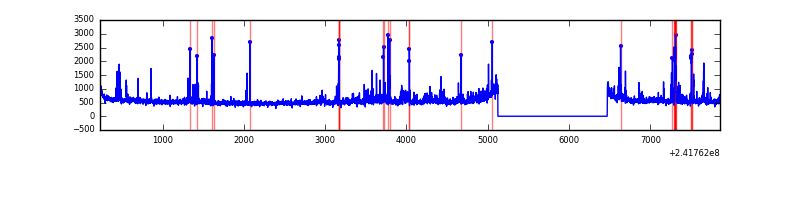 |
| C | 7628 | 6283 | 18 | 18 | 0.24% | 0.29% | 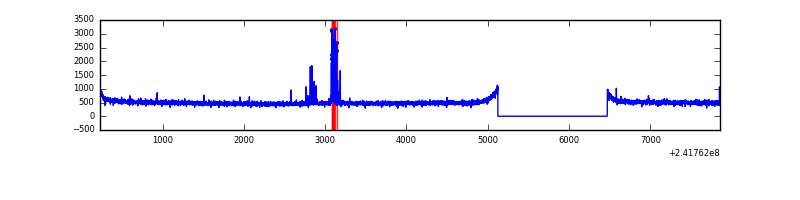 |
| D | 7628 | 6283 | 22 | 22 | 0.29% | 0.35% | 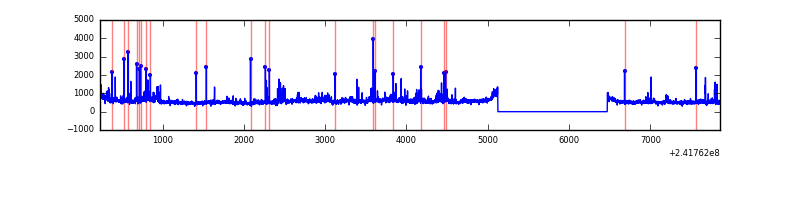 |
Top three noisy pixels from each quadrant. If the there are fewer than three noisy pixels in the level2.evt file, extra rows are filled as -1
| Pixel properties | Quadrant properties | ||||||
|---|---|---|---|---|---|---|---|
| Quadrant | DetID | PixID | Counts | Sigma | Mean | Median | Sigma |
| A | 8 | 15 | 39523 | 232.13 | 831 | 816 | 166.7 |
| A | 0 | 226 | 7551 | 40.39 | 831 | 816 | 166.7 |
| A | 12 | 194 | 6578 | 34.56 | 831 | 816 | 166.7 |
| B | 4 | 239 | 228737 | 1451.84 | 836 | 820 | 157.0 |
| B | 0 | 214 | 87645 | 553.08 | 836 | 820 | 157.0 |
| B | 11 | 51 | 64739 | 407.17 | 836 | 820 | 157.0 |
| C | 14 | 234 | 93868 | 505.05 | 795 | 799 | 184.3 |
| C | 13 | 61 | 6055 | 28.52 | 795 | 799 | 184.3 |
| C | 0 | 207 | 3223 | 13.15 | 795 | 799 | 184.3 |
| D | 1 | 20 | 312353 | 1678.78 | 783 | 763 | 185.6 |
| D | 8 | 195 | 264616 | 1421.59 | 783 | 763 | 185.6 |
| D | 13 | 105 | 86065 | 459.59 | 783 | 763 | 185.6 |
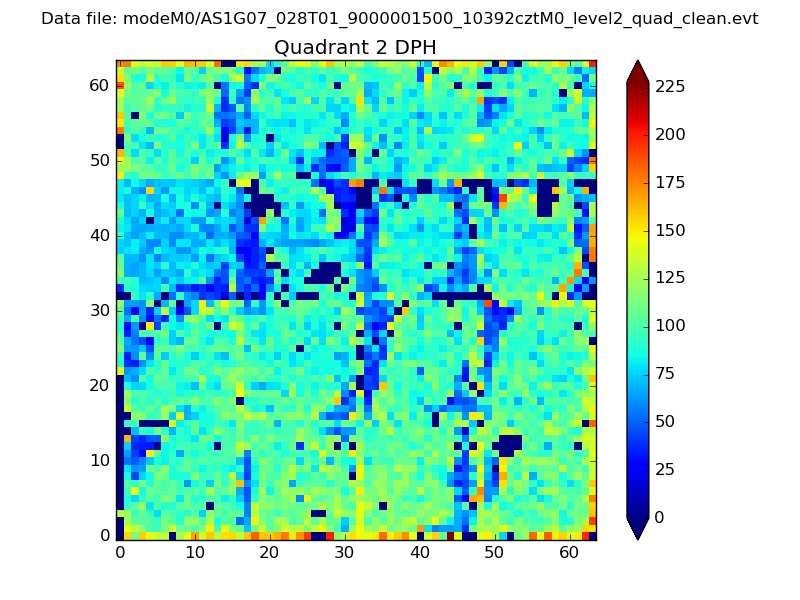
Histogram calculated using DETX and DETY for each event in the final _common_clean file
| Quadrant A | 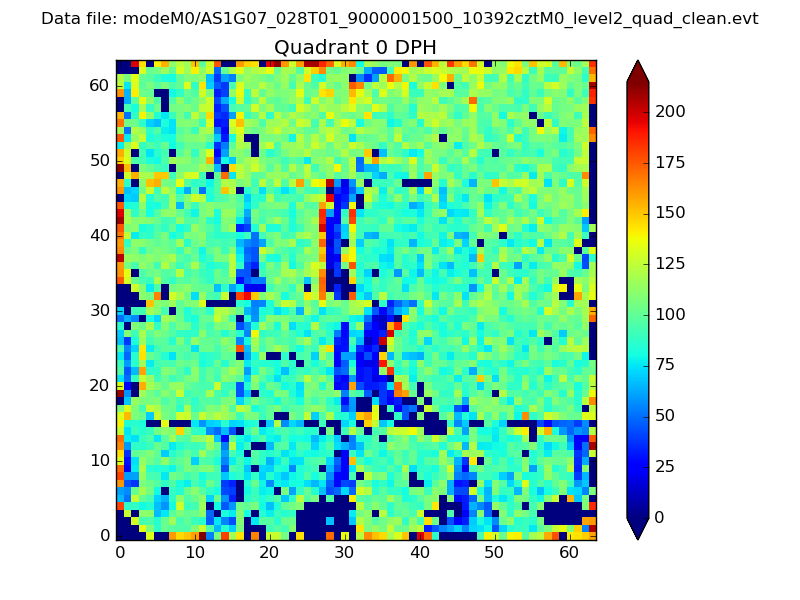 |
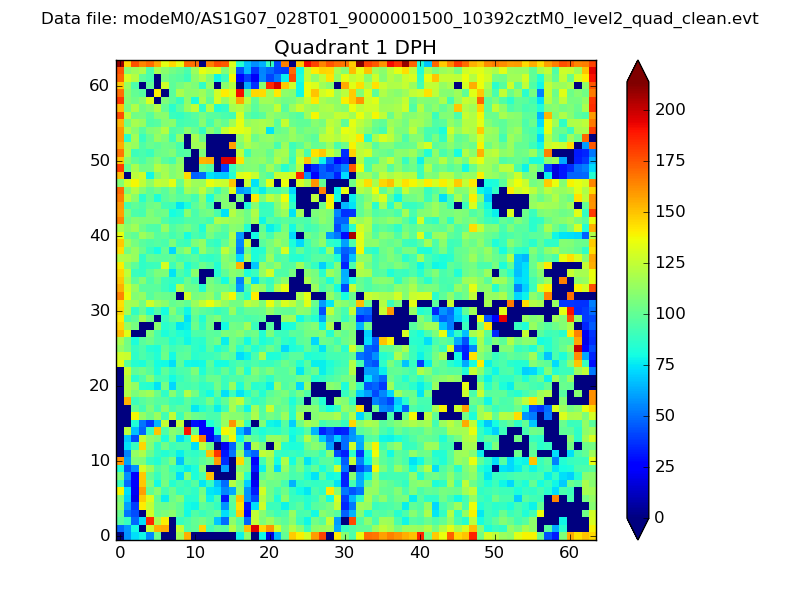 |
Quadrant B |
|---|---|---|---|
| Quadrant D | 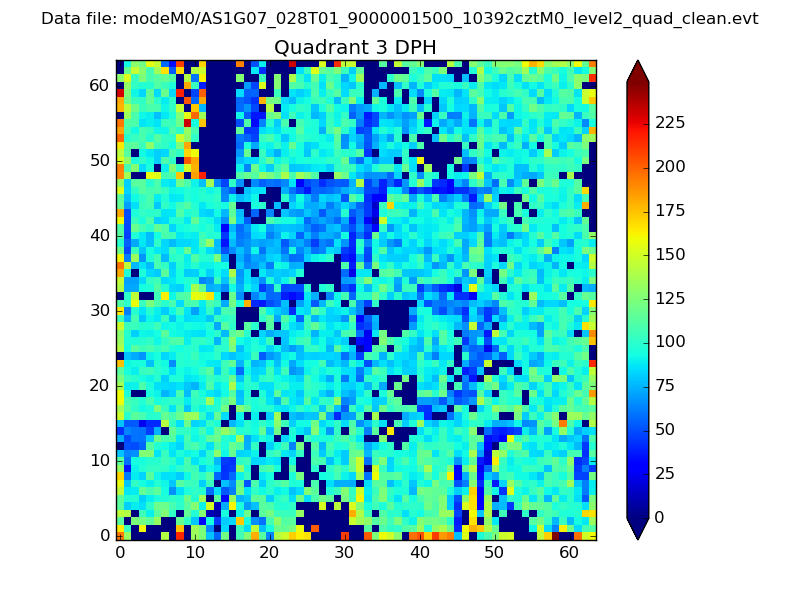 |
 |
Quadrant C |
| Plot type | Count rate plots | Images |
|---|---|---|
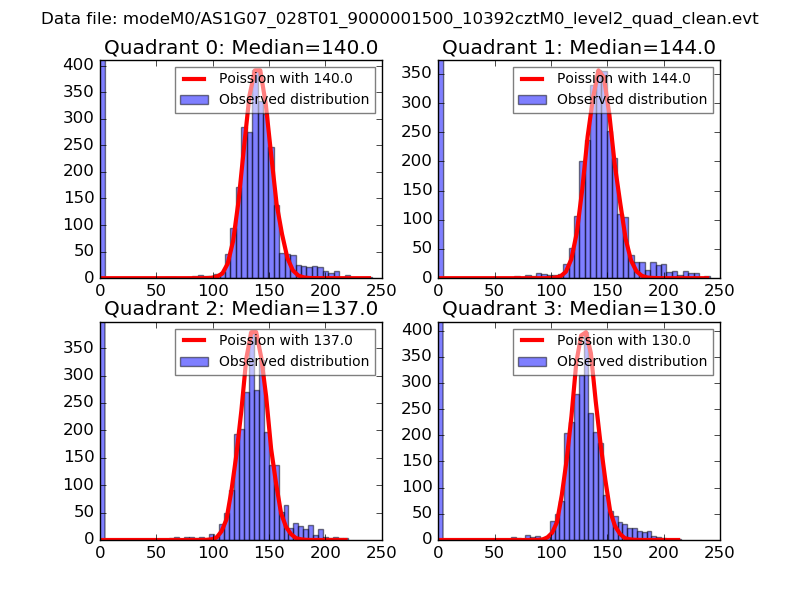
| Comparison with Poisson distribution Blue bars denote a histogram of data divided into 1 sec bins. Red curve is a Poisson curve with rate = median count rate of data. |
 |
 |
| Quadrant-wise count rates Data is divided into 100 sec bins |
 |
|
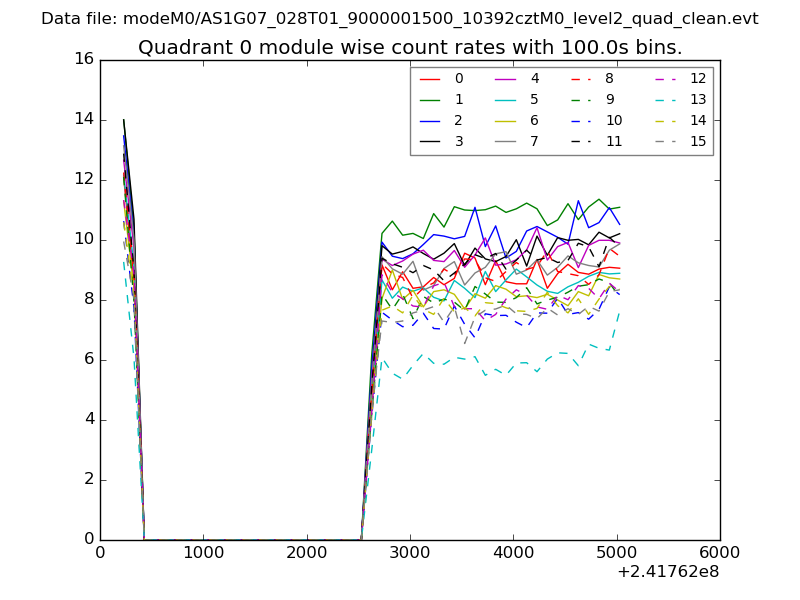
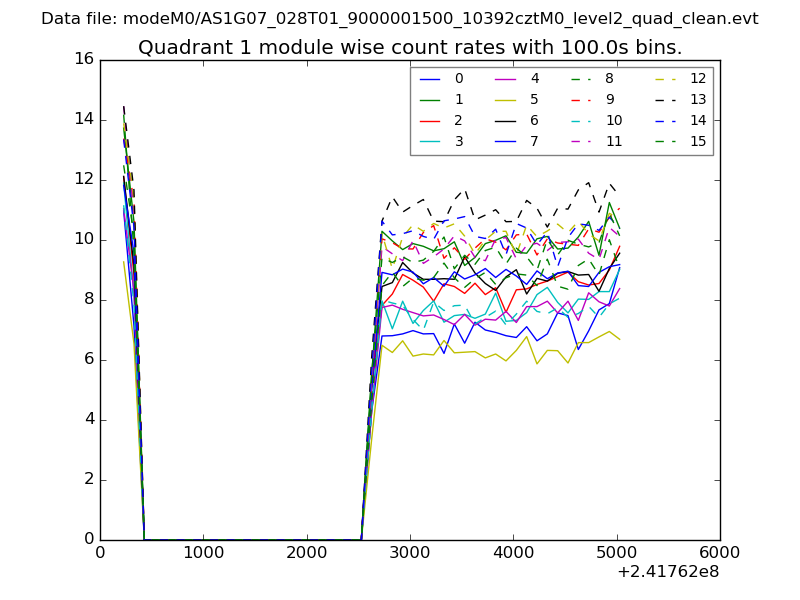
| Module-wise count rates for Quadrant A Data is divided into 100 sec bins |
 |
 |
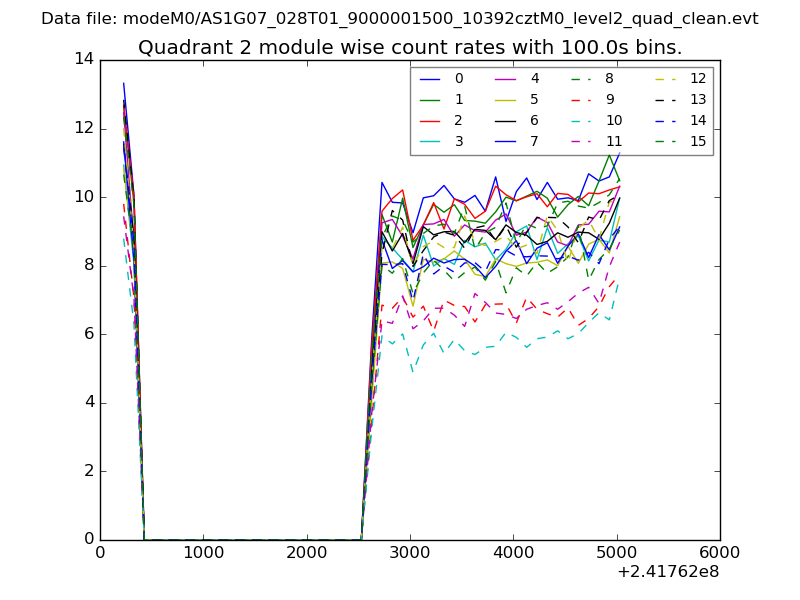
| Module-wise count rates for Quadrant B Data is divided into 100 sec bins |
 |
 |
| Module-wise count rates for Quadrant C Data is divided into 100 sec bins |
 |
 |
| Module-wise count rates for Quadrant D Data is divided into 100 sec bins |
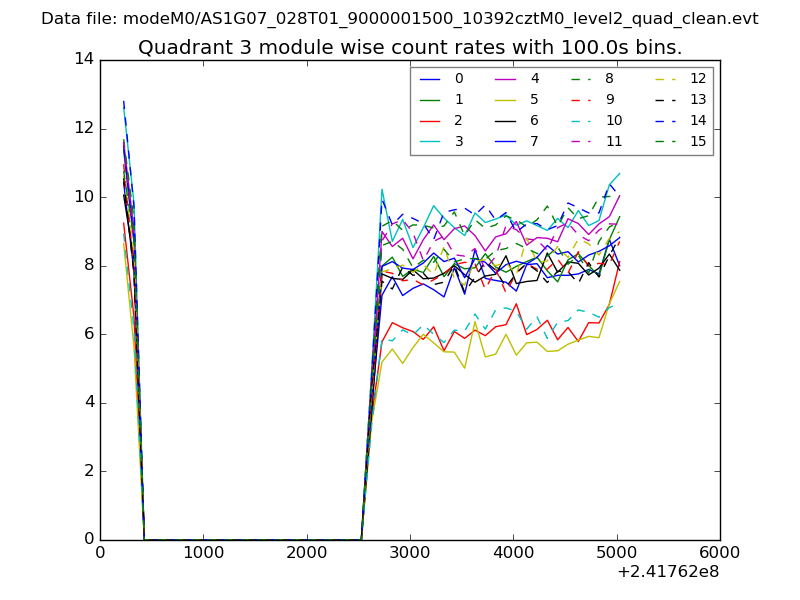 |
 |
| Parameter | Plot |
|---|---|
| CZT HV Monitor | 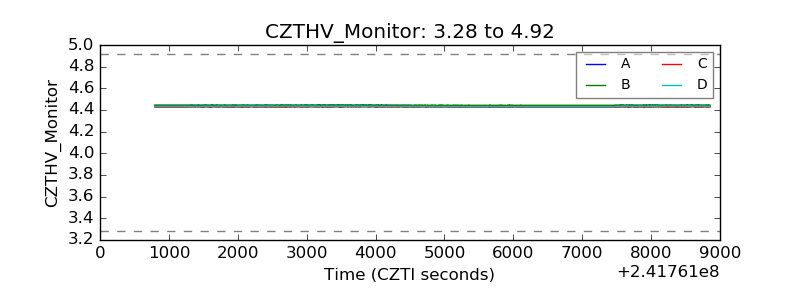 |
| D_VDD | 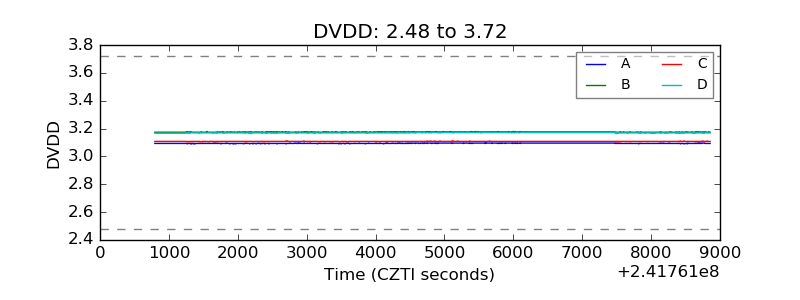 |
| Temperature 1 | 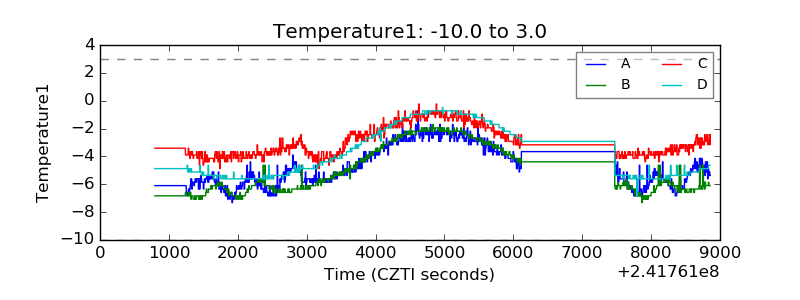 |
| Veto HV Monitor | 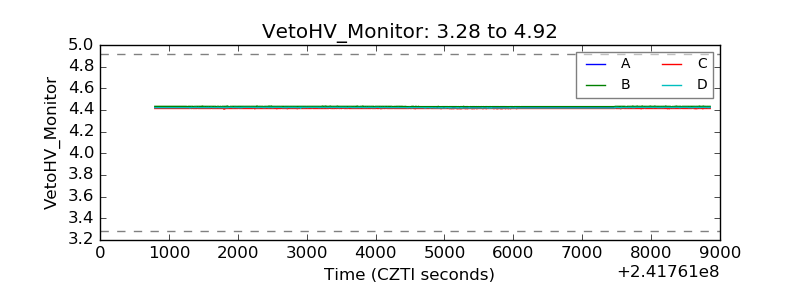 |
| Veto LLD | 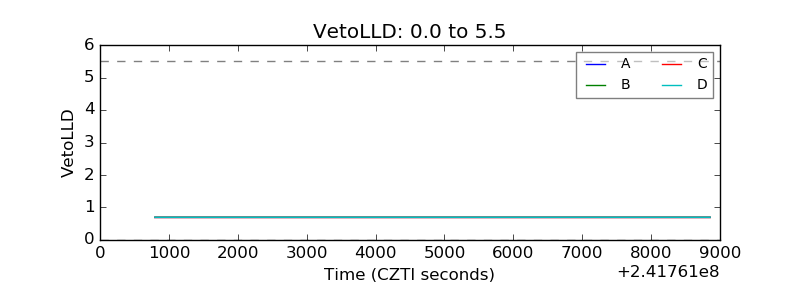 |
| Alpha Counter |  |
| _CPM_Rate | 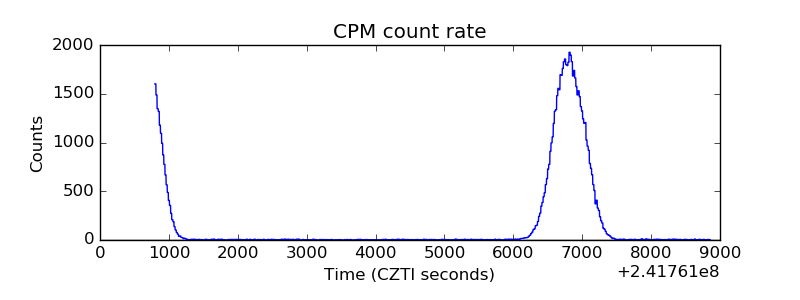 |
| CZT Counter |  |
| +2.5 Volts monitor |  |
| +5 Volts monitor |  |
| _ROLL_ROT | 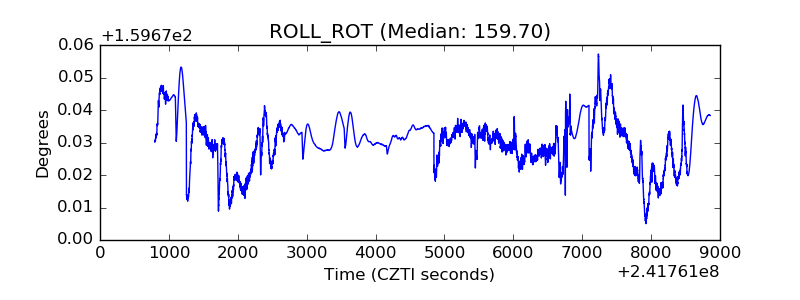 |
| _Roll_DEC | 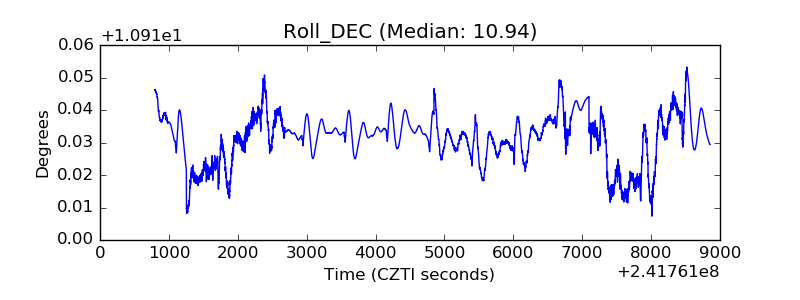 |
| _Roll_RA | 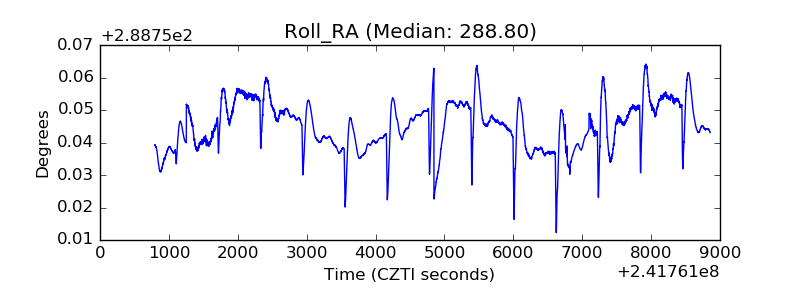 |
| Veto Counter | 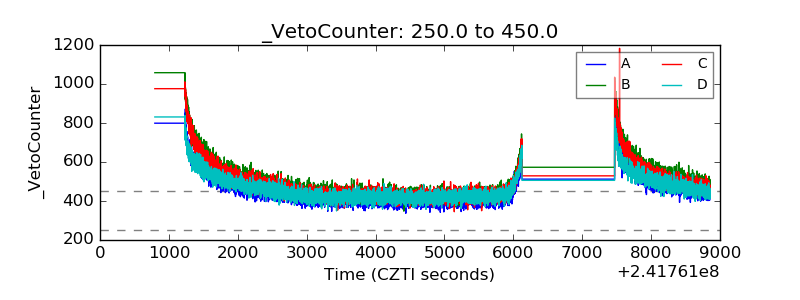 |