| Param | Original file | Final file |
|---|---|---|
| Filename | modeM0/AS1G07_028T01_9000001500_10394cztM0_level2.evt | modeM0/AS1G07_028T01_9000001500_10394cztM0_level2_quad_clean.evt |
| Size (bytes) | 474,641,280 | 77,880,960 |
| Size | 452.7 MB | 74.3 MB |
| Events in quadrant A | 3,271,462 | 482,205 |
| Events in quadrant B | 3,709,870 | 492,833 |
| Events in quadrant C | 3,171,527 | 477,059 |
| Events in quadrant D | 3,778,498 | 451,064 |
| Mode M0 | |||
|---|---|---|---|
| Quadrant | BADHDUFLAG | Total packets | Discarded packets |
| A | 0 | 13652 | 3 |
| B | 0 | 14980 | 2 |
| C | 0 | 13581 | 2 |
| D | 0 | 15271 | 2 |
| Mode SS | |||
|---|---|---|---|
| Quadrant | BADHDUFLAG | Total packets | Discarded packets |
| A | 0 | 132 | 0 |
| B | 0 | 132 | 0 |
| C | 0 | 132 | 0 |
| D | 0 | 132 | 0 |
| Mode M9 | |||
|---|---|---|---|
| Quadrant | BADHDUFLAG | Total packets | Discarded packets |
| A | 0 | 20 | 0 |
| B | 0 | 20 | 0 |
| C | 0 | 20 | 0 |
| D | 0 | 21 | 0 |
| Quadrant | Total seconds | Saturated seconds | Saturation percentage |
|---|---|---|---|
| A | 6525 | 122 | 1.869732% |
| B | 6525 | 181 | 2.773946% |
| C | 6525 | 91 | 1.394636% |
| D | 6525 | 133 | 2.038314% |
Noise dominated data is calculated using 1-second bins in cleaned event files. If a bin has >2000 counts, and if more than 50% of those come from <1% of pixels, then it is considered to be noise-dominated and hence unusable.
| Quadrant | # 1 sec bins | Bins with >0 counts | Bins with >2000 counts | High rate bins dominated by noise | Noise dominated (total time) | Noise dominated (detector-on time) | Marked lightcurve |
|---|---|---|---|---|---|---|---|
| A | 7595 | 6525 | 0 | 0 | 0.00% | 0.00% | 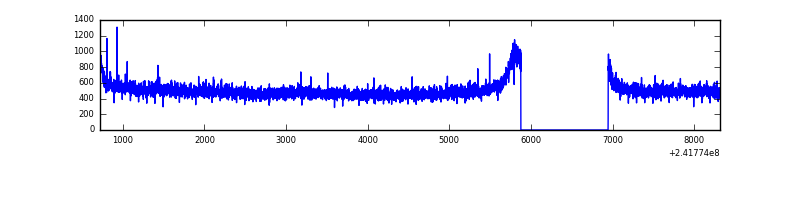 |
| B | 7595 | 6525 | 32 | 32 | 0.42% | 0.49% | 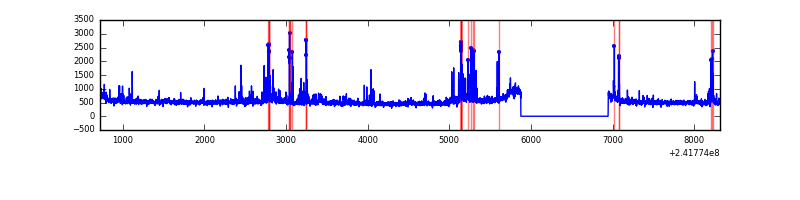 |
| C | 7595 | 6525 | 1 | 1 | 0.01% | 0.02% | 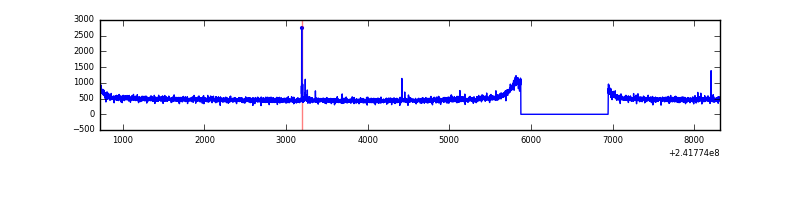 |
| D | 7595 | 6525 | 50 | 50 | 0.66% | 0.77% | 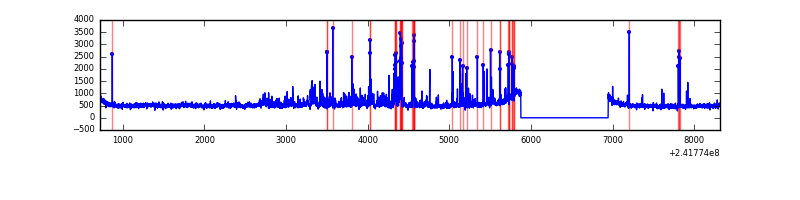 |
Top three noisy pixels from each quadrant. If the there are fewer than three noisy pixels in the level2.evt file, extra rows are filled as -1
| Pixel properties | Quadrant properties | ||||||
|---|---|---|---|---|---|---|---|
| Quadrant | DetID | PixID | Counts | Sigma | Mean | Median | Sigma |
| A | 8 | 15 | 10418 | 55.69 | 841 | 825 | 172.3 |
| A | 1 | 162 | 10046 | 53.53 | 841 | 825 | 172.3 |
| A | 14 | 254 | 8302 | 43.41 | 841 | 825 | 172.3 |
| B | 4 | 239 | 255779 | 1588.26 | 841 | 823 | 160.5 |
| B | 11 | 51 | 63270 | 389.02 | 841 | 823 | 160.5 |
| B | 0 | 187 | 52723 | 323.31 | 841 | 823 | 160.5 |
| C | 14 | 234 | 15935 | 80.6 | 808 | 815 | 187.6 |
| C | 13 | 61 | 5831 | 26.74 | 808 | 815 | 187.6 |
| C | 14 | 67 | 3606 | 14.88 | 808 | 815 | 187.6 |
| D | 1 | 20 | 366626 | 1899.05 | 801 | 781 | 192.6 |
| D | 8 | 195 | 194763 | 1006.93 | 801 | 781 | 192.6 |
| D | 12 | 233 | 105352 | 542.81 | 801 | 781 | 192.6 |
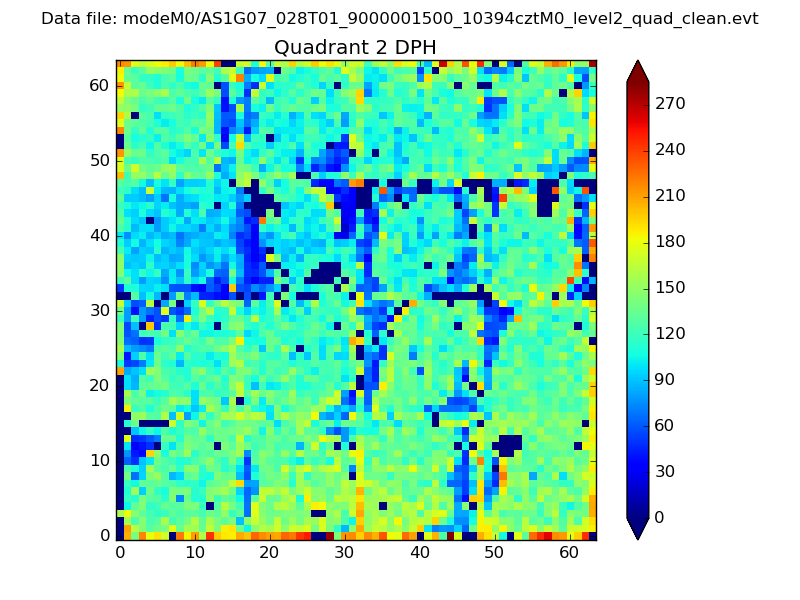
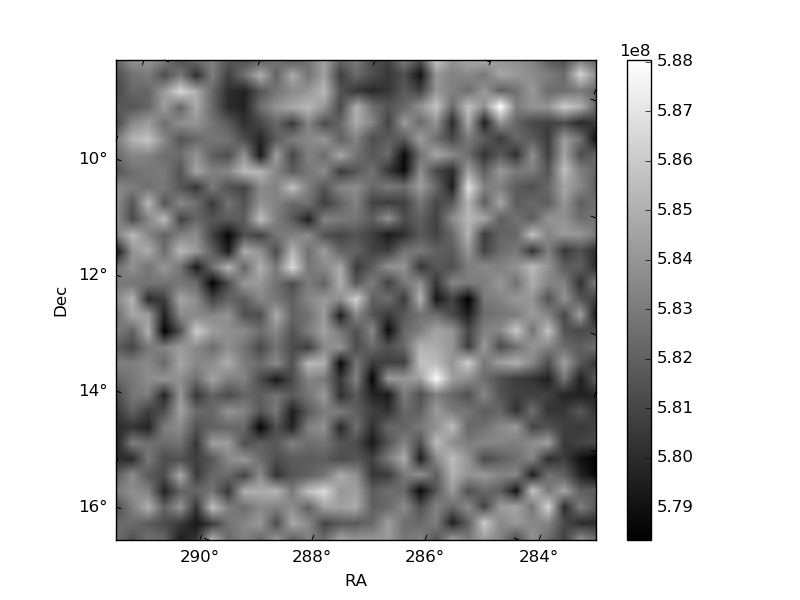
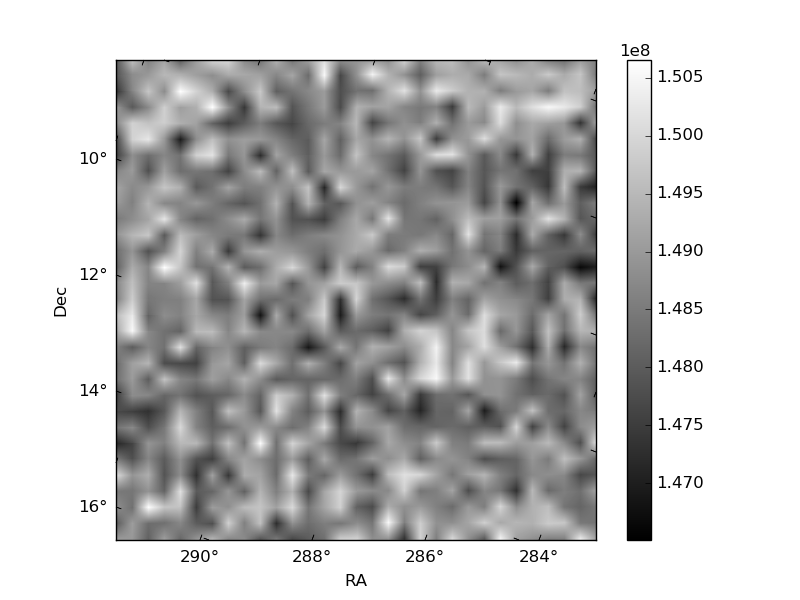
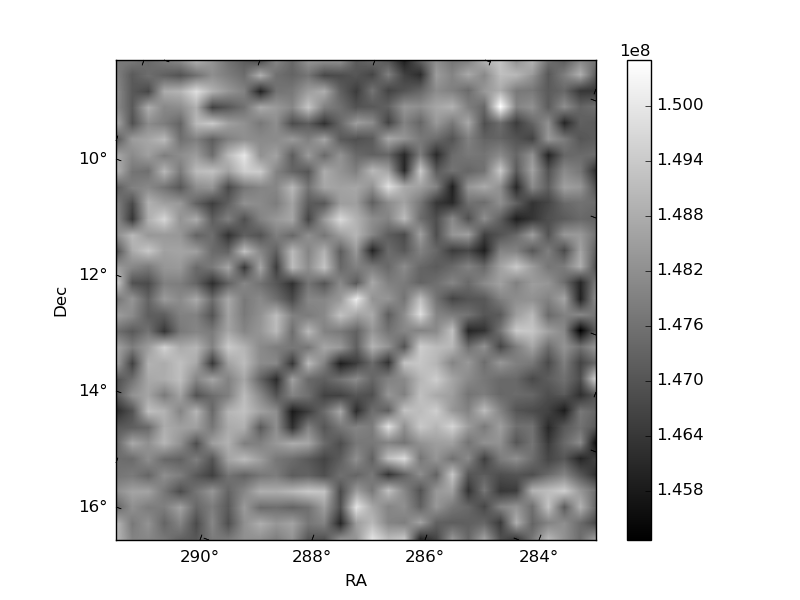
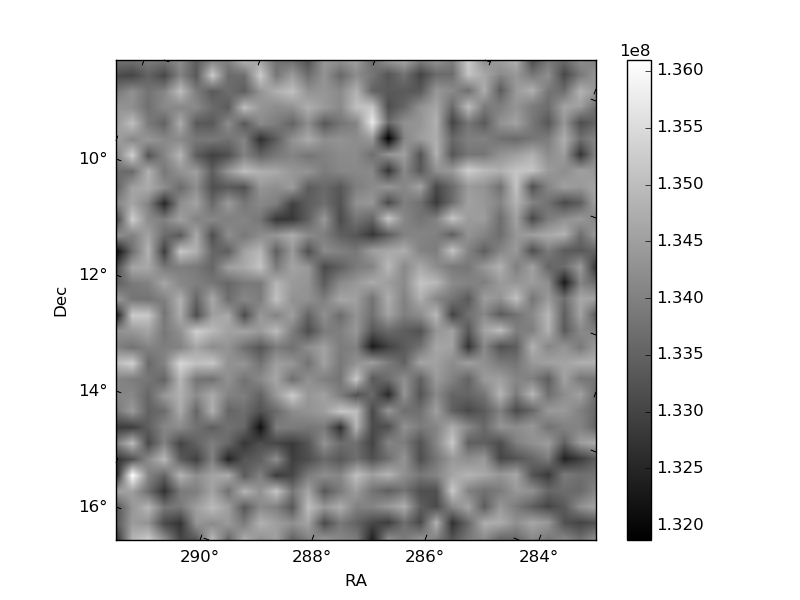
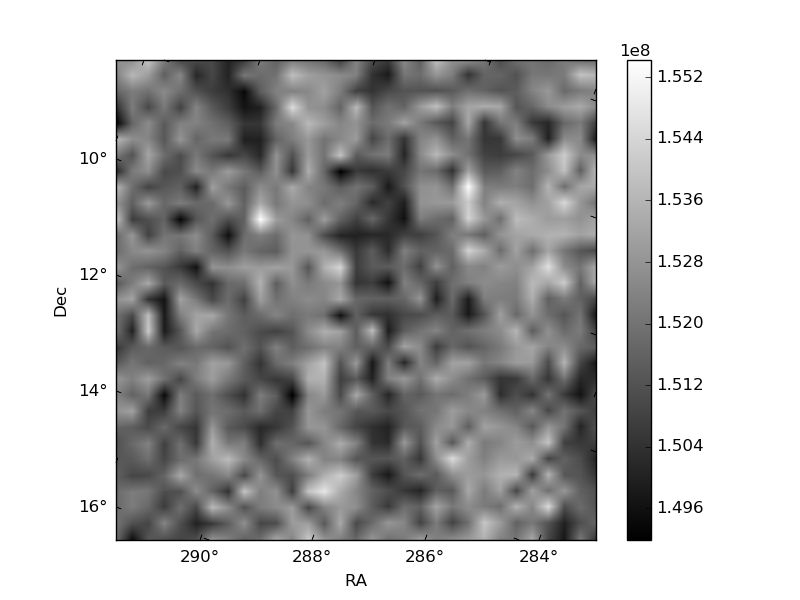
Histogram calculated using DETX and DETY for each event in the final _common_clean file
| Quadrant A | 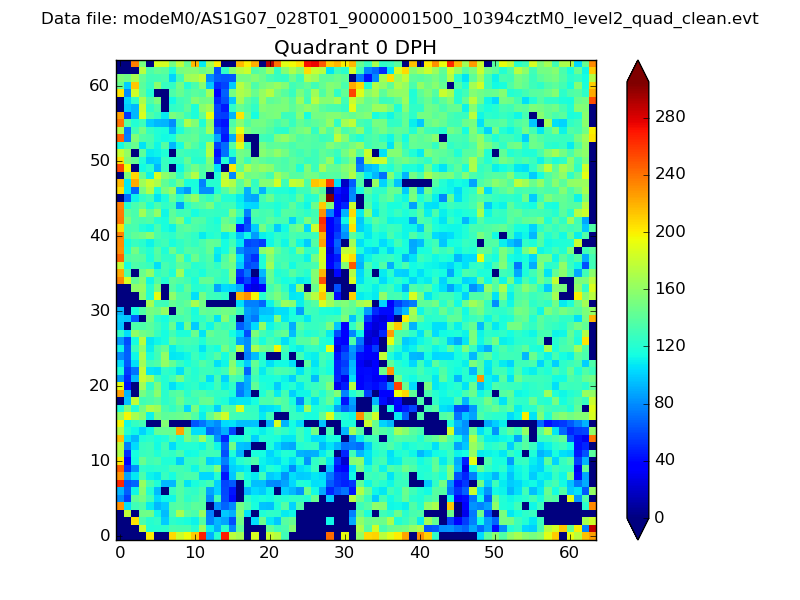 |
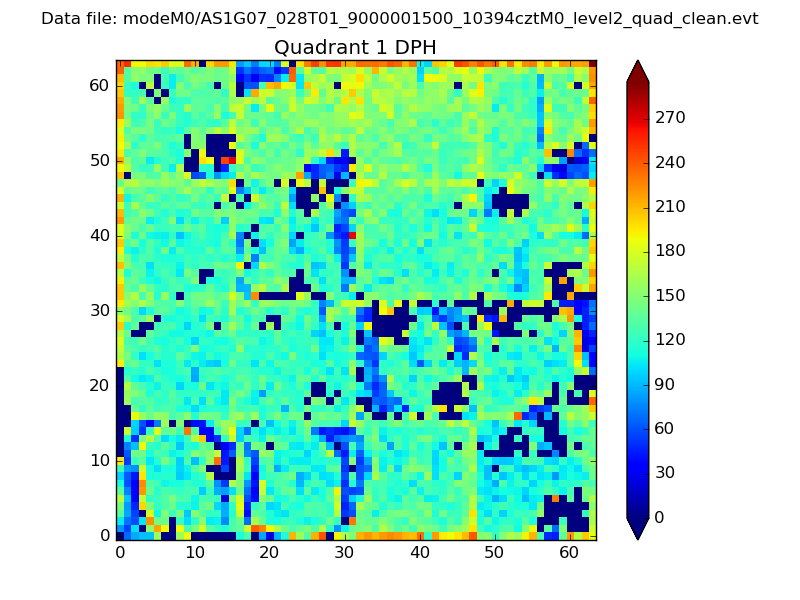 |
Quadrant B |
|---|---|---|---|
| Quadrant D | 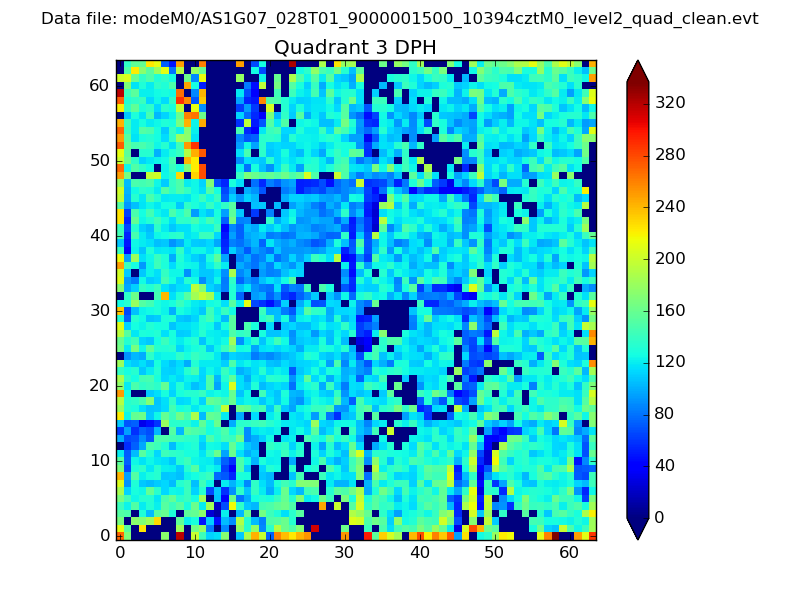 |
 |
Quadrant C |
| Plot type | Count rate plots | Images |
|---|---|---|
| Comparison with Poisson distribution Blue bars denote a histogram of data divided into 1 sec bins. Red curve is a Poisson curve with rate = median count rate of data. |
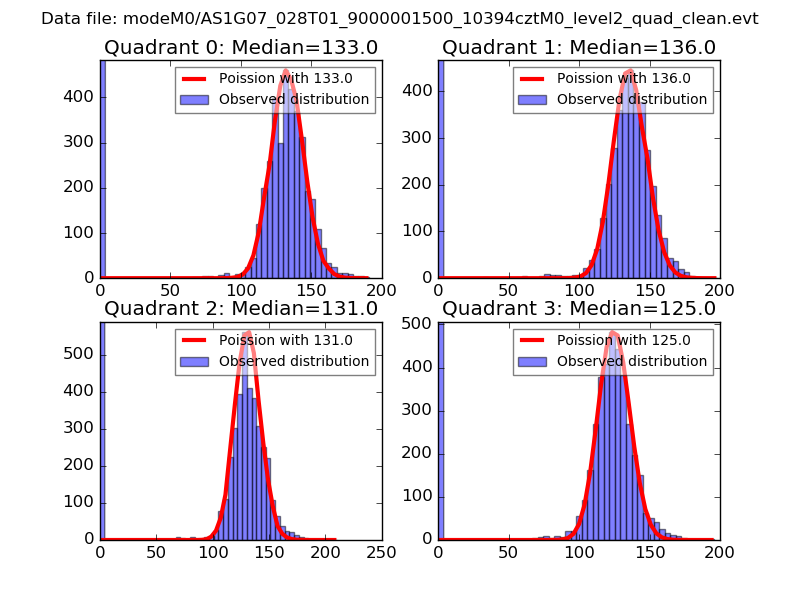 |
 |
| Quadrant-wise count rates Data is divided into 100 sec bins |
 |
|
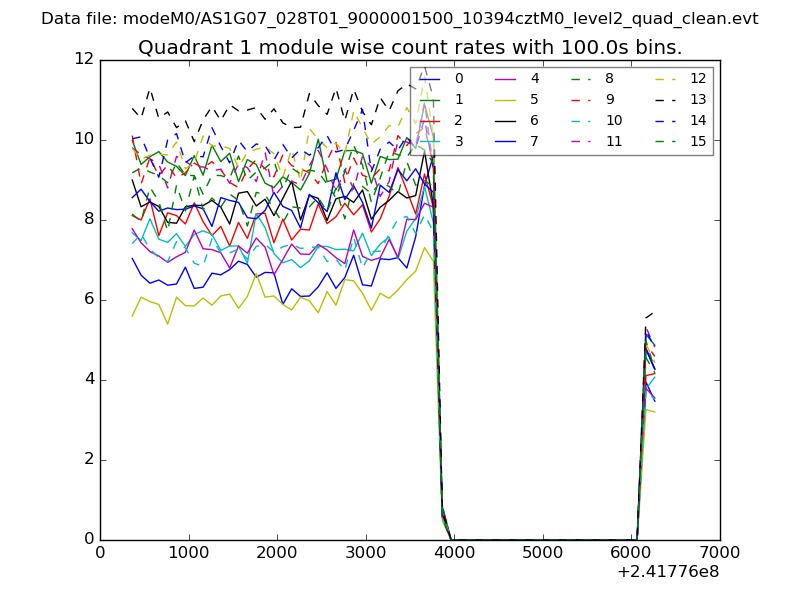
| Module-wise count rates for Quadrant A Data is divided into 100 sec bins |
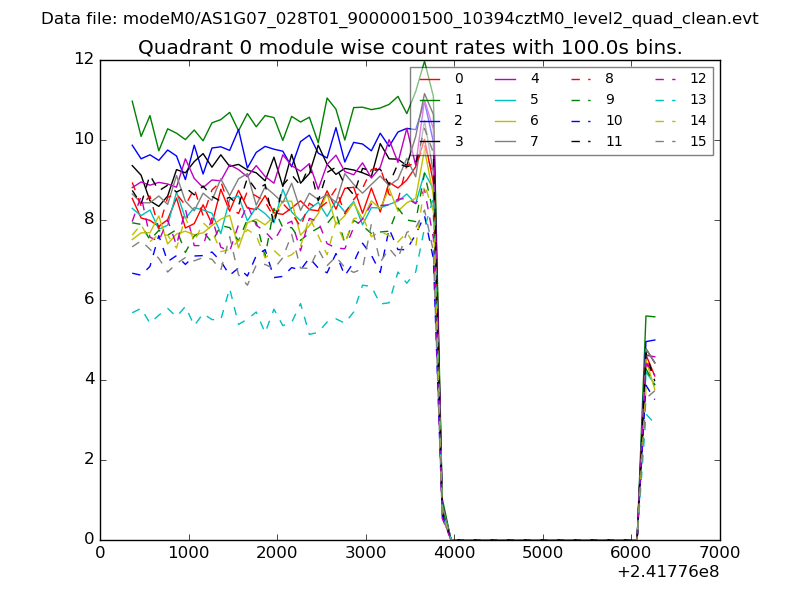 |
 |
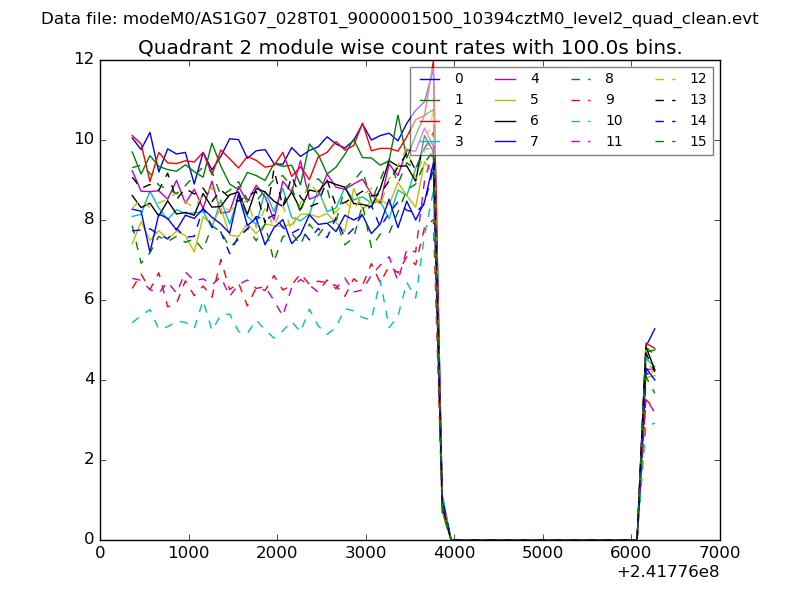
| Module-wise count rates for Quadrant B Data is divided into 100 sec bins |
 |
 |
| Module-wise count rates for Quadrant C Data is divided into 100 sec bins |
 |
 |
| Module-wise count rates for Quadrant D Data is divided into 100 sec bins |
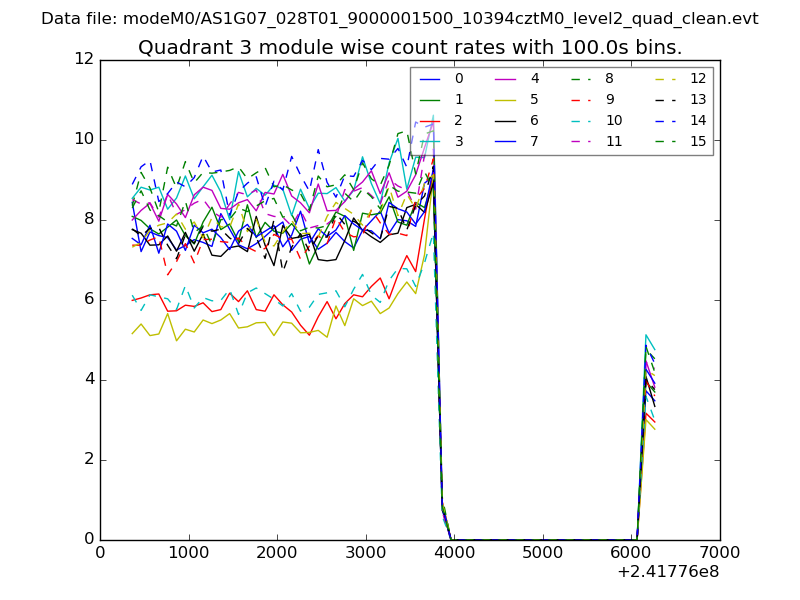 |
 |
| Parameter | Plot |
|---|---|
| CZT HV Monitor | 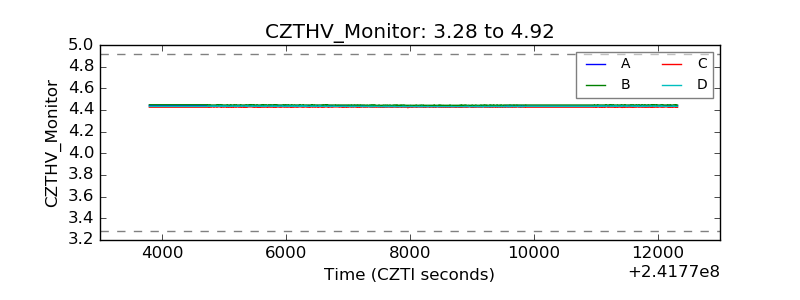 |
| D_VDD | 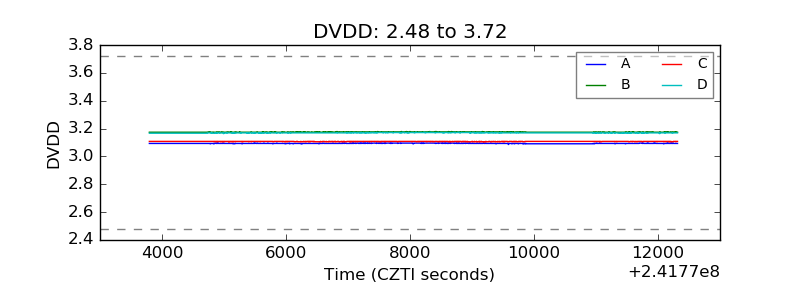 |
| Temperature 1 | 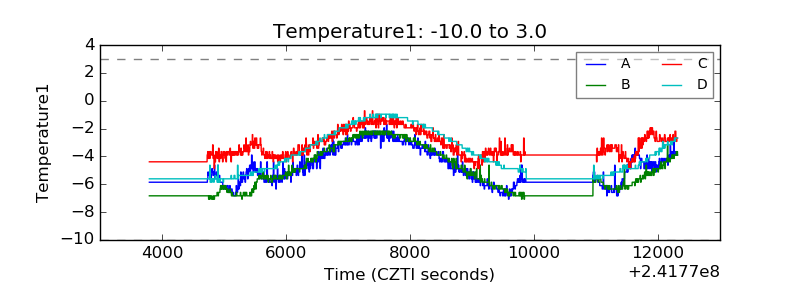 |
| Veto HV Monitor | 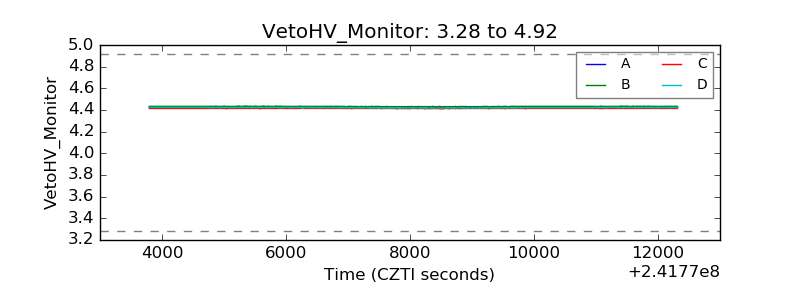 |
| Veto LLD | 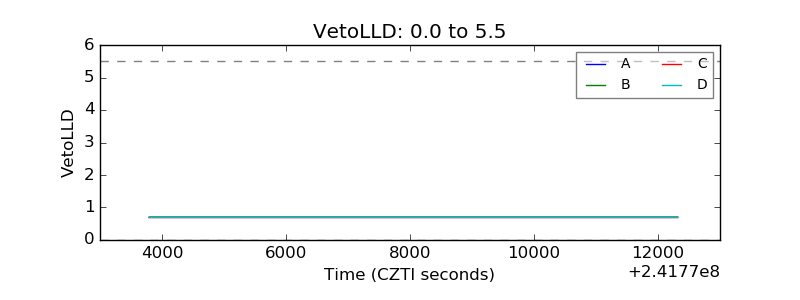 |
| Alpha Counter |  |
| _CPM_Rate | 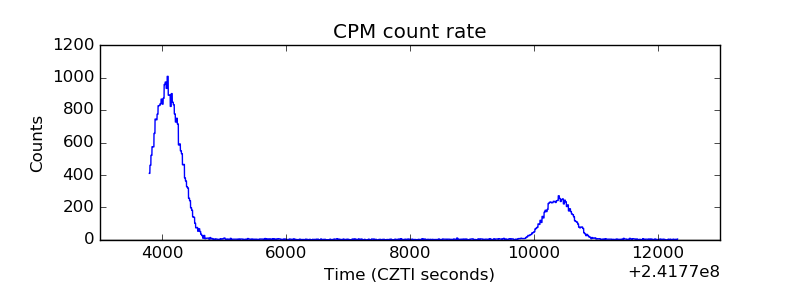 |
| CZT Counter | 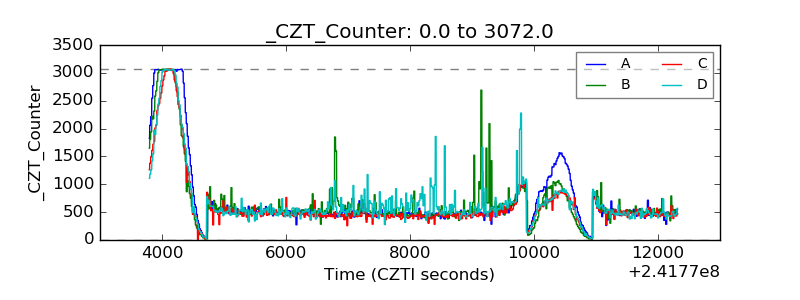 |
| +2.5 Volts monitor |  |
| +5 Volts monitor |  |
| _ROLL_ROT | 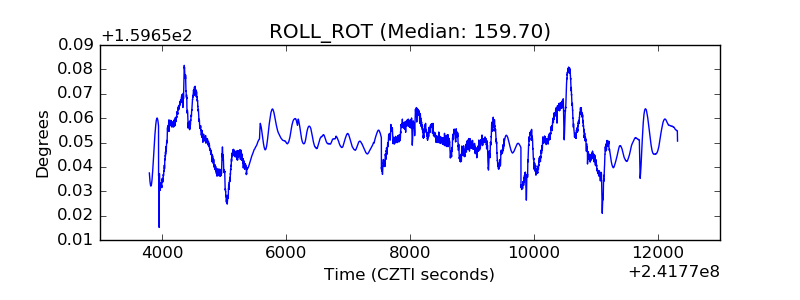 |
| _Roll_DEC | 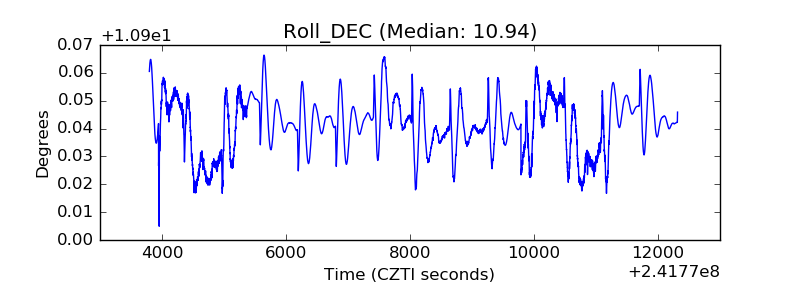 |
| _Roll_RA | 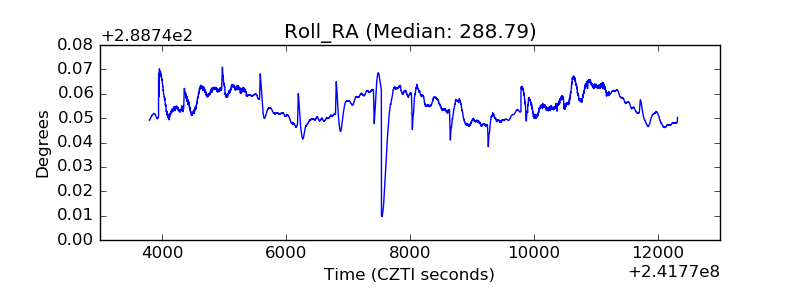 |
| Veto Counter | 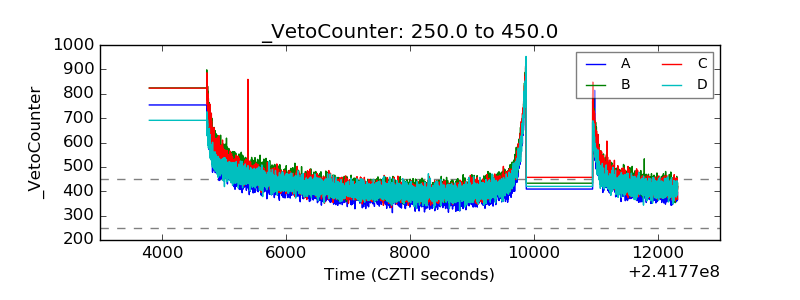 |