| Param | Original file | Final file |
|---|---|---|
| Filename | modeM0/AS1G07_028T01_9000001500_10395cztM0_level2.evt | modeM0/AS1G07_028T01_9000001500_10395cztM0_level2_quad_clean.evt |
| Size (bytes) | 143,830,080 | 15,940,800 |
| Size | 137.2 MB | 15.2 MB |
| Events in quadrant A | 968,602 | 86,748 |
| Events in quadrant B | 1,137,468 | 89,497 |
| Events in quadrant C | 939,146 | 86,446 |
| Events in quadrant D | 1,175,340 | 77,136 |
| Mode M0 | |||
|---|---|---|---|
| Quadrant | BADHDUFLAG | Total packets | Discarded packets |
| A | 0 | 4009 | 0 |
| B | 0 | 4513 | 0 |
| C | 0 | 3995 | 0 |
| D | 0 | 4691 | 0 |
| Mode SS | |||
|---|---|---|---|
| Quadrant | BADHDUFLAG | Total packets | Discarded packets |
| A | 0 | 40 | 0 |
| B | 0 | 40 | 0 |
| C | 0 | 40 | 0 |
| D | 0 | 40 | 0 |
| Quadrant | Total seconds | Saturated seconds | Saturation percentage |
|---|---|---|---|
| A | 1950 | 22 | 1.128205% |
| B | 1950 | 49 | 2.512821% |
| C | 1950 | 13 | 0.666667% |
| D | 1951 | 83 | 4.254229% |
Noise dominated data is calculated using 1-second bins in cleaned event files. If a bin has >2000 counts, and if more than 50% of those come from <1% of pixels, then it is considered to be noise-dominated and hence unusable.
| Quadrant | # 1 sec bins | Bins with >0 counts | Bins with >2000 counts | High rate bins dominated by noise | Noise dominated (total time) | Noise dominated (detector-on time) | Marked lightcurve |
|---|---|---|---|---|---|---|---|
| A | 1950 | 1950 | 0 | 0 | 0.00% | 0.00% |  |
| B | 1950 | 1950 | 20 | 20 | 1.03% | 1.03% | 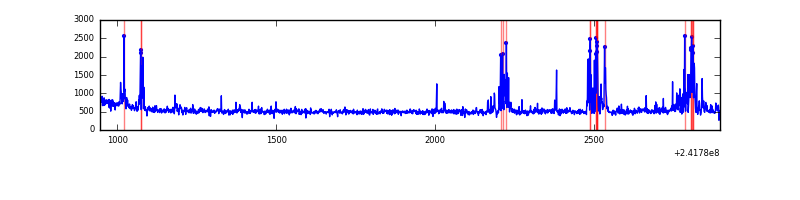 |
| C | 1950 | 1950 | 0 | 0 | 0.00% | 0.00% | 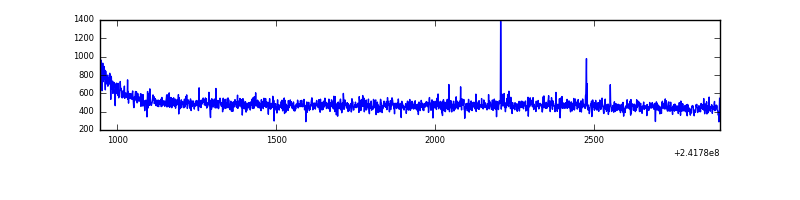 |
| D | 1951 | 1951 | 57 | 57 | 2.92% | 2.92% | 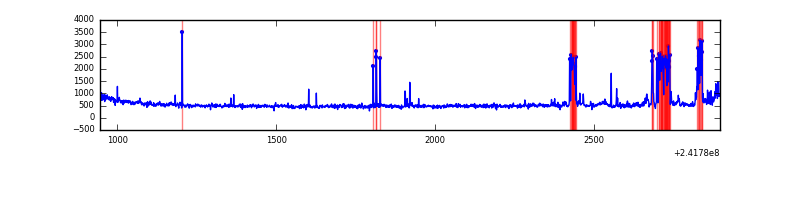 |
Top three noisy pixels from each quadrant. If the there are fewer than three noisy pixels in the level2.evt file, extra rows are filled as -1
| Pixel properties | Quadrant properties | ||||||
|---|---|---|---|---|---|---|---|
| Quadrant | DetID | PixID | Counts | Sigma | Mean | Median | Sigma |
| A | 1 | 162 | 3443 | 60.14 | 249 | 243 | 53.2 |
| A | 8 | 15 | 3087 | 53.45 | 249 | 243 | 53.2 |
| A | 0 | 226 | 2232 | 37.38 | 249 | 243 | 53.2 |
| B | 4 | 239 | 128268 | 2612.91 | 249 | 244 | 49.0 |
| B | 0 | 214 | 28483 | 576.34 | 249 | 244 | 49.0 |
| B | 12 | 111 | 5529 | 107.86 | 249 | 244 | 49.0 |
| C | 14 | 234 | 5494 | 92.26 | 239 | 240 | 56.9 |
| C | 13 | 61 | 1754 | 26.58 | 239 | 240 | 56.9 |
| C | 14 | 67 | 619 | 6.65 | 239 | 240 | 56.9 |
| D | 2 | 33 | 183066 | 3197.29 | 232 | 226 | 57.2 |
| D | 1 | 20 | 59755 | 1040.97 | 232 | 226 | 57.2 |
| D | 8 | 195 | 51644 | 899.14 | 232 | 226 | 57.2 |
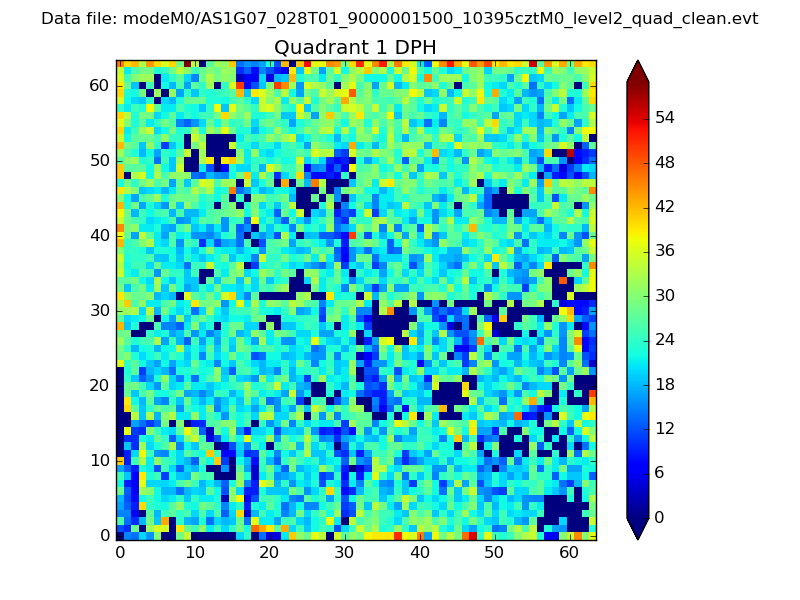
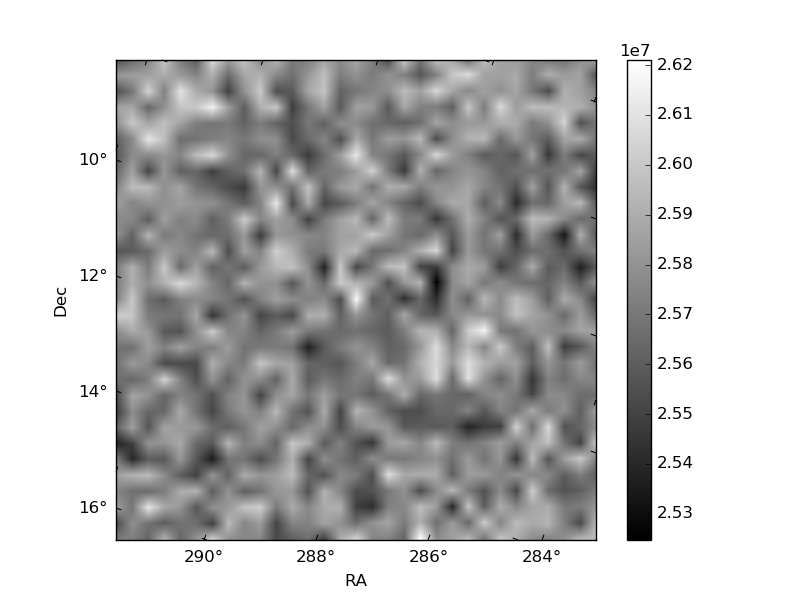
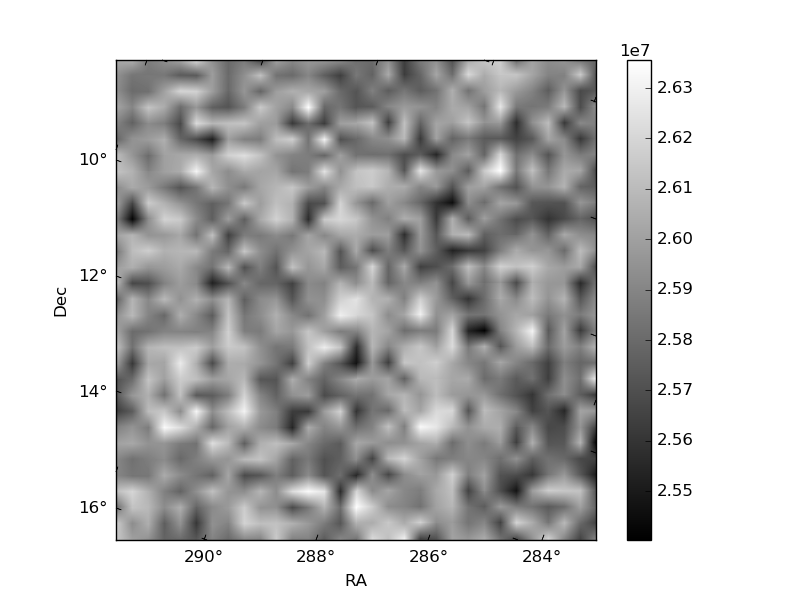
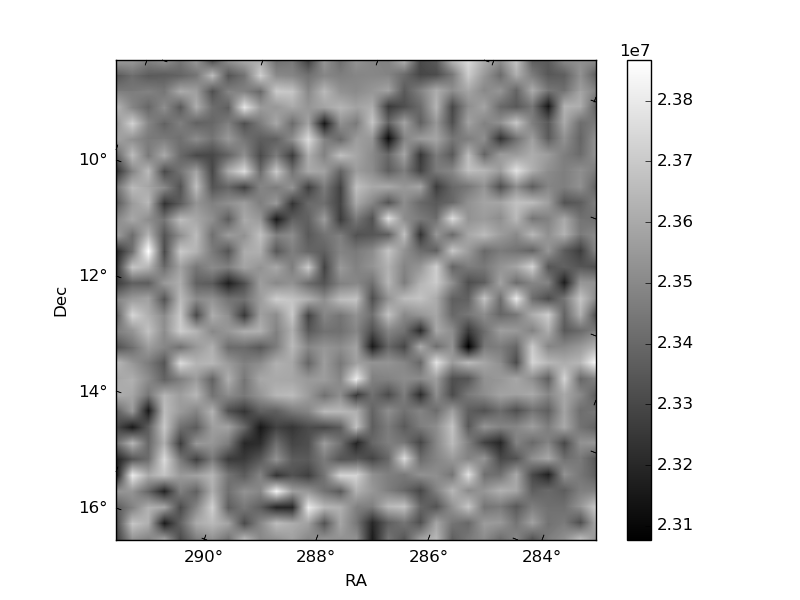
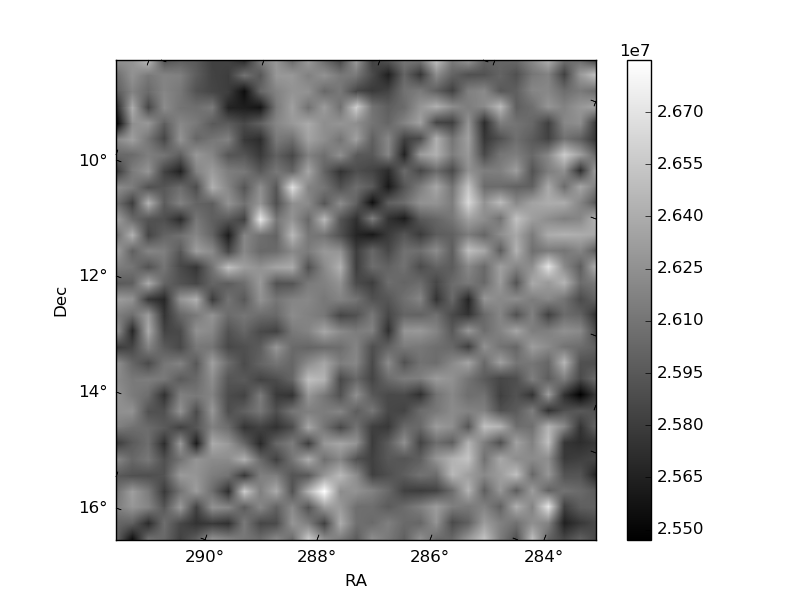
Histogram calculated using DETX and DETY for each event in the final _common_clean file
| Quadrant A | 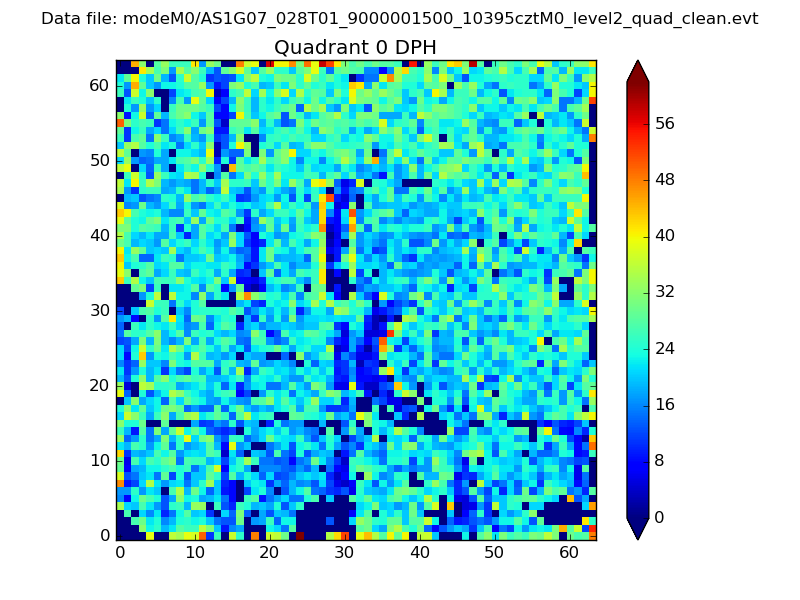 |
 |
Quadrant B |
|---|---|---|---|
| Quadrant D | 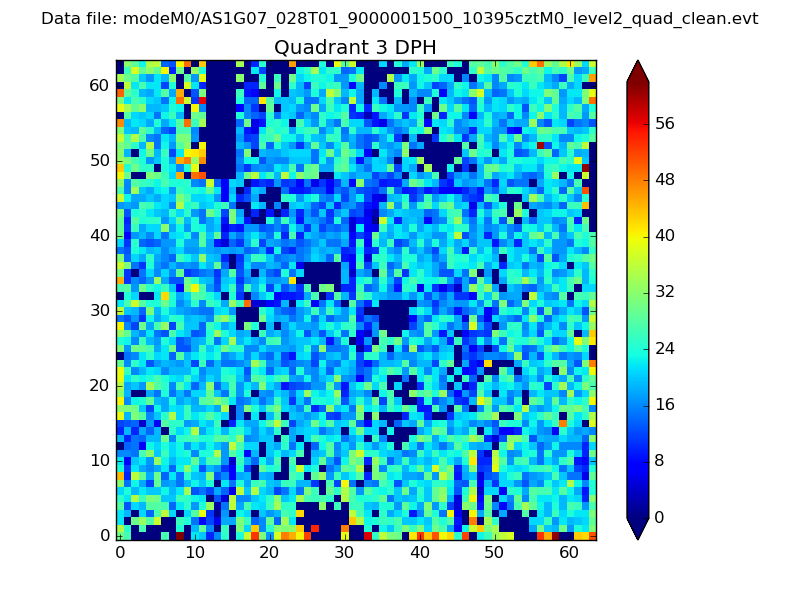 |
 |
Quadrant C |
| Plot type | Count rate plots | Images |
|---|---|---|
| Comparison with Poisson distribution Blue bars denote a histogram of data divided into 1 sec bins. Red curve is a Poisson curve with rate = median count rate of data. |
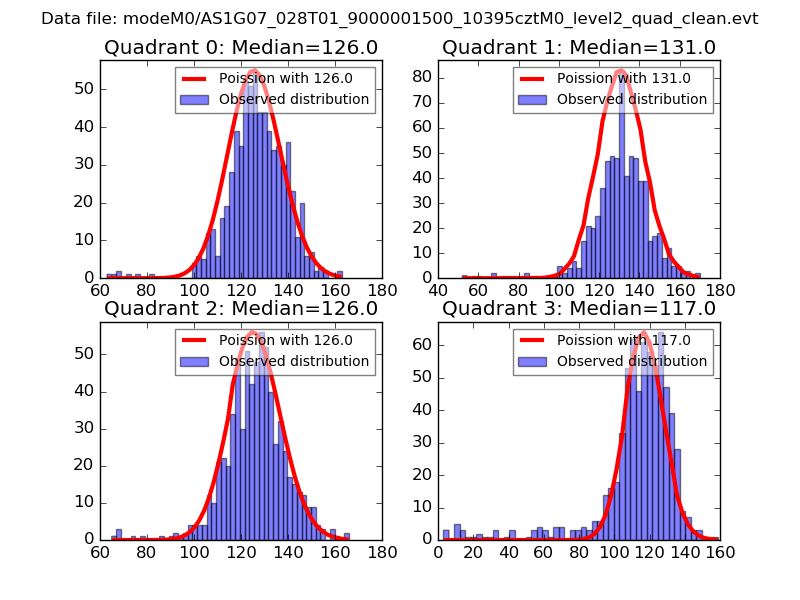 |
 |
| Quadrant-wise count rates Data is divided into 100 sec bins |
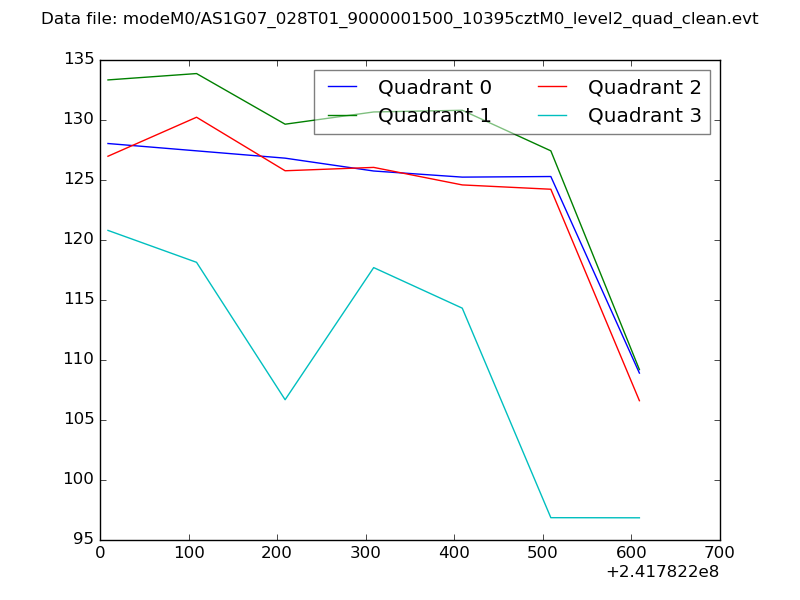 |
|
| Module-wise count rates for Quadrant A Data is divided into 100 sec bins |
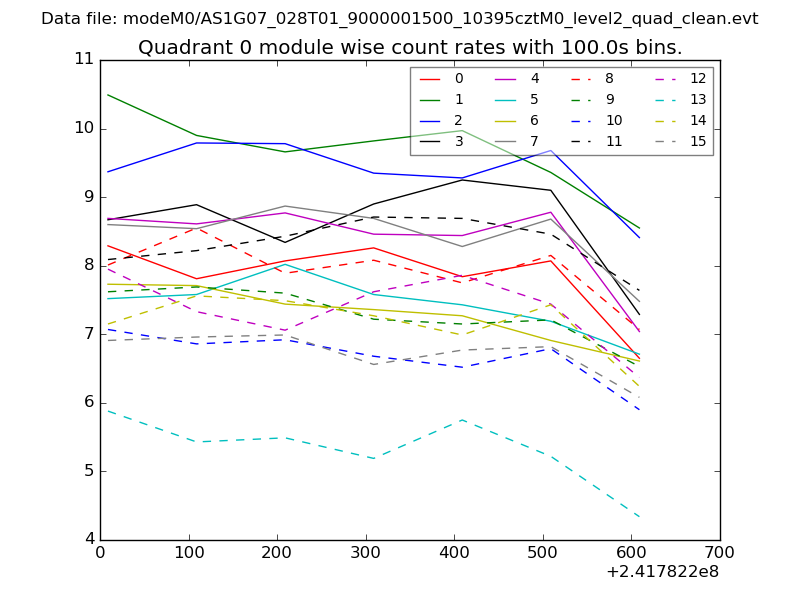 |
 |
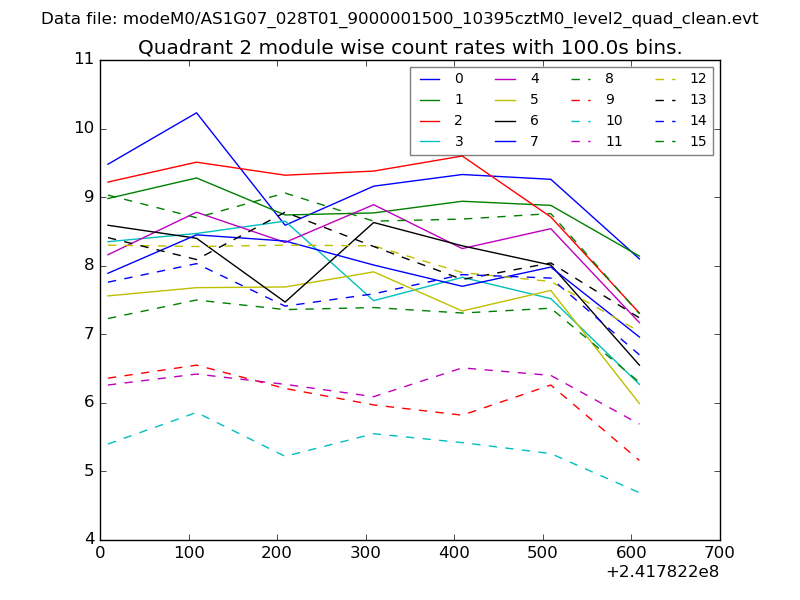
| Module-wise count rates for Quadrant B Data is divided into 100 sec bins |
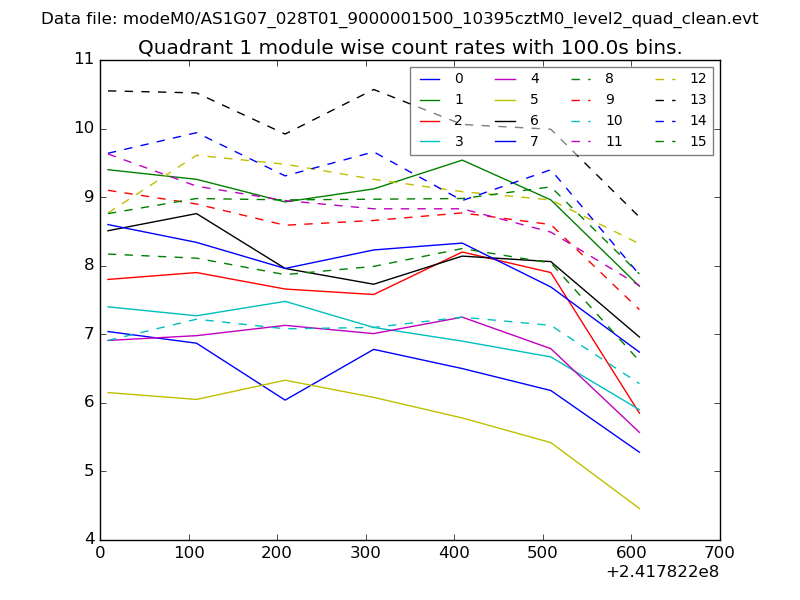 |
 |
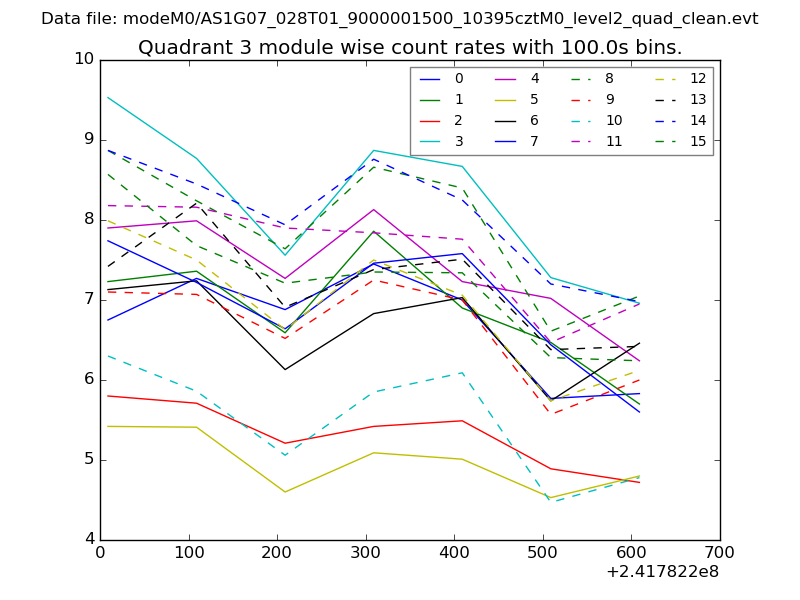
| Module-wise count rates for Quadrant C Data is divided into 100 sec bins |
 |
 |
| Module-wise count rates for Quadrant D Data is divided into 100 sec bins |
 |
 |
| Parameter | Plot |
|---|---|
| CZT HV Monitor | 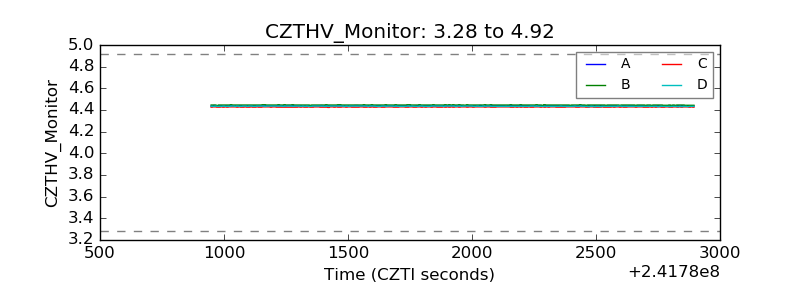 |
| D_VDD | 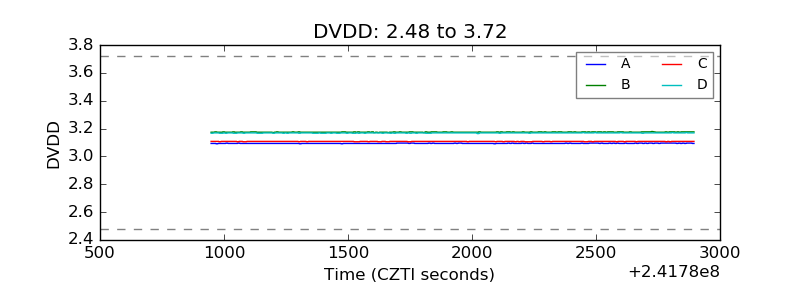 |
| Temperature 1 |  |
| Veto HV Monitor | 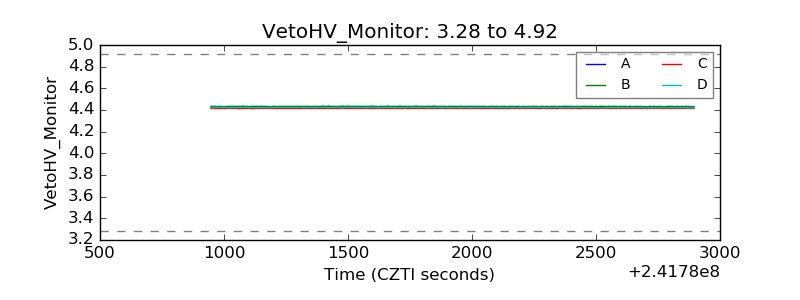 |
| Veto LLD | 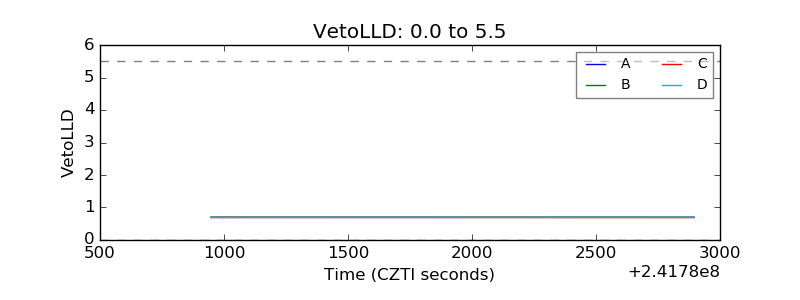 |
| Alpha Counter | 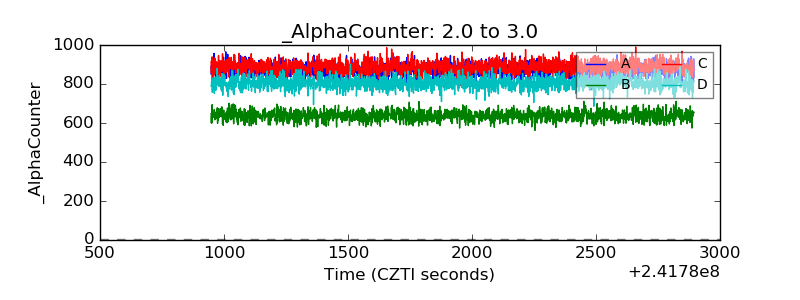 |
| _CPM_Rate | 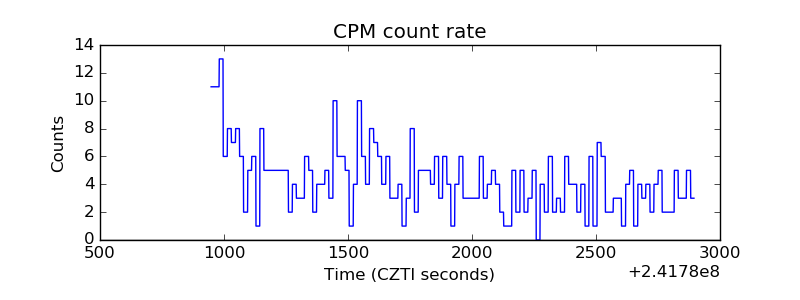 |
| CZT Counter |  |
| +2.5 Volts monitor |  |
| +5 Volts monitor | 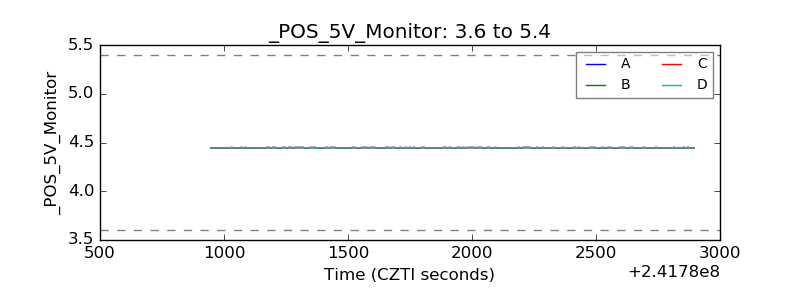 |
| _ROLL_ROT | 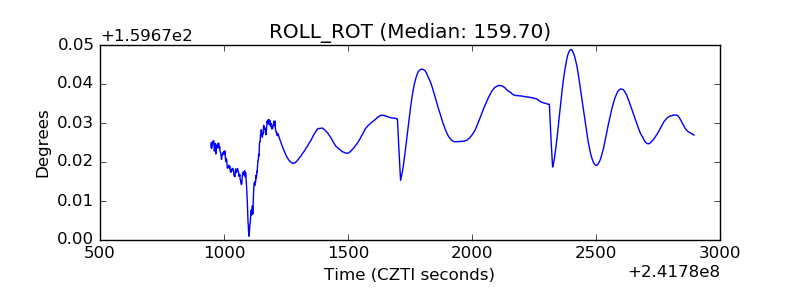 |
| _Roll_DEC | 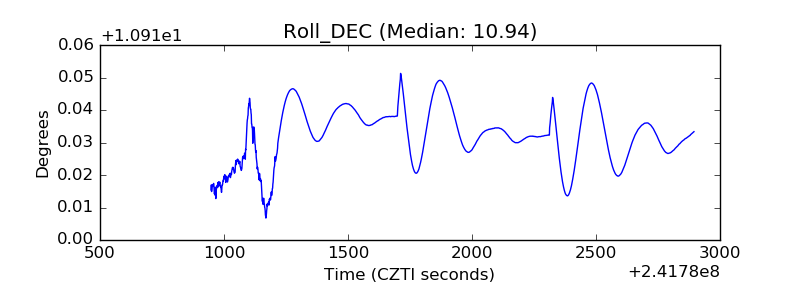 |
| _Roll_RA | 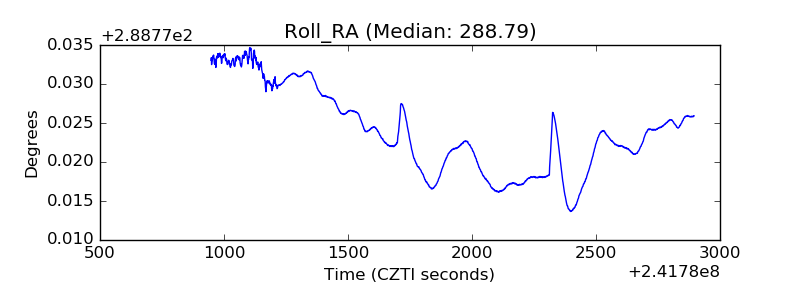 |
| Veto Counter | 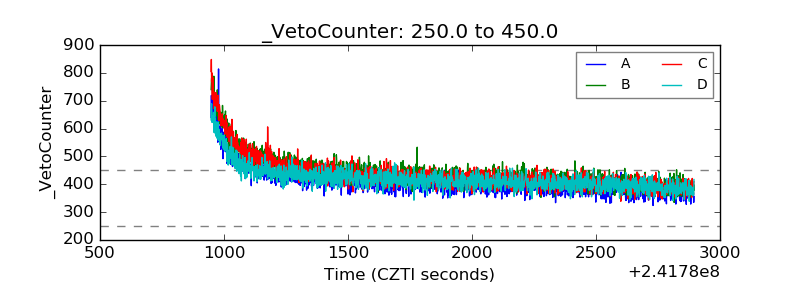 |