| Param | Original file | Final file |
|---|---|---|
| Filename | modeM0/AS1G07_057T02_9000001504cztM0_level2.fits | modeM0/AS1G07_057T02_9000001504cztM0_level2_quad_clean.evt |
| Size (bytes) | 519,111,360 | 371,669,760 |
| Size | 495.1 MB | 354.5 MB |
| Events in quadrant A | 5,202,520 | 2,644,304 |
| Events in quadrant B | 2,787,168 | 2,004,035 |
| Events in quadrant C | 2,496,304 | 1,840,085 |
| Events in quadrant D | 2,254,550 | 1,792,581 |
| Mode M0 | |||
|---|---|---|---|
| Quadrant | BADHDUFLAG | Total packets | Discarded packets |
| A | 0 | 89475 | 0 |
| B | 0 | 92212 | 0 |
| C | 0 | 88473 | 0 |
| D | 0 | 112710 | 0 |
| Mode M9 | |||
|---|---|---|---|
| Quadrant | BADHDUFLAG | Total packets | Discarded packets |
| A | 0 | 97 | 0 |
| B | 0 | 97 | 0 |
| C | 0 | 96 | 0 |
| D | 0 | 97 | 0 |
| Mode SS | |||
|---|---|---|---|
| Quadrant | BADHDUFLAG | Total packets | Discarded packets |
| A | 0 | 880 | 0 |
| B | 0 | 934 | 0 |
| C | 0 | 953 | 0 |
| D | 0 | 939 | 0 |
| Quadrant | Total seconds | Saturated seconds | Saturation percentage |
|---|---|---|---|
| A | 43100 | 320 | 0.742459% |
| B | 41316 | 605 | 1.464324% |
| C | 43443 | 201 | 0.462675% |
| D | 45485 | 536 | 1.178410% |
Noise dominated data is calculated using 1-second bins in cleaned event files. If a bin has >2000 counts, and if more than 50% of those come from <1% of pixels, then it is considered to be noise-dominated and hence unusable.
| Quadrant | # 1 sec bins | Bins with >0 counts | Bins with >2000 counts | High rate bins dominated by noise | Noise dominated (total time) | Noise dominated (detector-on time) | Marked lightcurve |
|---|---|---|---|---|---|---|---|
| A | 69738 | 50913 | 0 | 0 | 0.00% | 0.00% |  |
| B | 69737 | 49410 | 0 | 0 | 0.00% | 0.00% |  |
| C | 69738 | 51157 | 0 | 0 | 0.00% | 0.00% |  |
| D | 69738 | 50377 | 0 | 0 | 0.00% | 0.00% |  |
Top three noisy pixels from each quadrant. If the there are fewer than three noisy pixels in the level2.evt file, extra rows are filled as -1
| Pixel properties | Quadrant properties | ||||||
|---|---|---|---|---|---|---|---|
| Quadrant | DetID | PixID | Counts | Sigma | Mean | Median | Sigma |
| A | 0 | 29 | 2984 | 6.17 | 1370 | 1334 | 267.6 |
| A | -1 | -1 | -1 | -1.0 | 1370 | 1334 | 267.6 |
| A | -1 | -1 | -1 | -1.0 | 1370 | 1334 | 267.6 |
| B | 2 | 9 | 2024 | 9.59 | 740 | 709 | 137.2 |
| B | 12 | 226 | 1665 | 6.97 | 740 | 709 | 137.2 |
| B | 5 | 232 | 1626 | 6.69 | 740 | 709 | 137.2 |
| C | 1 | 80 | 1896 | 7.42 | 659 | 614 | 172.8 |
| C | 1 | 81 | 1846 | 7.13 | 659 | 614 | 172.8 |
| C | 2 | 191 | 1674 | 6.13 | 659 | 614 | 172.8 |
| D | 6 | 67 | 1635 | 6.07 | 642 | 584 | 173.2 |
| D | 6 | 231 | 1602 | 5.88 | 642 | 584 | 173.2 |
| D | 3 | 14 | 1597 | 5.85 | 642 | 584 | 173.2 |
Histogram calculated using DETX and DETY for each event in the final _common_clean file
| Quadrant A |  |
 |
Quadrant B |
|---|---|---|---|
| Quadrant D |  |
 |
Quadrant C |
| Plot type | Count rate plots | Images |
|---|---|---|
| Comparison with Poisson distribution Blue bars denote a histogram of data divided into 1 sec bins. Red curve is a Poisson curve with rate = median count rate of data. |
 |
 |
| Quadrant-wise count rates Data is divided into 100 sec bins |
 |
|
| Module-wise count rates for Quadrant A Data is divided into 100 sec bins |
 |
 |
| Module-wise count rates for Quadrant B Data is divided into 100 sec bins |
 |
 |
| Module-wise count rates for Quadrant C Data is divided into 100 sec bins |
 |
 |
| Module-wise count rates for Quadrant D Data is divided into 100 sec bins |
 |
 |
| Parameter | Plot |
|---|---|
| CZT HV Monitor |  |
| D_VDD | 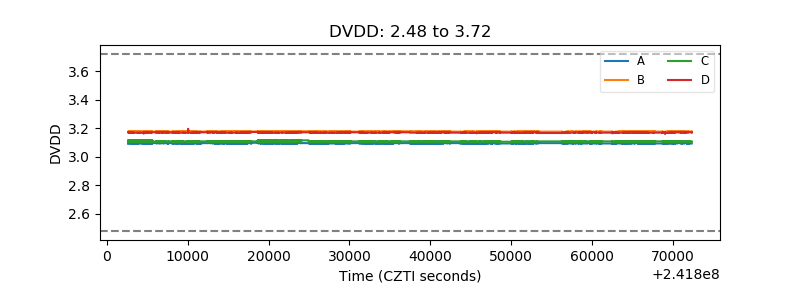 |
| Temperature 1 |  |
| Veto HV Monitor |  |
| Veto LLD |  |
| Alpha Counter |  |
| _CPM_Rate | 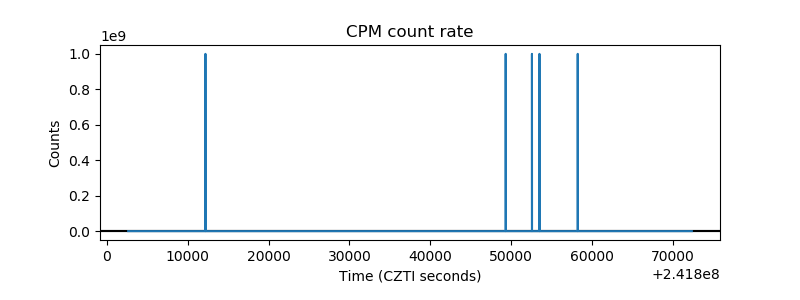 |
| CZT Counter |  |
| +2.5 Volts monitor |  |
| +5 Volts monitor |  |
| _ROLL_ROT |  |
| _Roll_DEC | 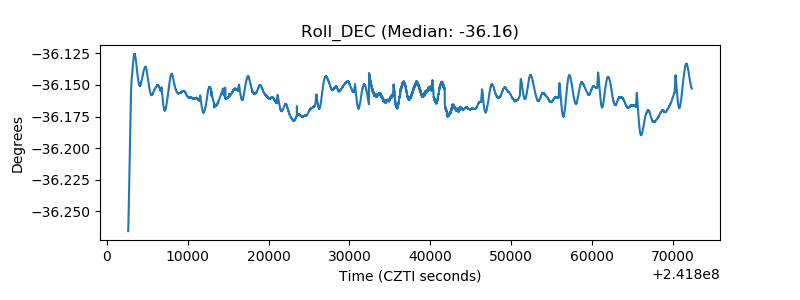 |
| _Roll_RA |  |
| Veto Counter |  |